Detailed Financial Performance Analysis Report for Prime Town PLC
VerifiedAdded on 2019/12/17
|23
|5902
|229
Report
AI Summary
This report presents a financial performance analysis of Prime Town PLC, a refrigeration equipment manufacturer. It begins with an introduction to financial analysis and ratio analysis. Task A presents a performance analysis to the board, including liquidity, profitability, gearing, asset utilization, and investor potential ratios. Task B demonstrates investment viability using payback period, accounting rate of return, net present value, discounted payback period, and internal rate of return. A critical evaluation of these techniques is also provided. Task C applies and evaluates budgeting and the break-even model. The working capital cycle is calculated and analyzed. The report concludes with recommendations based on the analysis.

FINANCE
1
1
Paraphrase This Document
Need a fresh take? Get an instant paraphrase of this document with our AI Paraphraser
Table of Contents
INTRODUCTION................................................................................................................................3
TASK A................................................................................................................................................3
1 Presentation of Performance to the Board....................................................................................3
i) Liquidity Ratios...................................................................................................................3
ii) Profitability Ratios..............................................................................................................5
Iii) Gearing ratio......................................................................................................................6
iv) Asset Utilisation................................................................................................................7
V) Investor Potential Ratio......................................................................................................8
2 Calculation of Working Capital Cycle..........................................................................................8
TASK B................................................................................................................................................9
1 Demonstrating the viability of investment by applying Investment Appraisal Techniques.........9
a) The Payback Period.............................................................................................................9
B) The Accounting Rate of Return..........................................................................................9
C) Net Present Value.............................................................................................................10
D) The Discounted Payback Period......................................................................................11
e) The Internal Rate of Return...............................................................................................11
2 Critical evaluation of the investment appraisal techniques........................................................12
TASK C..............................................................................................................................................13
1 Application and critical evaluation of Budgeting.......................................................................13
2 Critical evaluation of Break even Model....................................................................................15
CONCLUSION..................................................................................................................................16
RECOMMENDATIONS....................................................................................................................16
REFERENCES...................................................................................................................................17
APPENDIX........................................................................................................................................18
2
INTRODUCTION
Finance is the lifeline of the business. Financial analysis refers to critically evaluating
balance sheet through Ratio analysis. Various benchmarks or set criteria are utilised for examining
the financial statements. The selected company for the project is Prime town PLC, being engaged in
the manufacturing process of refrigeration equipment. The performance of an organisation is
measured by asset utilisation, liquidity, profitability, gearing and investor potential. Working capital
is a cycle for Prime Town PLC is evaluated to determine the time taken to convert the current assets
and current liability into the liquid form of cash. Further, more investment appraisal techniques are
used to assess the viability of the project and decisions based thereon to whether accepting or reject
it. Budgeting is an important financial tool applied for short term decision making and planning to
assess the obligations arising or cash flow generated. Moreover, Break even Model is critically
evaluated to better understand the applicability in different businesses.
TASK A
1 Presentation of Performance to the Board
To: Board of Prime Town PLC
From: Financial Analyst
Respected Board Members
This is to bring to the notice of Management that for evaluating the performance of Prime town
PLC, various ratio analyses are performed, and results are presented here below.
i) Liquidity Ratios
Liquidity ratios indicate the liquidity of the business assets in respect to its current
obligations. It is analysed by different ratios.
Current Ratio: Current Ratio refers to proportion of current assets of the business to its
current liabilities. It depicts the eligibility of current assets to pay off the current obligations
of Business (Lasher, 2013).
3
⊘ This is a preview!⊘
Do you want full access?
Subscribe today to unlock all pages.
Trusted by 1+ million students worldwide
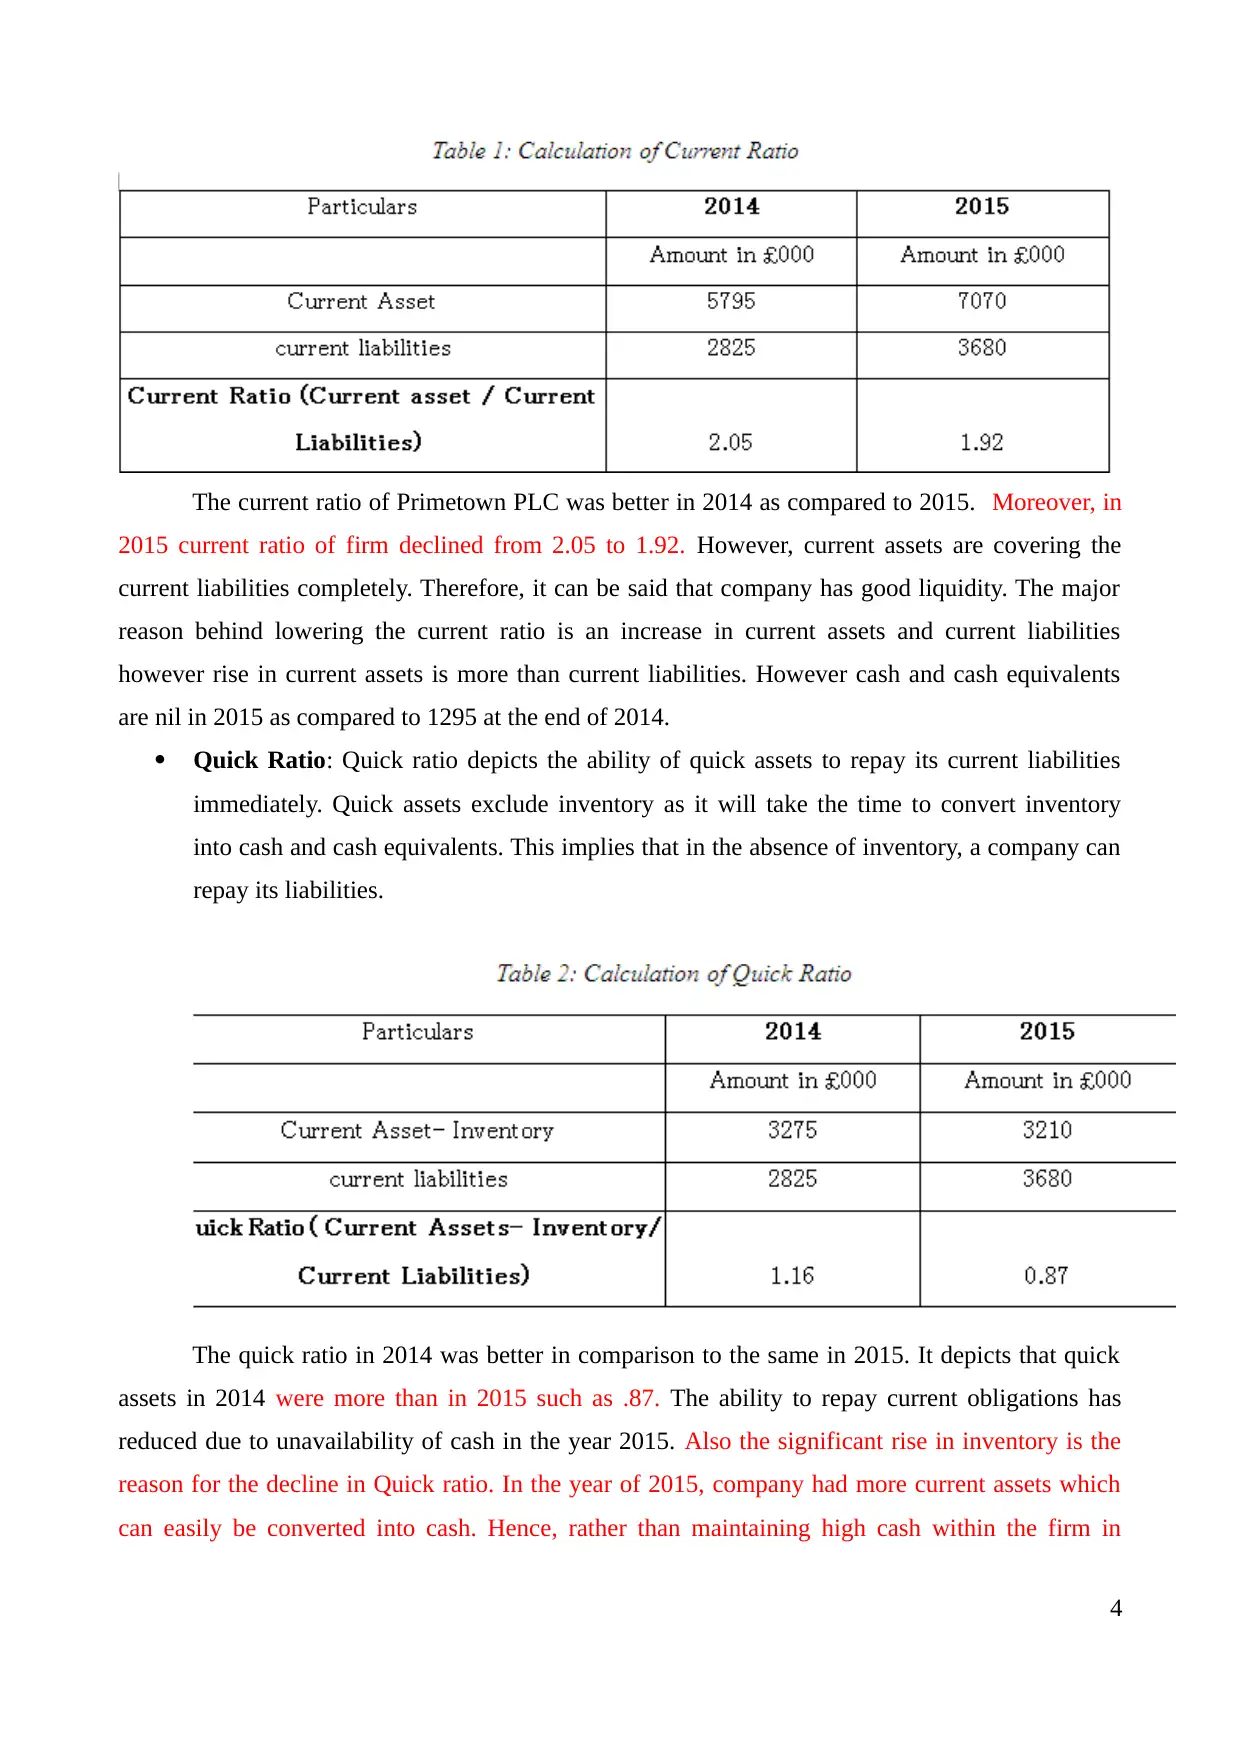
The current ratio of Primetown PLC was better in 2014 as compared to 2015. Moreover, in
2015 current ratio of firm declined from 2.05 to 1.92. However, current assets are covering the
current liabilities completely. Therefore, it can be said that company has good liquidity. The major
reason behind lowering the current ratio is an increase in current assets and current liabilities
however rise in current assets is more than current liabilities. However cash and cash equivalents
are nil in 2015 as compared to 1295 at the end of 2014.
Quick Ratio: Quick ratio depicts the ability of quick assets to repay its current liabilities
immediately. Quick assets exclude inventory as it will take the time to convert inventory
into cash and cash equivalents. This implies that in the absence of inventory, a company can
repay its liabilities.
The quick ratio in 2014 was better in comparison to the same in 2015. It depicts that quick
assets in 2014 were more than in 2015 such as .87. The ability to repay current obligations has
reduced due to unavailability of cash in the year 2015. Also the significant rise in inventory is the
reason for the decline in Quick ratio. In the year of 2015, company had more current assets which
can easily be converted into cash. Hence, rather than maintaining high cash within the firm in
4
Paraphrase This Document
Need a fresh take? Get an instant paraphrase of this document with our AI Paraphraser
access of average limit company needs to focus on investing money in other options which are
available to it.
ii) Profitability Ratios
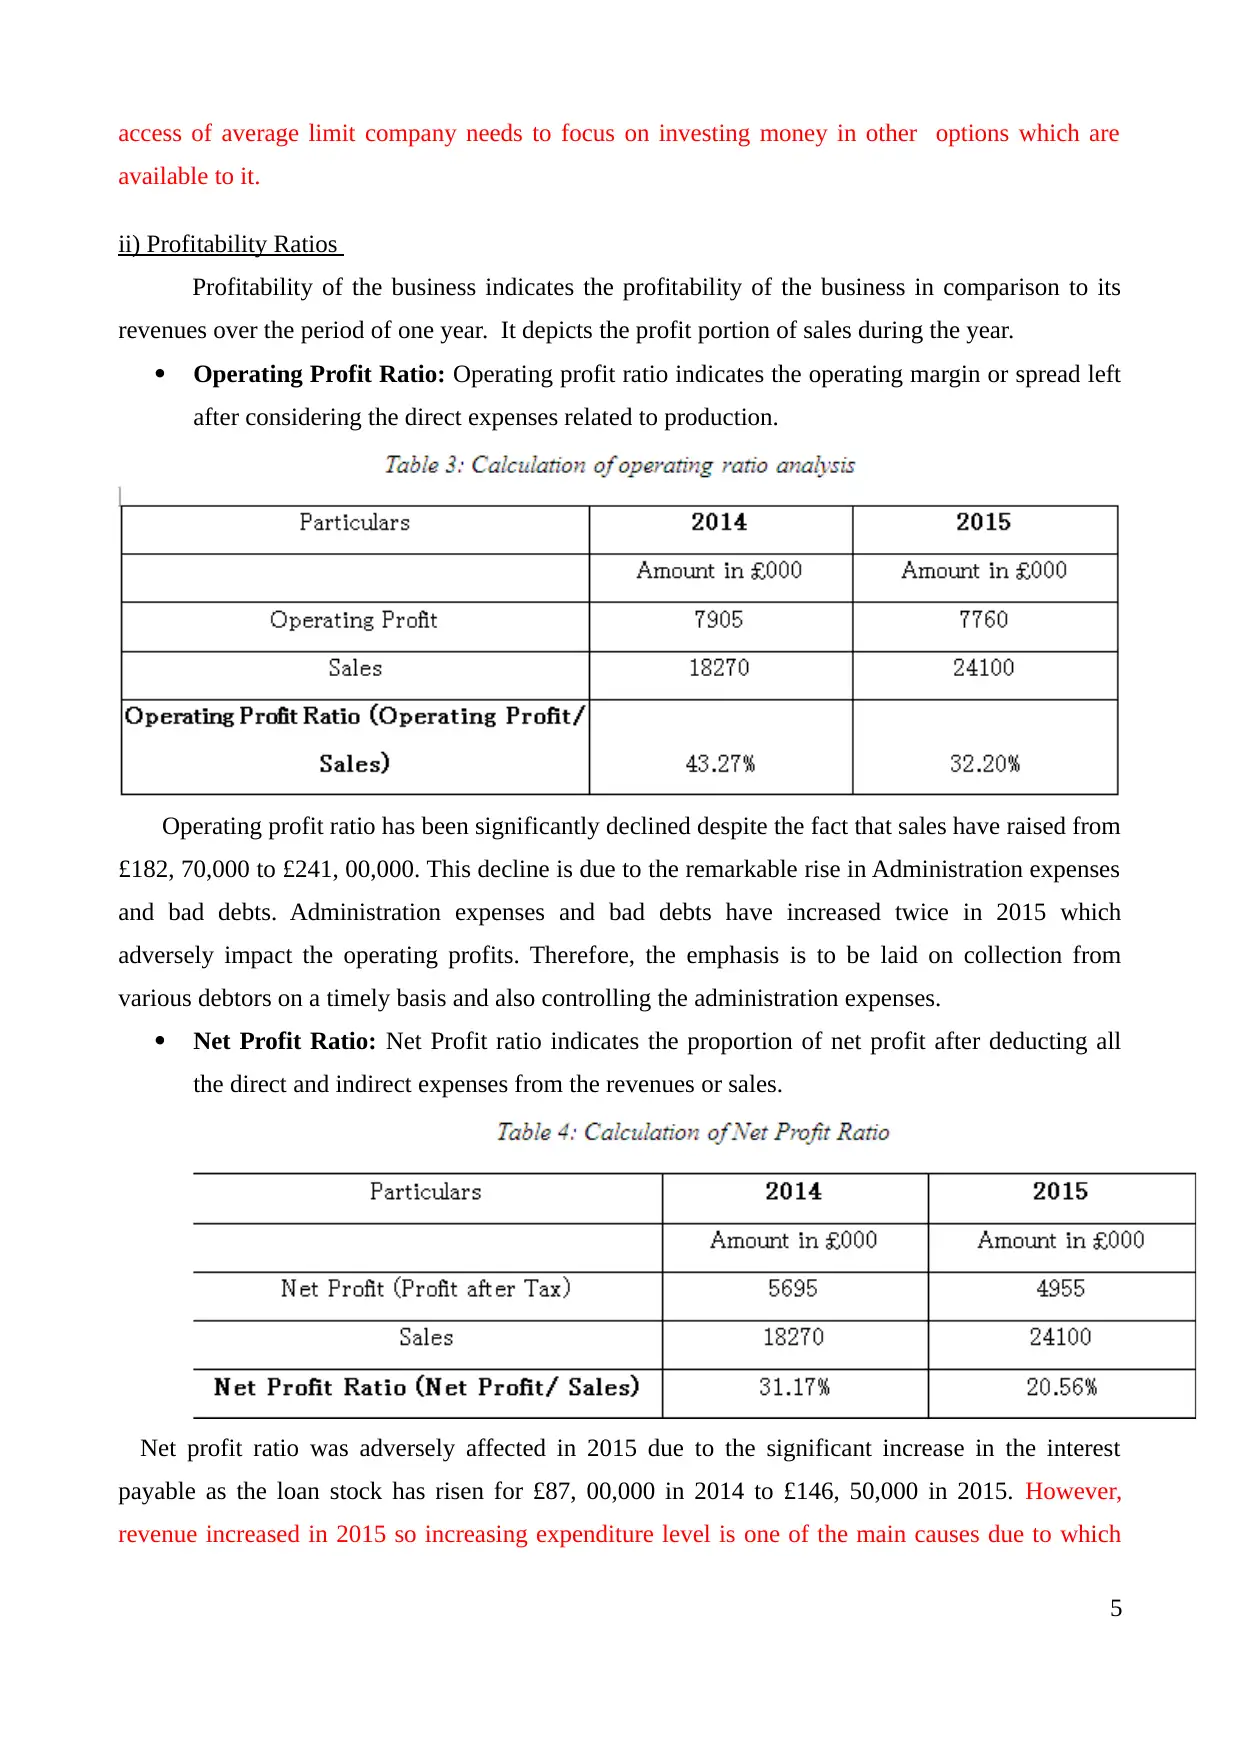
Profitability of the business indicates the profitability of the business in comparison to its
revenues over the period of one year. It depicts the profit portion of sales during the year.
Operating Profit Ratio: Operating profit ratio indicates the operating margin or spread left
after considering the direct expenses related to production.
Operating profit ratio has been significantly declined despite the fact that sales have raised from
£182, 70,000 to £241, 00,000. This decline is due to the remarkable rise in Administration expenses
and bad debts. Administration expenses and bad debts have increased twice in 2015 which
adversely impact the operating profits. Therefore, the emphasis is to be laid on collection from
various debtors on a timely basis and also controlling the administration expenses.
Net Profit Ratio: Net Profit ratio indicates the proportion of net profit after deducting all
the direct and indirect expenses from the revenues or sales.
Net profit ratio was adversely affected in 2015 due to the significant increase in the interest
payable as the loan stock has risen for £87, 00,000 in 2014 to £146, 50,000 in 2015. However,
revenue increased in 2015 so increasing expenditure level is one of the main causes due to which
5
available to it.
ii) Profitability Ratios
Profitability of the business indicates the profitability of the business in comparison to its
revenues over the period of one year. It depicts the profit portion of sales during the year.
Operating Profit Ratio: Operating profit ratio indicates the operating margin or spread left
after considering the direct expenses related to production.
Operating profit ratio has been significantly declined despite the fact that sales have raised from
£182, 70,000 to £241, 00,000. This decline is due to the remarkable rise in Administration expenses
and bad debts. Administration expenses and bad debts have increased twice in 2015 which
adversely impact the operating profits. Therefore, the emphasis is to be laid on collection from
various debtors on a timely basis and also controlling the administration expenses.
Net Profit Ratio: Net Profit ratio indicates the proportion of net profit after deducting all
the direct and indirect expenses from the revenues or sales.
Net profit ratio was adversely affected in 2015 due to the significant increase in the interest
payable as the loan stock has risen for £87, 00,000 in 2014 to £146, 50,000 in 2015. However,
revenue increased in 2015 so increasing expenditure level is one of the main causes due to which
5
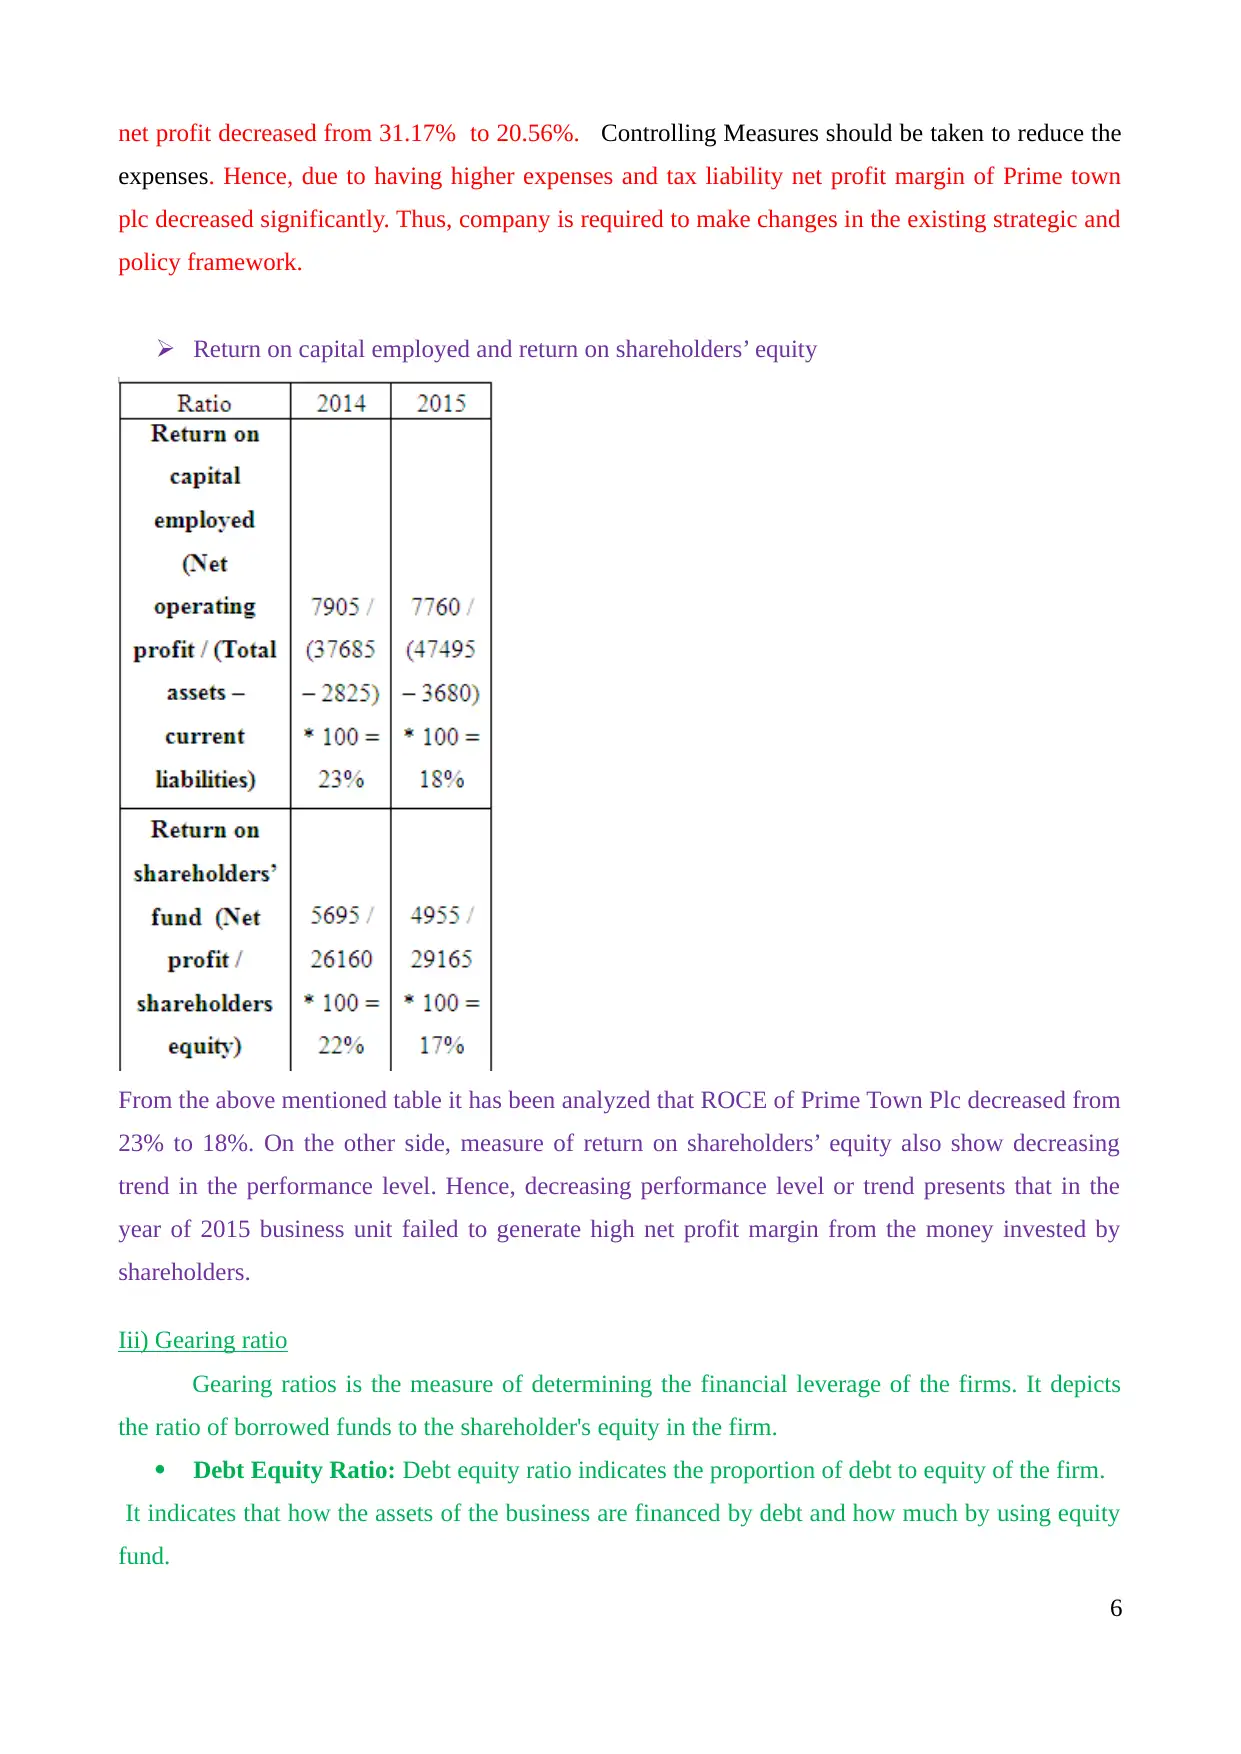
net profit decreased from 31.17% to 20.56%. Controlling Measures should be taken to reduce the
expenses. Hence, due to having higher expenses and tax liability net profit margin of Prime town
plc decreased significantly. Thus, company is required to make changes in the existing strategic and
policy framework.
Return on capital employed and return on shareholders’ equity
From the above mentioned table it has been analyzed that ROCE of Prime Town Plc decreased from
23% to 18%. On the other side, measure of return on shareholders’ equity also show decreasing
trend in the performance level. Hence, decreasing performance level or trend presents that in the
year of 2015 business unit failed to generate high net profit margin from the money invested by
shareholders.
Iii) Gearing ratio
Gearing ratios is the measure of determining the financial leverage of the firms. It depicts
the ratio of borrowed funds to the shareholder's equity in the firm.
Debt Equity Ratio: Debt equity ratio indicates the proportion of debt to equity of the firm.
It indicates that how the assets of the business are financed by debt and how much by using equity
fund.
6
⊘ This is a preview!⊘
Do you want full access?
Subscribe today to unlock all pages.
Trusted by 1+ million students worldwide
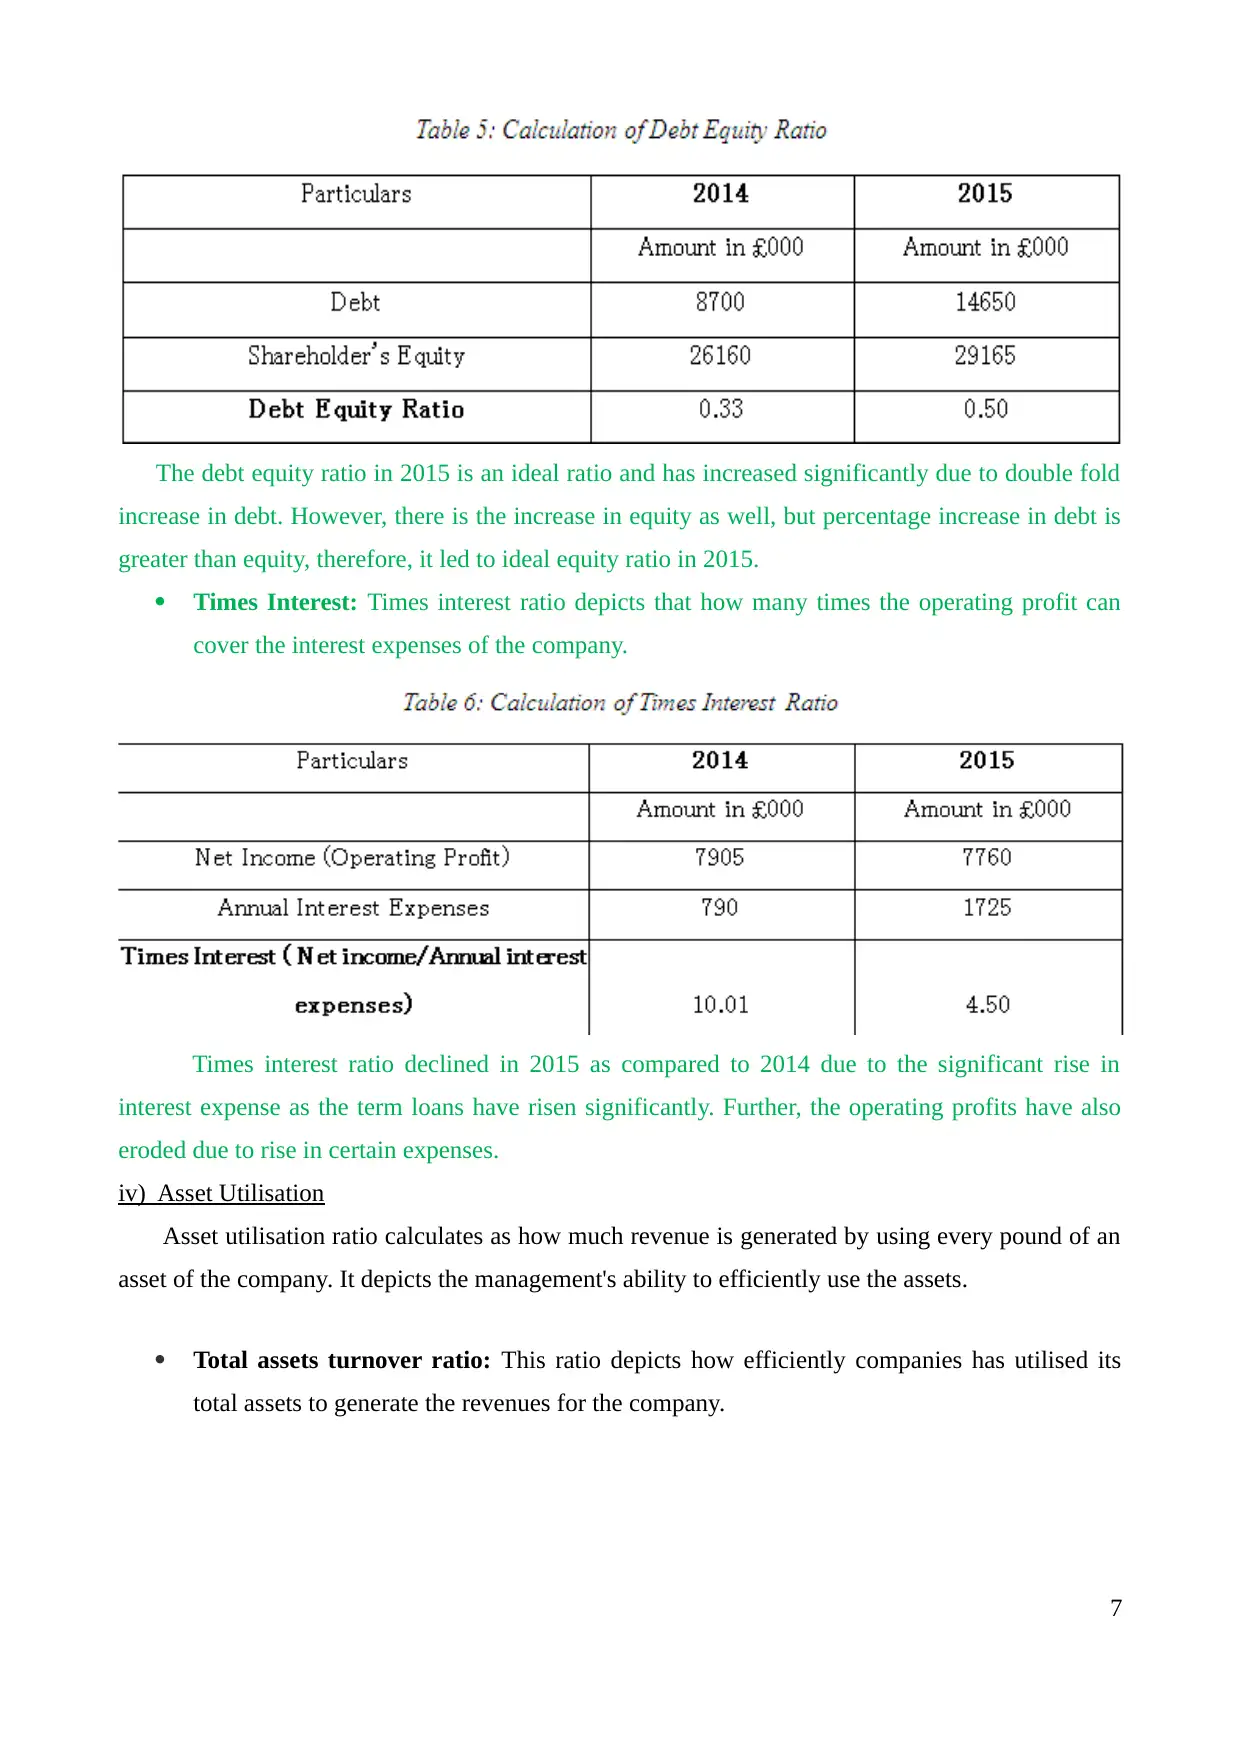
The debt equity ratio in 2015 is an ideal ratio and has increased significantly due to double fold
increase in debt. However, there is the increase in equity as well, but percentage increase in debt is
greater than equity, therefore, it led to ideal equity ratio in 2015.
Times Interest: Times interest ratio depicts that how many times the operating profit can
cover the interest expenses of the company.
Times interest ratio declined in 2015 as compared to 2014 due to the significant rise in
interest expense as the term loans have risen significantly. Further, the operating profits have also
eroded due to rise in certain expenses.
iv) Asset Utilisation
Asset utilisation ratio calculates as how much revenue is generated by using every pound of an
asset of the company. It depicts the management's ability to efficiently use the assets.
Total assets turnover ratio: This ratio depicts how efficiently companies has utilised its
total assets to generate the revenues for the company.
7
Paraphrase This Document
Need a fresh take? Get an instant paraphrase of this document with our AI Paraphraser
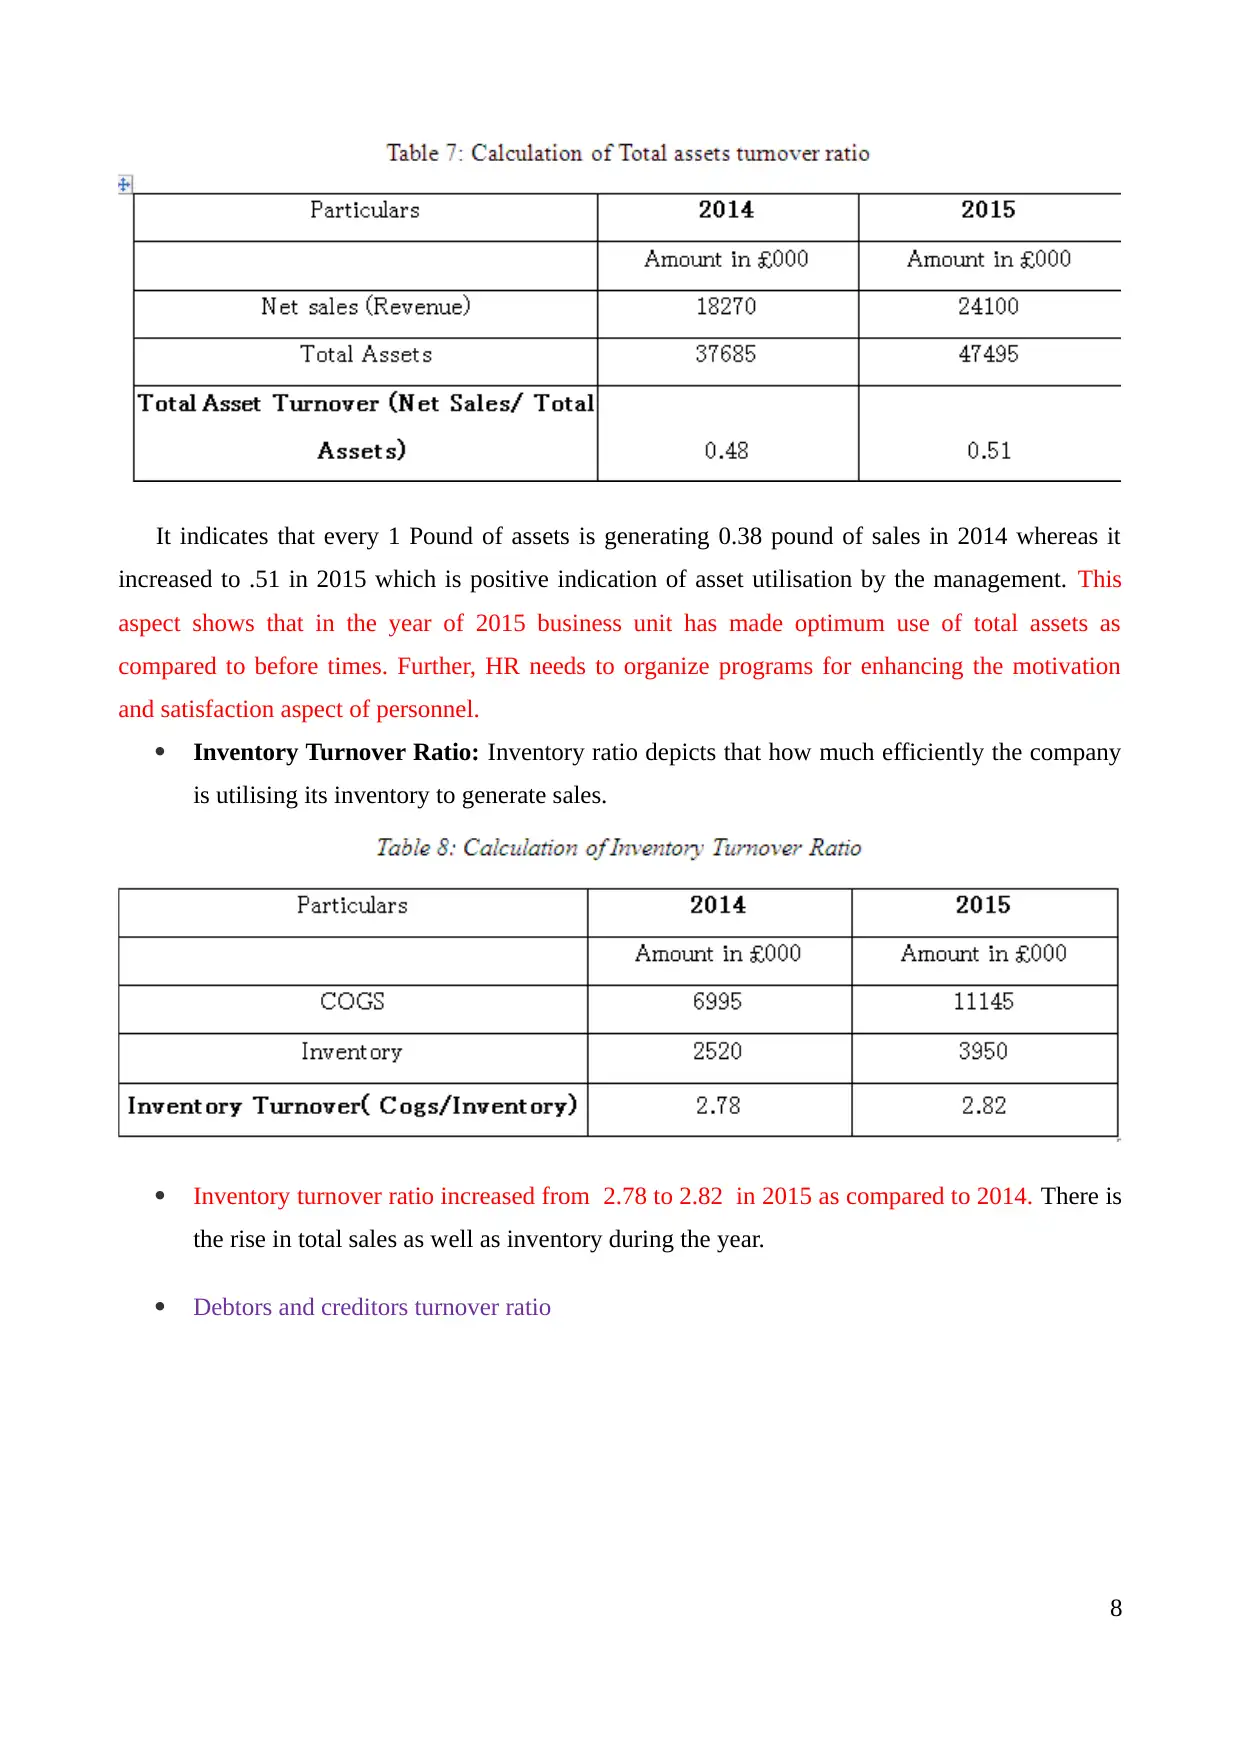
It indicates that every 1 Pound of assets is generating 0.38 pound of sales in 2014 whereas it
increased to .51 in 2015 which is positive indication of asset utilisation by the management. This
aspect shows that in the year of 2015 business unit has made optimum use of total assets as
compared to before times. Further, HR needs to organize programs for enhancing the motivation
and satisfaction aspect of personnel.
Inventory Turnover Ratio: Inventory ratio depicts that how much efficiently the company
is utilising its inventory to generate sales.
Inventory turnover ratio increased from 2.78 to 2.82 in 2015 as compared to 2014. There is
the rise in total sales as well as inventory during the year.
Debtors and creditors turnover ratio
8
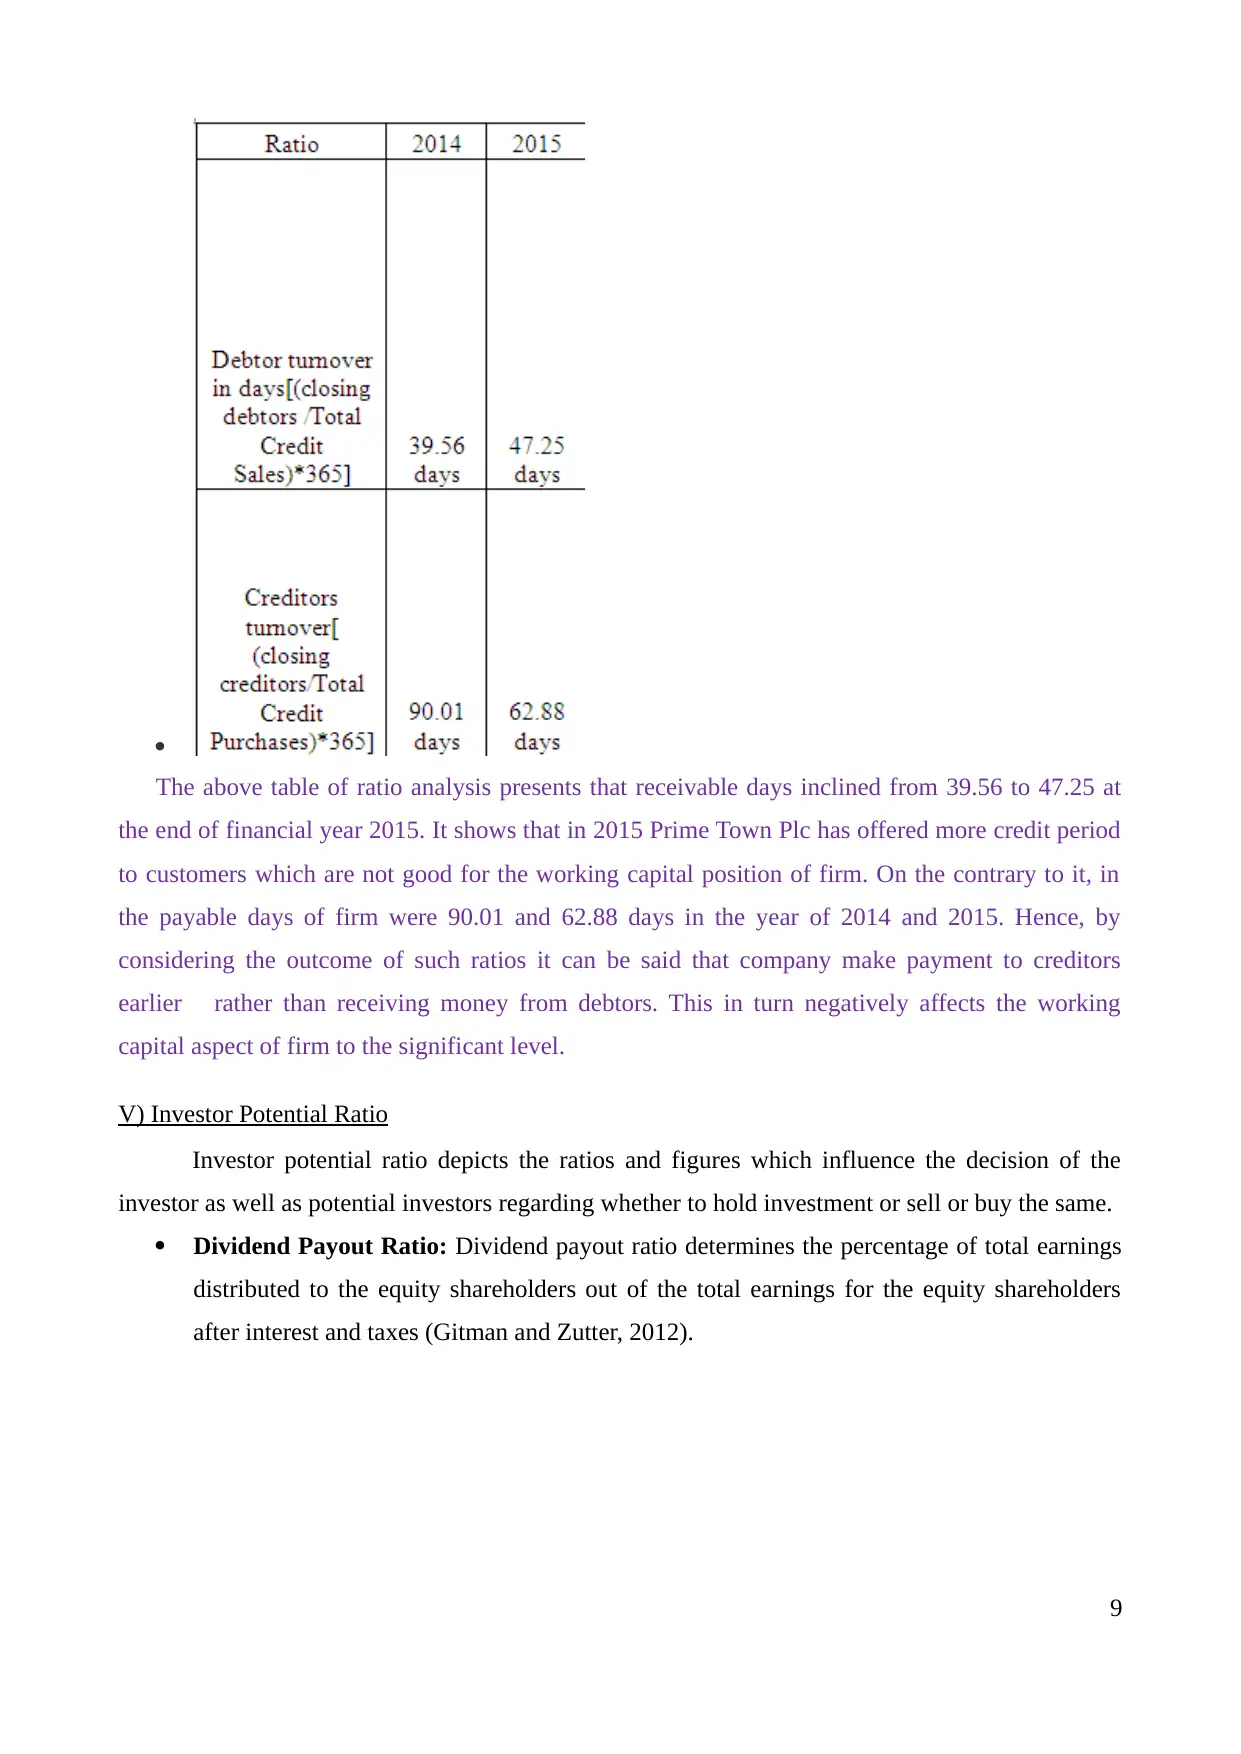
The above table of ratio analysis presents that receivable days inclined from 39.56 to 47.25 at
the end of financial year 2015. It shows that in 2015 Prime Town Plc has offered more credit period
to customers which are not good for the working capital position of firm. On the contrary to it, in
the payable days of firm were 90.01 and 62.88 days in the year of 2014 and 2015. Hence, by
considering the outcome of such ratios it can be said that company make payment to creditors
earlier rather than receiving money from debtors. This in turn negatively affects the working
capital aspect of firm to the significant level.
V) Investor Potential Ratio
Investor potential ratio depicts the ratios and figures which influence the decision of the
investor as well as potential investors regarding whether to hold investment or sell or buy the same.
Dividend Payout Ratio: Dividend payout ratio determines the percentage of total earnings
distributed to the equity shareholders out of the total earnings for the equity shareholders
after interest and taxes (Gitman and Zutter, 2012).
9
⊘ This is a preview!⊘
Do you want full access?
Subscribe today to unlock all pages.
Trusted by 1+ million students worldwide
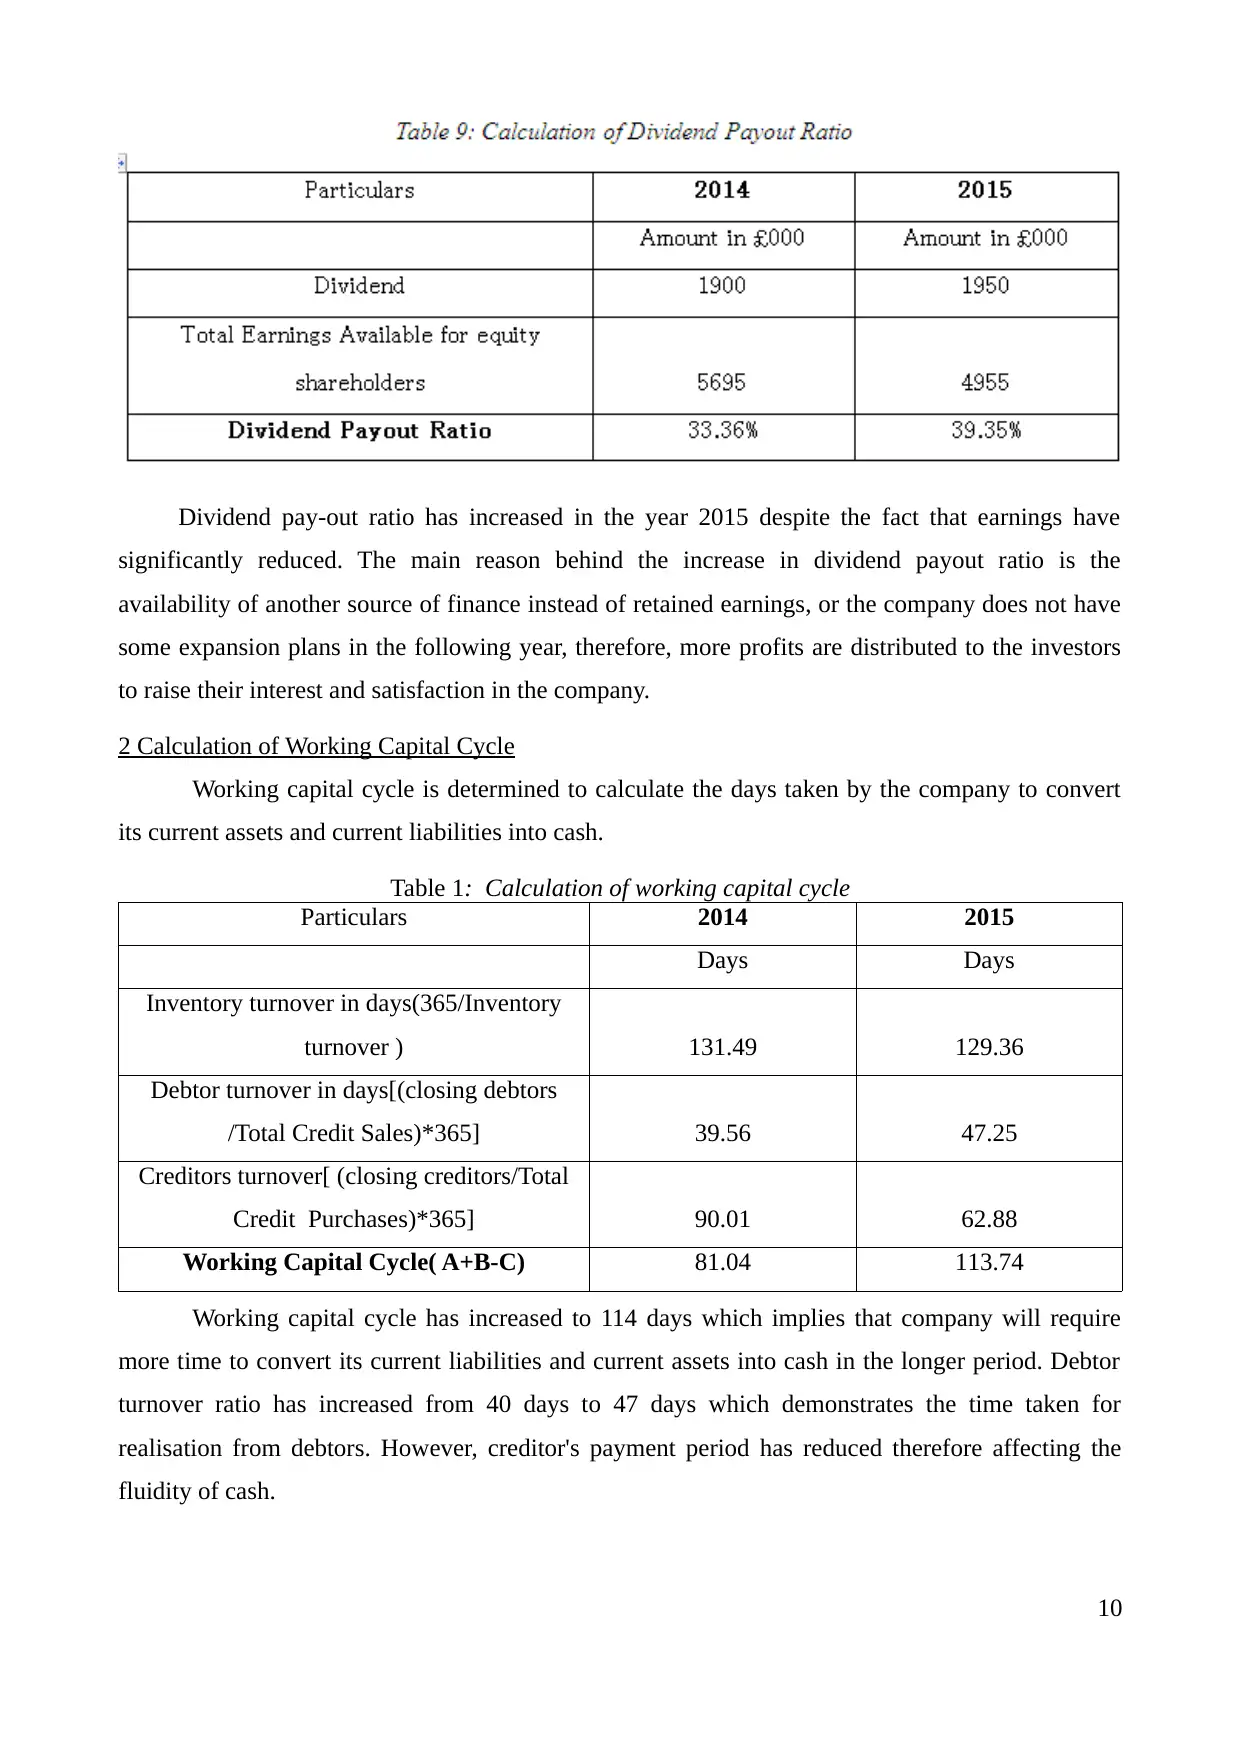
Dividend pay-out ratio has increased in the year 2015 despite the fact that earnings have
significantly reduced. The main reason behind the increase in dividend payout ratio is the
availability of another source of finance instead of retained earnings, or the company does not have
some expansion plans in the following year, therefore, more profits are distributed to the investors
to raise their interest and satisfaction in the company.
2 Calculation of Working Capital Cycle
Working capital cycle is determined to calculate the days taken by the company to convert
its current assets and current liabilities into cash.
Table 1: Calculation of working capital cycle
Particulars 2014 2015
Days Days
Inventory turnover in days(365/Inventory
turnover ) 131.49 129.36
Debtor turnover in days[(closing debtors
/Total Credit Sales)*365] 39.56 47.25
Creditors turnover[ (closing creditors/Total
Credit Purchases)*365] 90.01 62.88
Working Capital Cycle( A+B-C) 81.04 113.74
Working capital cycle has increased to 114 days which implies that company will require
more time to convert its current liabilities and current assets into cash in the longer period. Debtor
turnover ratio has increased from 40 days to 47 days which demonstrates the time taken for
realisation from debtors. However, creditor's payment period has reduced therefore affecting the
fluidity of cash.
10
Paraphrase This Document
Need a fresh take? Get an instant paraphrase of this document with our AI Paraphraser
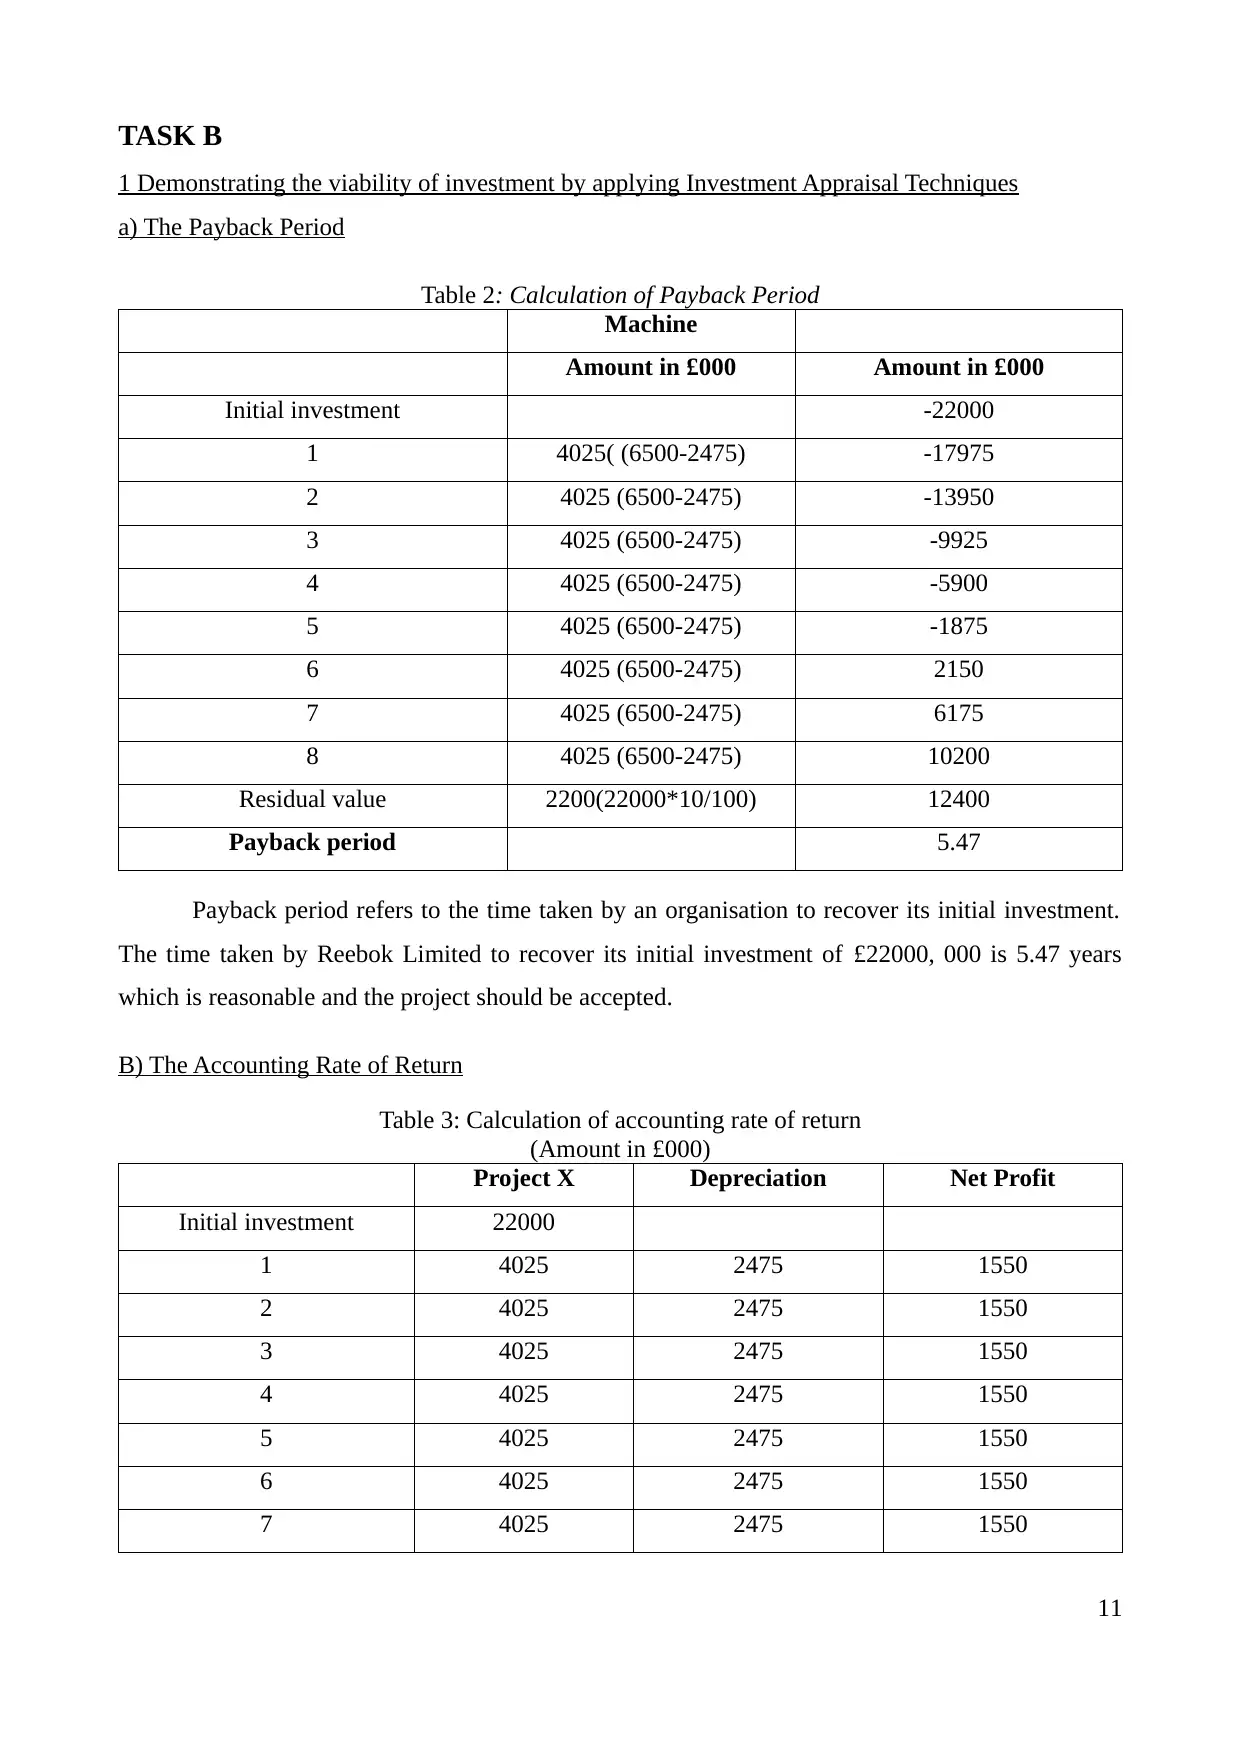
TASK B
1 Demonstrating the viability of investment by applying Investment Appraisal Techniques
a) The Payback Period
Table 2: Calculation of Payback Period
Machine
Amount in £000 Amount in £000
Initial investment -22000
1 4025( (6500-2475) -17975
2 4025 (6500-2475) -13950
3 4025 (6500-2475) -9925
4 4025 (6500-2475) -5900
5 4025 (6500-2475) -1875
6 4025 (6500-2475) 2150
7 4025 (6500-2475) 6175
8 4025 (6500-2475) 10200
Residual value 2200(22000*10/100) 12400
Payback period 5.47
Payback period refers to the time taken by an organisation to recover its initial investment.
The time taken by Reebok Limited to recover its initial investment of £22000, 000 is 5.47 years
which is reasonable and the project should be accepted.
B) The Accounting Rate of Return
Table 3: Calculation of accounting rate of return
(Amount in £000)
Project X Depreciation Net Profit
Initial investment 22000
1 4025 2475 1550
2 4025 2475 1550
3 4025 2475 1550
4 4025 2475 1550
5 4025 2475 1550
6 4025 2475 1550
7 4025 2475 1550
11
8 4025 2475 1550
Residual value 2200 12400
Total 12400 Average Profit 1550
Average 12100
ARR 55.00%
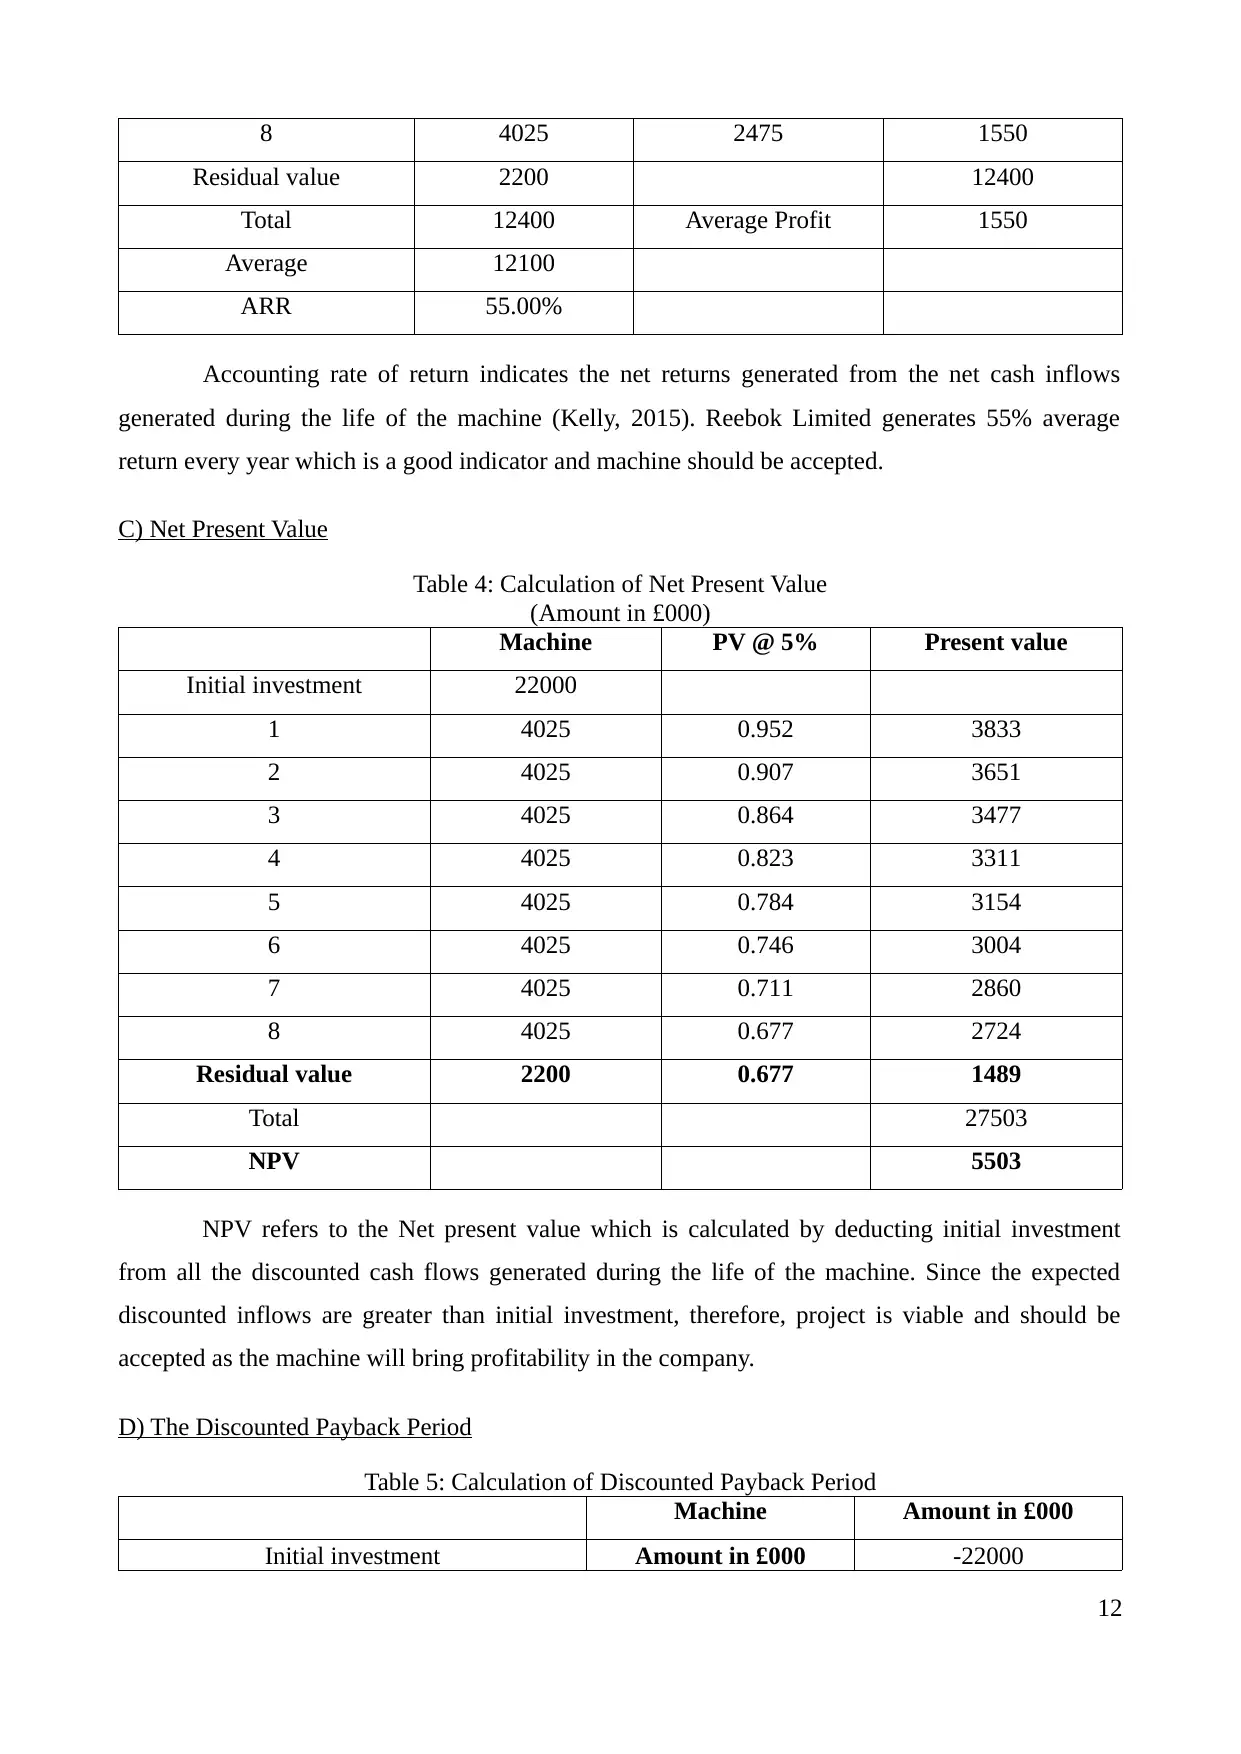
Accounting rate of return indicates the net returns generated from the net cash inflows
generated during the life of the machine (Kelly, 2015). Reebok Limited generates 55% average
return every year which is a good indicator and machine should be accepted.
C) Net Present Value
Table 4: Calculation of Net Present Value
(Amount in £000)
Machine PV @ 5% Present value
Initial investment 22000
1 4025 0.952 3833
2 4025 0.907 3651
3 4025 0.864 3477
4 4025 0.823 3311
5 4025 0.784 3154
6 4025 0.746 3004
7 4025 0.711 2860
8 4025 0.677 2724
Residual value 2200 0.677 1489
Total 27503
NPV 5503
NPV refers to the Net present value which is calculated by deducting initial investment
from all the discounted cash flows generated during the life of the machine. Since the expected
discounted inflows are greater than initial investment, therefore, project is viable and should be
accepted as the machine will bring profitability in the company.
D) The Discounted Payback Period
Table 5: Calculation of Discounted Payback Period
Machine Amount in £000
Initial investment Amount in £000 -22000
12
Residual value 2200 12400
Total 12400 Average Profit 1550
Average 12100
ARR 55.00%
Accounting rate of return indicates the net returns generated from the net cash inflows
generated during the life of the machine (Kelly, 2015). Reebok Limited generates 55% average
return every year which is a good indicator and machine should be accepted.
C) Net Present Value
Table 4: Calculation of Net Present Value
(Amount in £000)
Machine PV @ 5% Present value
Initial investment 22000
1 4025 0.952 3833
2 4025 0.907 3651
3 4025 0.864 3477
4 4025 0.823 3311
5 4025 0.784 3154
6 4025 0.746 3004
7 4025 0.711 2860
8 4025 0.677 2724
Residual value 2200 0.677 1489
Total 27503
NPV 5503
NPV refers to the Net present value which is calculated by deducting initial investment
from all the discounted cash flows generated during the life of the machine. Since the expected
discounted inflows are greater than initial investment, therefore, project is viable and should be
accepted as the machine will bring profitability in the company.
D) The Discounted Payback Period
Table 5: Calculation of Discounted Payback Period
Machine Amount in £000
Initial investment Amount in £000 -22000
12
⊘ This is a preview!⊘
Do you want full access?
Subscribe today to unlock all pages.
Trusted by 1+ million students worldwide
1 out of 23
Related Documents


Your All-in-One AI-Powered Toolkit for Academic Success.
+13062052269
info@desklib.com
Available 24*7 on WhatsApp / Email
![[object Object]](/_next/static/media/star-bottom.7253800d.svg)
Unlock your academic potential
Copyright © 2020–2026 A2Z Services. All Rights Reserved. Developed and managed by ZUCOL.