Detailed Financial Ratio Analysis Report: Next plc and H&M Performance
VerifiedAdded on 2019/12/04
|32
|6332
|207
Report
AI Summary
This report presents a detailed financial analysis of Next plc and H&M, utilizing ratio analysis to evaluate their performance over a five-year period. The analysis covers key financial ratios such as current ratio, asset turnover, inventory turnover, gross profit margin, operating margin, and free cash flow per share. The report compares the two companies across these metrics, highlighting their strengths and weaknesses in terms of liquidity, efficiency, and profitability. Furthermore, the report discusses project evaluation techniques and their limitations. The findings reveal insights into the cost control strategies, asset utilization, and overall financial health of both companies, providing recommendations for performance improvement. The report concludes with a summary of the firms' performance, staff turnover ratios, and estimated working days lost, offering a comprehensive overview of their financial standings.

ACCOUNTING
Paraphrase This Document
Need a fresh take? Get an instant paraphrase of this document with our AI Paraphraser
TABLE OF CONTENTS
INTRODUCTION...........................................................................................................................3
Question 1........................................................................................................................................3
1Ratio analysis............................................................................................................................3
(2) Explanation on company performance in last five years.......................................................5
2(3) Recommendations for improving company performance...................................................7
Question 2........................................................................................................................................7
1(1) Project evaluation techniques for project evaluation...........................................................7
2Limitations of investment appraisal technique.........................................................................8
CONCLUSION................................................................................................................................9
REFRENCES...................................................................................................................................9
INDEX OF TABLES
Table 1: Calculation of current ratio................................................................................................4
Table 2: Calculation of asset turnover ratio.....................................................................................5
Table 3: Calculation of inventory turnover ratio.............................................................................5
Table 4: Calculation of days of inventory........................................................................................6
Table 5: Calculation of receivable turnover ratio............................................................................6
Table 6: Calculation of gross profit margin.....................................................................................6
Table 7: Calculation of operating profit margin..............................................................................7
Table 8: Calculation of free cash flow per share.............................................................................7
Table 9: Calculation of COGS as percentage of revenue................................................................8
Table 10: Calculation of revenue as a proportion of employee.......................................................8
Table 11: Summary of firms performance.......................................................................................9
Table 12: Staff turnover ratio of Next plc........................................................................................9
Table 13: Staff turnover ratio of H&M............................................................................................9
Table 14: Estimated working days lost of Next plc.......................................................................10
Table 15: Estimated working days lost of H&M...........................................................................10
Table 16: Poor performance of Next plc on COGS.......................................................................14
Table 17: Poor performance of Next plc on Assets utilization......................................................14
Table 18: Poor performance of Next plc on liquidity....................................................................14
Table 19: Calculation of payback period.......................................................................................15
Table 20: Calculation of ARR.......................................................................................................16
Table 21: Calculation of NPV........................................................................................................16
⊘ This is a preview!⊘
Do you want full access?
Subscribe today to unlock all pages.
Trusted by 1+ million students worldwide

ILLUSTRATION INDEX
Illustration 1: Companies comparison of COGS/ revenue ratio....................................................11
Illustration 2: Comparison of firms on the basis of gross margin ratio........................................11
Illustration 3: Staff turnover ratio..................................................................................................12
Illustration 4: Estimated working days lost...................................................................................12
Paraphrase This Document
Need a fresh take? Get an instant paraphrase of this document with our AI Paraphraser
INTRODUCTION
Accounting is a discipline that helps business firms in evaluating their business
performance. In the present report, ratio analysis of Next plc and H&M is done and comments
are made on their performance of five years. Along with this, recommendations are also made in
the report regarding improvements in company’s performance. Further, in the second section of
report, project evaluation techniques are applied on the firm’s cash flows and the best project is
selected for the further expansion. At the end of report, limitations of these techniques are also
discussed in detail.
QUESTION 1
1. Ratio analysis
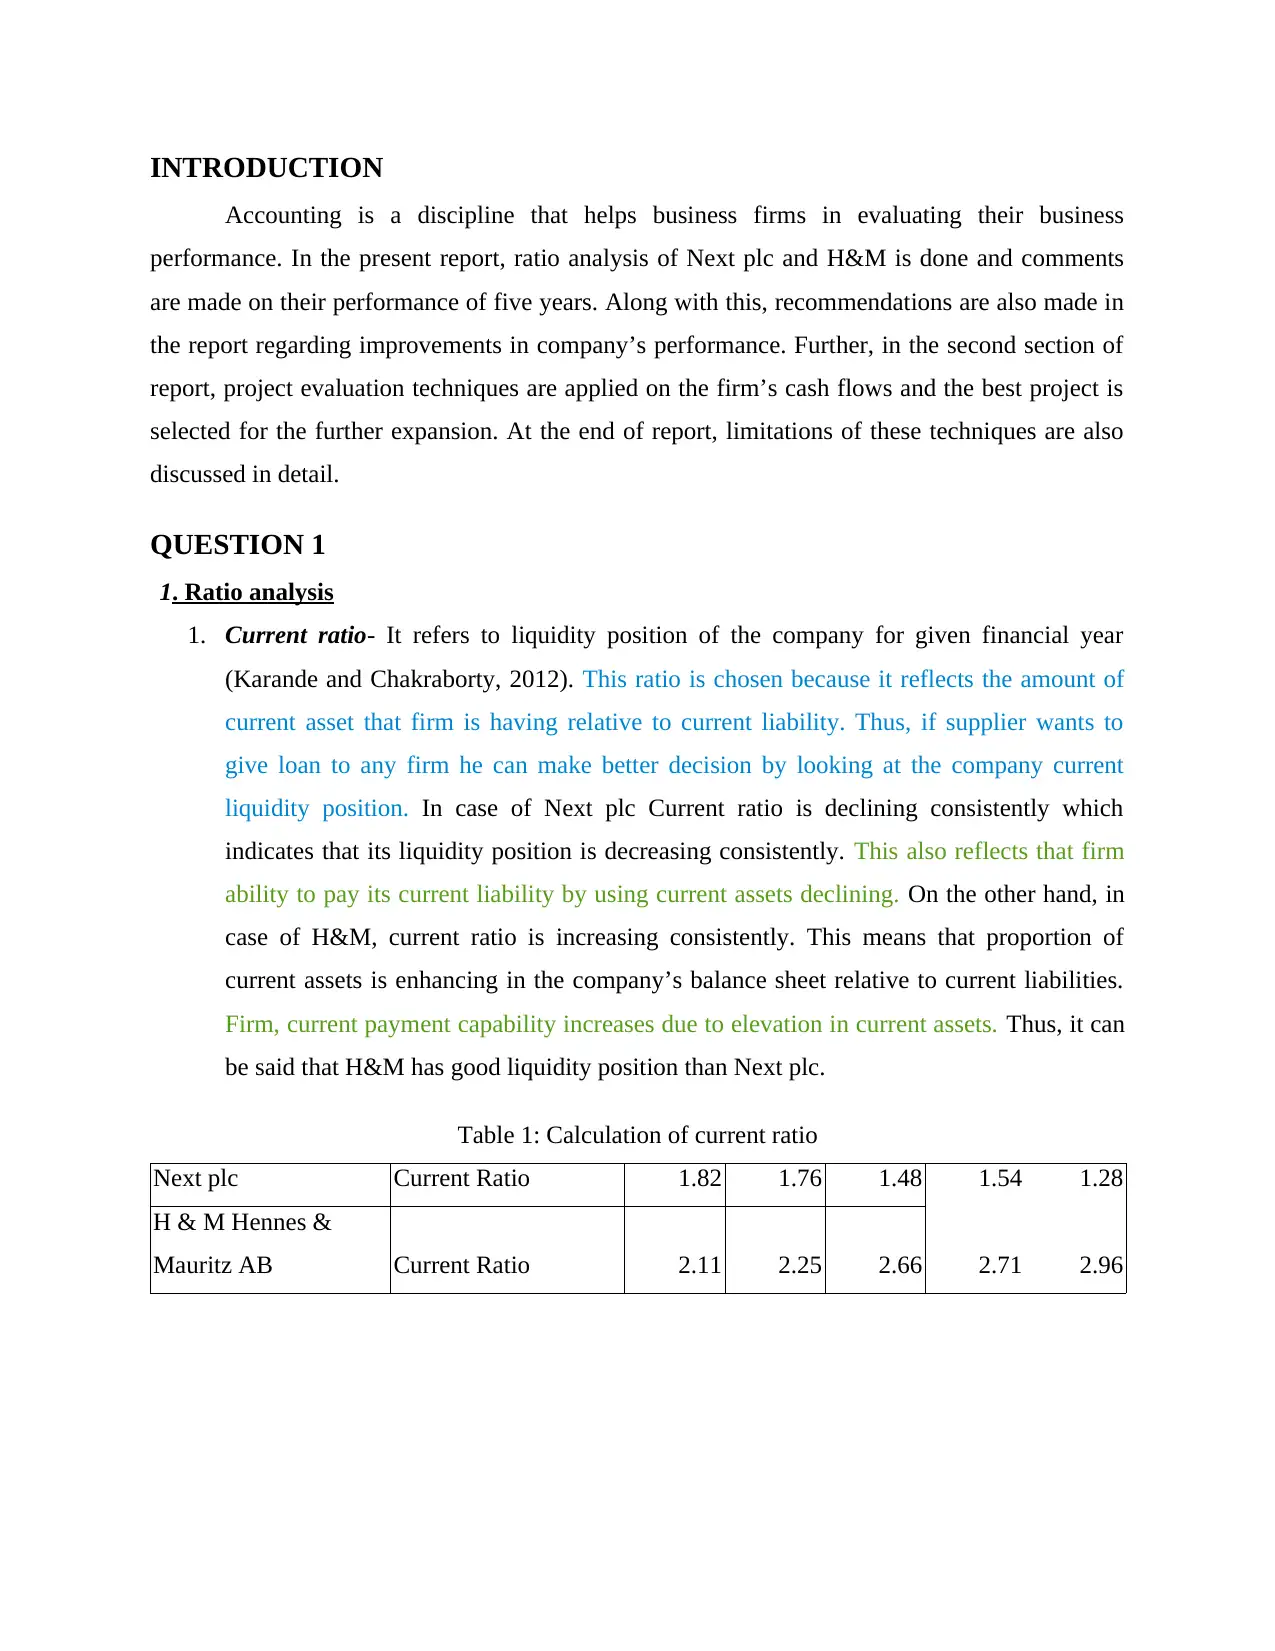
1. Current ratio- It refers to liquidity position of the company for given financial year
(Karande and Chakraborty, 2012). This ratio is chosen because it reflects the amount of
current asset that firm is having relative to current liability. Thus, if supplier wants to
give loan to any firm he can make better decision by looking at the company current
liquidity position. In case of Next plc Current ratio is declining consistently which
indicates that its liquidity position is decreasing consistently. This also reflects that firm
ability to pay its current liability by using current assets declining. On the other hand, in
case of H&M, current ratio is increasing consistently. This means that proportion of
current assets is enhancing in the company’s balance sheet relative to current liabilities.
Firm, current payment capability increases due to elevation in current assets. Thus, it can
be said that H&M has good liquidity position than Next plc.
Table 1: Calculation of current ratio
Next plc Current Ratio 1.82 1.76 1.48 1.54 1.28
H & M Hennes &
Mauritz AB Current Ratio 2.11 2.25 2.66 2.71 2.96
Accounting is a discipline that helps business firms in evaluating their business
performance. In the present report, ratio analysis of Next plc and H&M is done and comments
are made on their performance of five years. Along with this, recommendations are also made in
the report regarding improvements in company’s performance. Further, in the second section of
report, project evaluation techniques are applied on the firm’s cash flows and the best project is
selected for the further expansion. At the end of report, limitations of these techniques are also
discussed in detail.
QUESTION 1
1. Ratio analysis
1. Current ratio- It refers to liquidity position of the company for given financial year
(Karande and Chakraborty, 2012). This ratio is chosen because it reflects the amount of
current asset that firm is having relative to current liability. Thus, if supplier wants to
give loan to any firm he can make better decision by looking at the company current
liquidity position. In case of Next plc Current ratio is declining consistently which
indicates that its liquidity position is decreasing consistently. This also reflects that firm
ability to pay its current liability by using current assets declining. On the other hand, in
case of H&M, current ratio is increasing consistently. This means that proportion of
current assets is enhancing in the company’s balance sheet relative to current liabilities.
Firm, current payment capability increases due to elevation in current assets. Thus, it can
be said that H&M has good liquidity position than Next plc.
Table 1: Calculation of current ratio
Next plc Current Ratio 1.82 1.76 1.48 1.54 1.28
H & M Hennes &
Mauritz AB Current Ratio 2.11 2.25 2.66 2.71 2.96
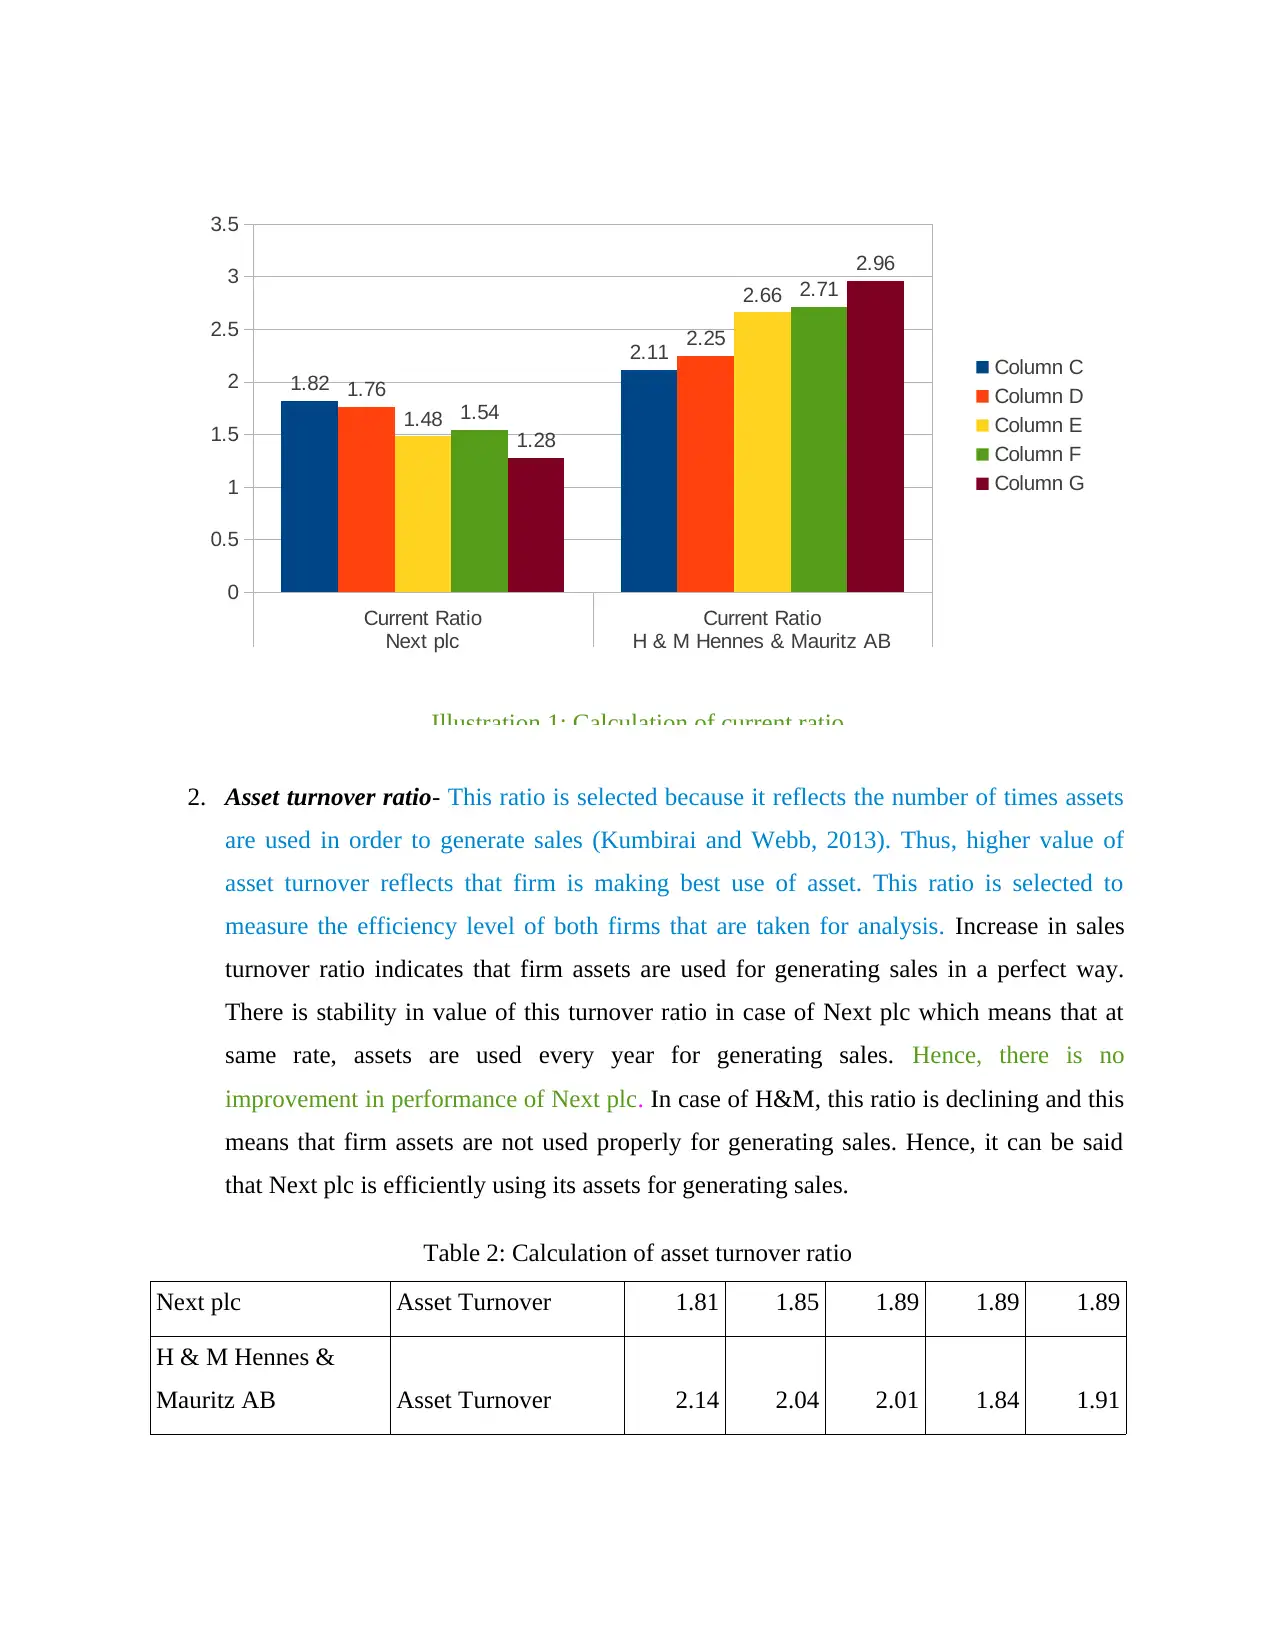
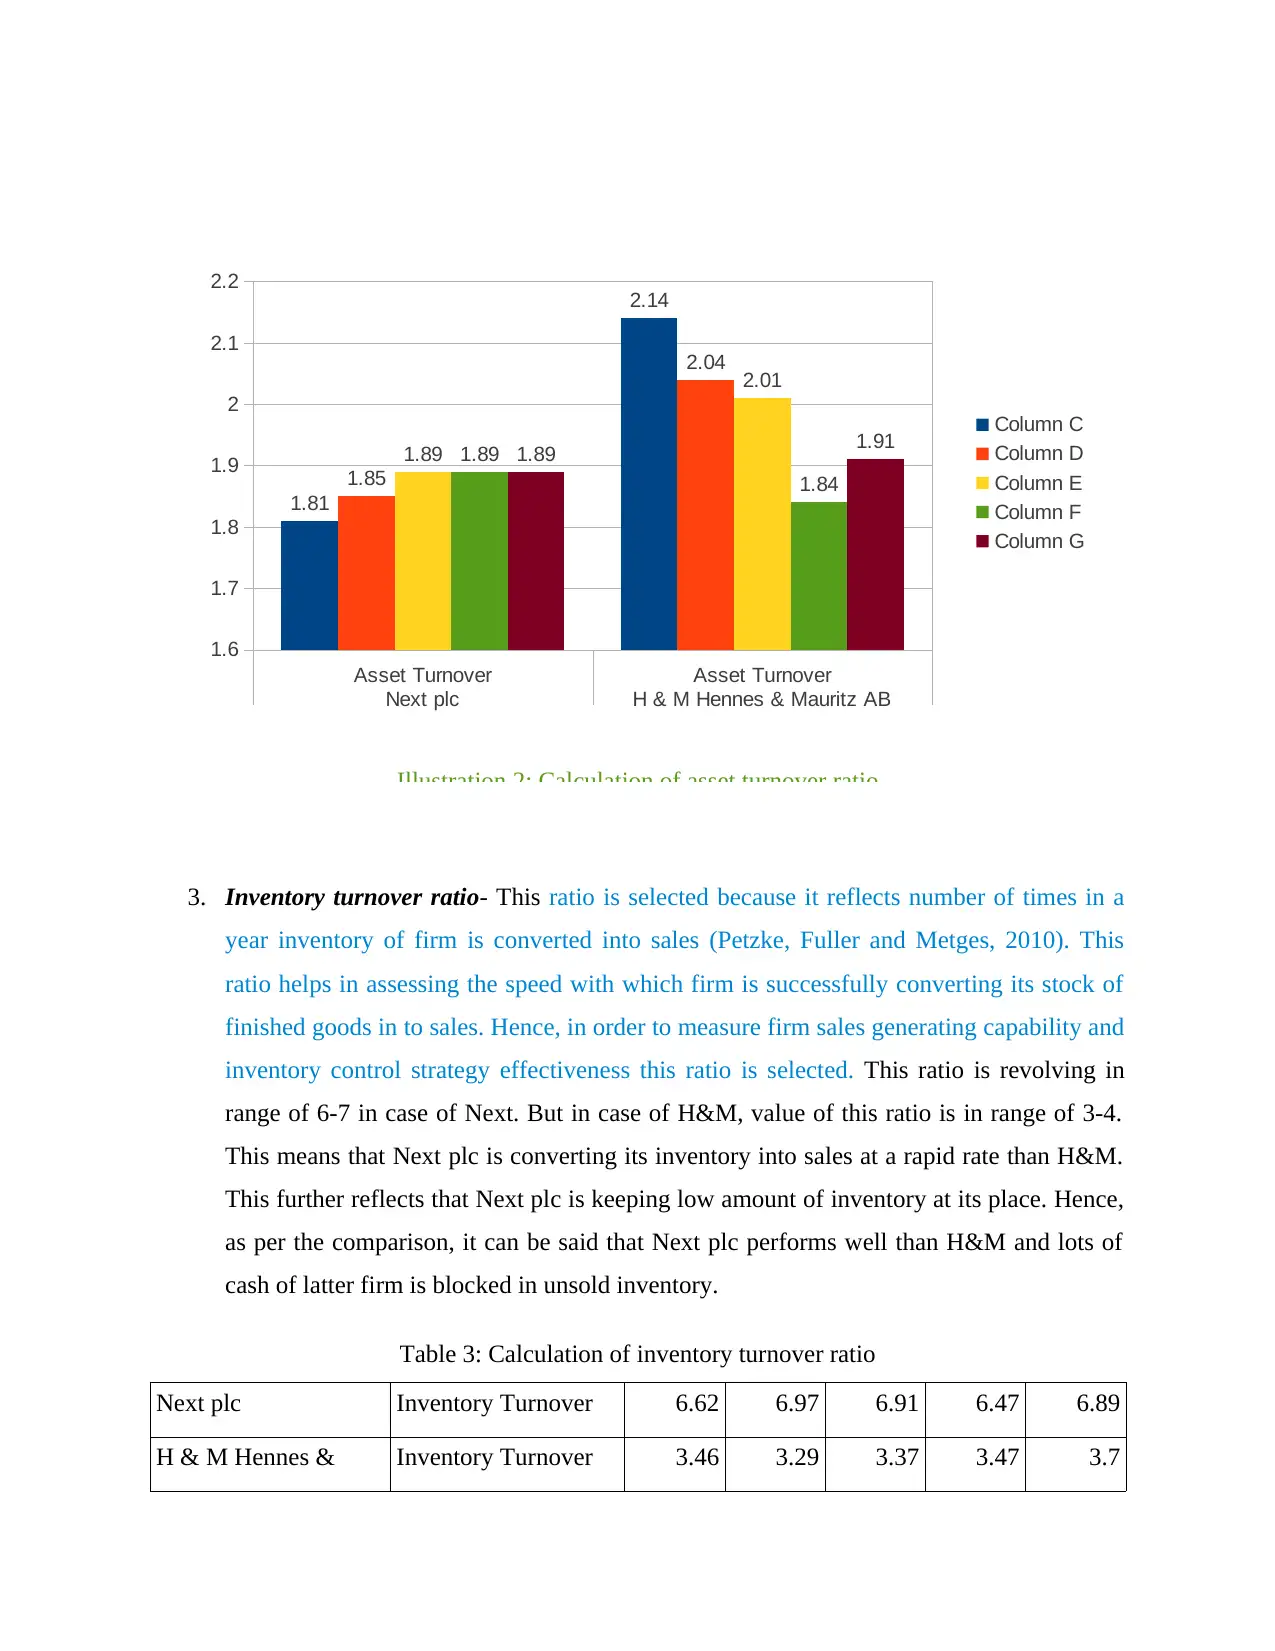
2. Asset turnover ratio- This ratio is selected because it reflects the number of times assets
are used in order to generate sales (Kumbirai and Webb, 2013). Thus, higher value of
asset turnover reflects that firm is making best use of asset. This ratio is selected to
measure the efficiency level of both firms that are taken for analysis. Increase in sales
turnover ratio indicates that firm assets are used for generating sales in a perfect way.
There is stability in value of this turnover ratio in case of Next plc which means that at
same rate, assets are used every year for generating sales. Hence, there is no
improvement in performance of Next plc. In case of H&M, this ratio is declining and this
means that firm assets are not used properly for generating sales. Hence, it can be said
that Next plc is efficiently using its assets for generating sales.
Table 2: Calculation of asset turnover ratio
Next plc Asset Turnover 1.81 1.85 1.89 1.89 1.89
H & M Hennes &
Mauritz AB Asset Turnover 2.14 2.04 2.01 1.84 1.91
Current Ratio Current Ratio
Next plc H & M Hennes & Mauritz AB
0
0.5
1
1.5
2
2.5
3
3.5
1.82
2.11
1.76
2.25
1.48
2.66
1.54
2.71
1.28
2.96
Column C
Column D
Column E
Column F
Column G
Illustration 1: Calculation of current ratio
⊘ This is a preview!⊘
Do you want full access?
Subscribe today to unlock all pages.
Trusted by 1+ million students worldwide
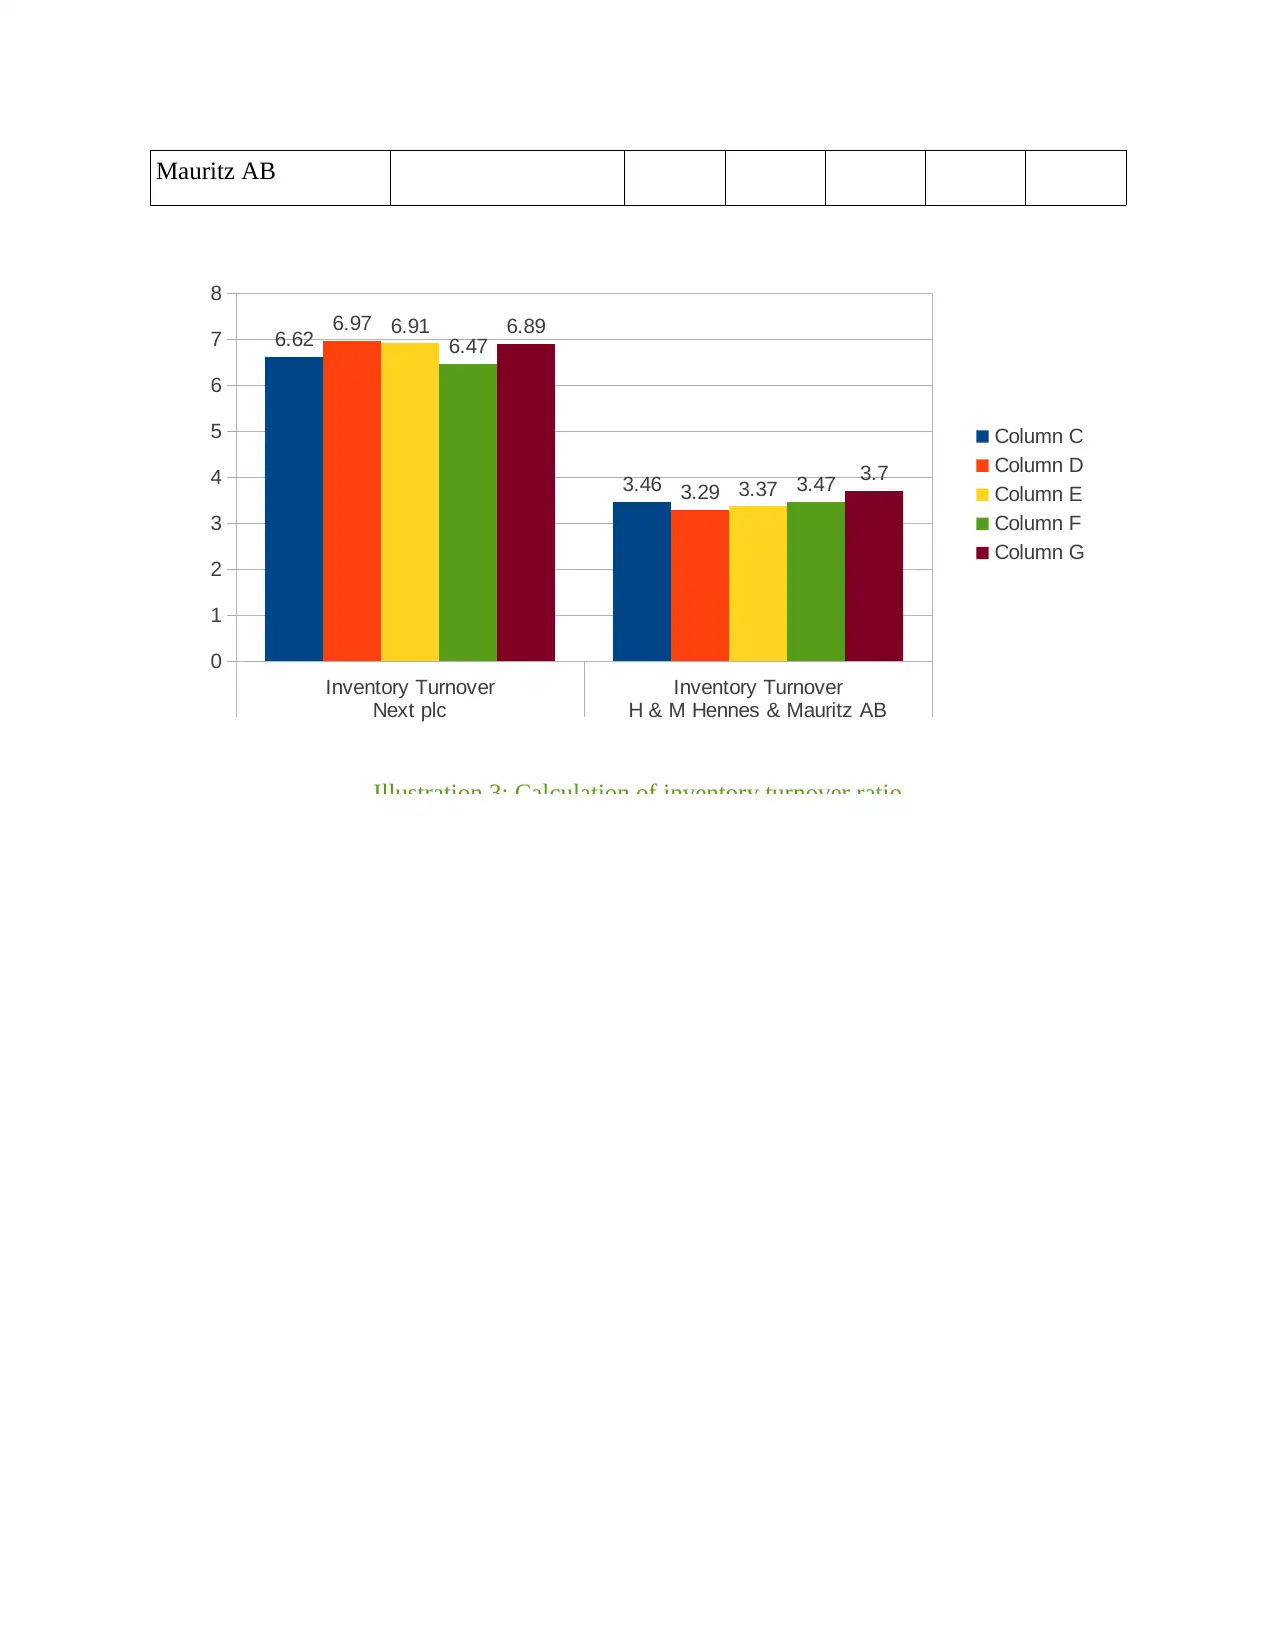
3. Inventory turnover ratio- This ratio is selected because it reflects number of times in a
year inventory of firm is converted into sales (Petzke, Fuller and Metges, 2010). This
ratio helps in assessing the speed with which firm is successfully converting its stock of
finished goods in to sales. Hence, in order to measure firm sales generating capability and
inventory control strategy effectiveness this ratio is selected. This ratio is revolving in
range of 6-7 in case of Next. But in case of H&M, value of this ratio is in range of 3-4.
This means that Next plc is converting its inventory into sales at a rapid rate than H&M.
This further reflects that Next plc is keeping low amount of inventory at its place. Hence,
as per the comparison, it can be said that Next plc performs well than H&M and lots of
cash of latter firm is blocked in unsold inventory.
Table 3: Calculation of inventory turnover ratio
Next plc Inventory Turnover 6.62 6.97 6.91 6.47 6.89
H & M Hennes & Inventory Turnover 3.46 3.29 3.37 3.47 3.7
Asset Turnover Asset Turnover
Next plc H & M Hennes & Mauritz AB
1.6
1.7
1.8
1.9
2
2.1
2.2
1.81
2.14
1.85
2.04
1.89
2.01
1.89
1.84
1.89 1.91 Column C
Column D
Column E
Column F
Column G
Illustration 2: Calculation of asset turnover ratio
Paraphrase This Document
Need a fresh take? Get an instant paraphrase of this document with our AI Paraphraser
Mauritz AB
Inventory Turnover Inventory Turnover
Next plc H & M Hennes & Mauritz AB
0
1
2
3
4
5
6
7
8
6.62
3.46
6.97
3.29
6.91
3.37
6.47
3.47
6.89
3.7
Column C
Column D
Column E
Column F
Column G
Illustration 3: Calculation of inventory turnover ratio
Inventory Turnover Inventory Turnover
Next plc H & M Hennes & Mauritz AB
0
1
2
3
4
5
6
7
8
6.62
3.46
6.97
3.29
6.91
3.37
6.47
3.47
6.89
3.7
Column C
Column D
Column E
Column F
Column G
Illustration 3: Calculation of inventory turnover ratio
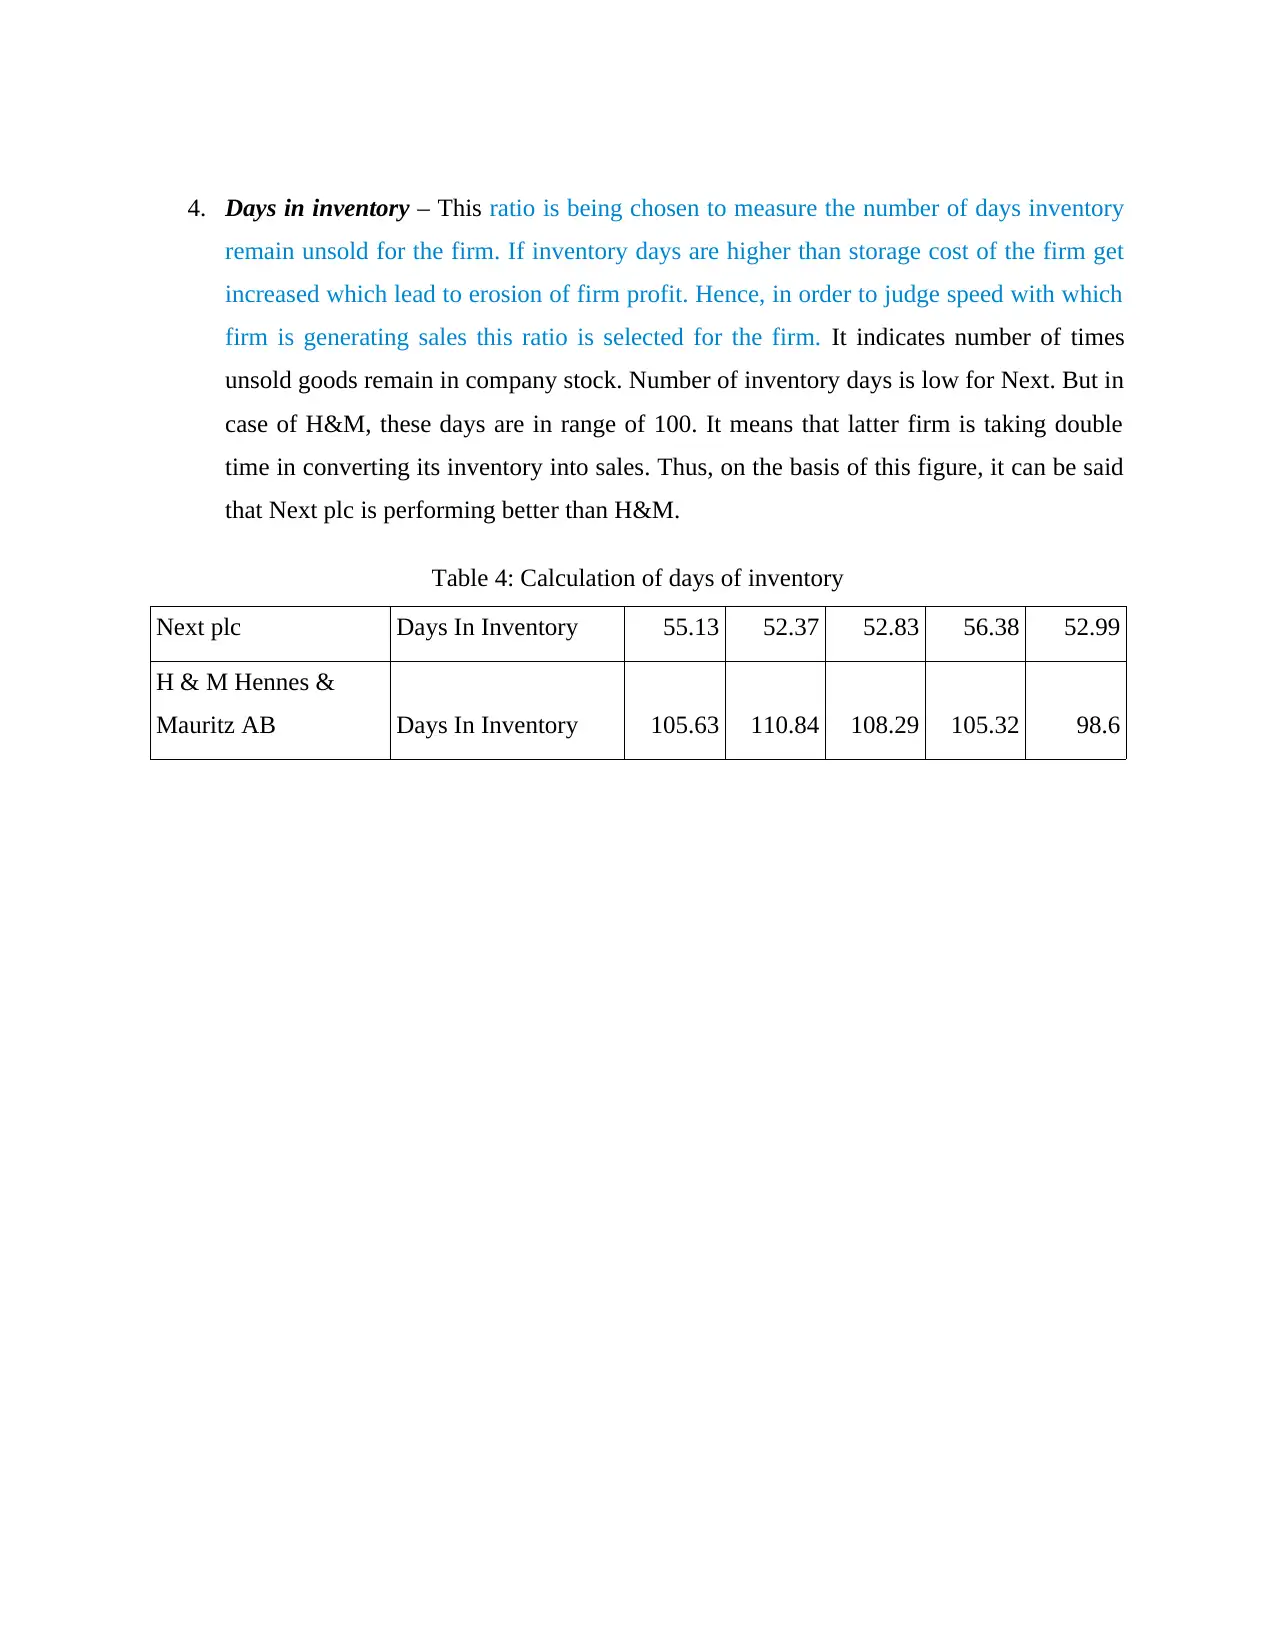
4. Days in inventory – This ratio is being chosen to measure the number of days inventory
remain unsold for the firm. If inventory days are higher than storage cost of the firm get
increased which lead to erosion of firm profit. Hence, in order to judge speed with which
firm is generating sales this ratio is selected for the firm. It indicates number of times
unsold goods remain in company stock. Number of inventory days is low for Next. But in
case of H&M, these days are in range of 100. It means that latter firm is taking double
time in converting its inventory into sales. Thus, on the basis of this figure, it can be said
that Next plc is performing better than H&M.
Table 4: Calculation of days of inventory
Next plc Days In Inventory 55.13 52.37 52.83 56.38 52.99
H & M Hennes &
Mauritz AB Days In Inventory 105.63 110.84 108.29 105.32 98.6
⊘ This is a preview!⊘
Do you want full access?
Subscribe today to unlock all pages.
Trusted by 1+ million students worldwide
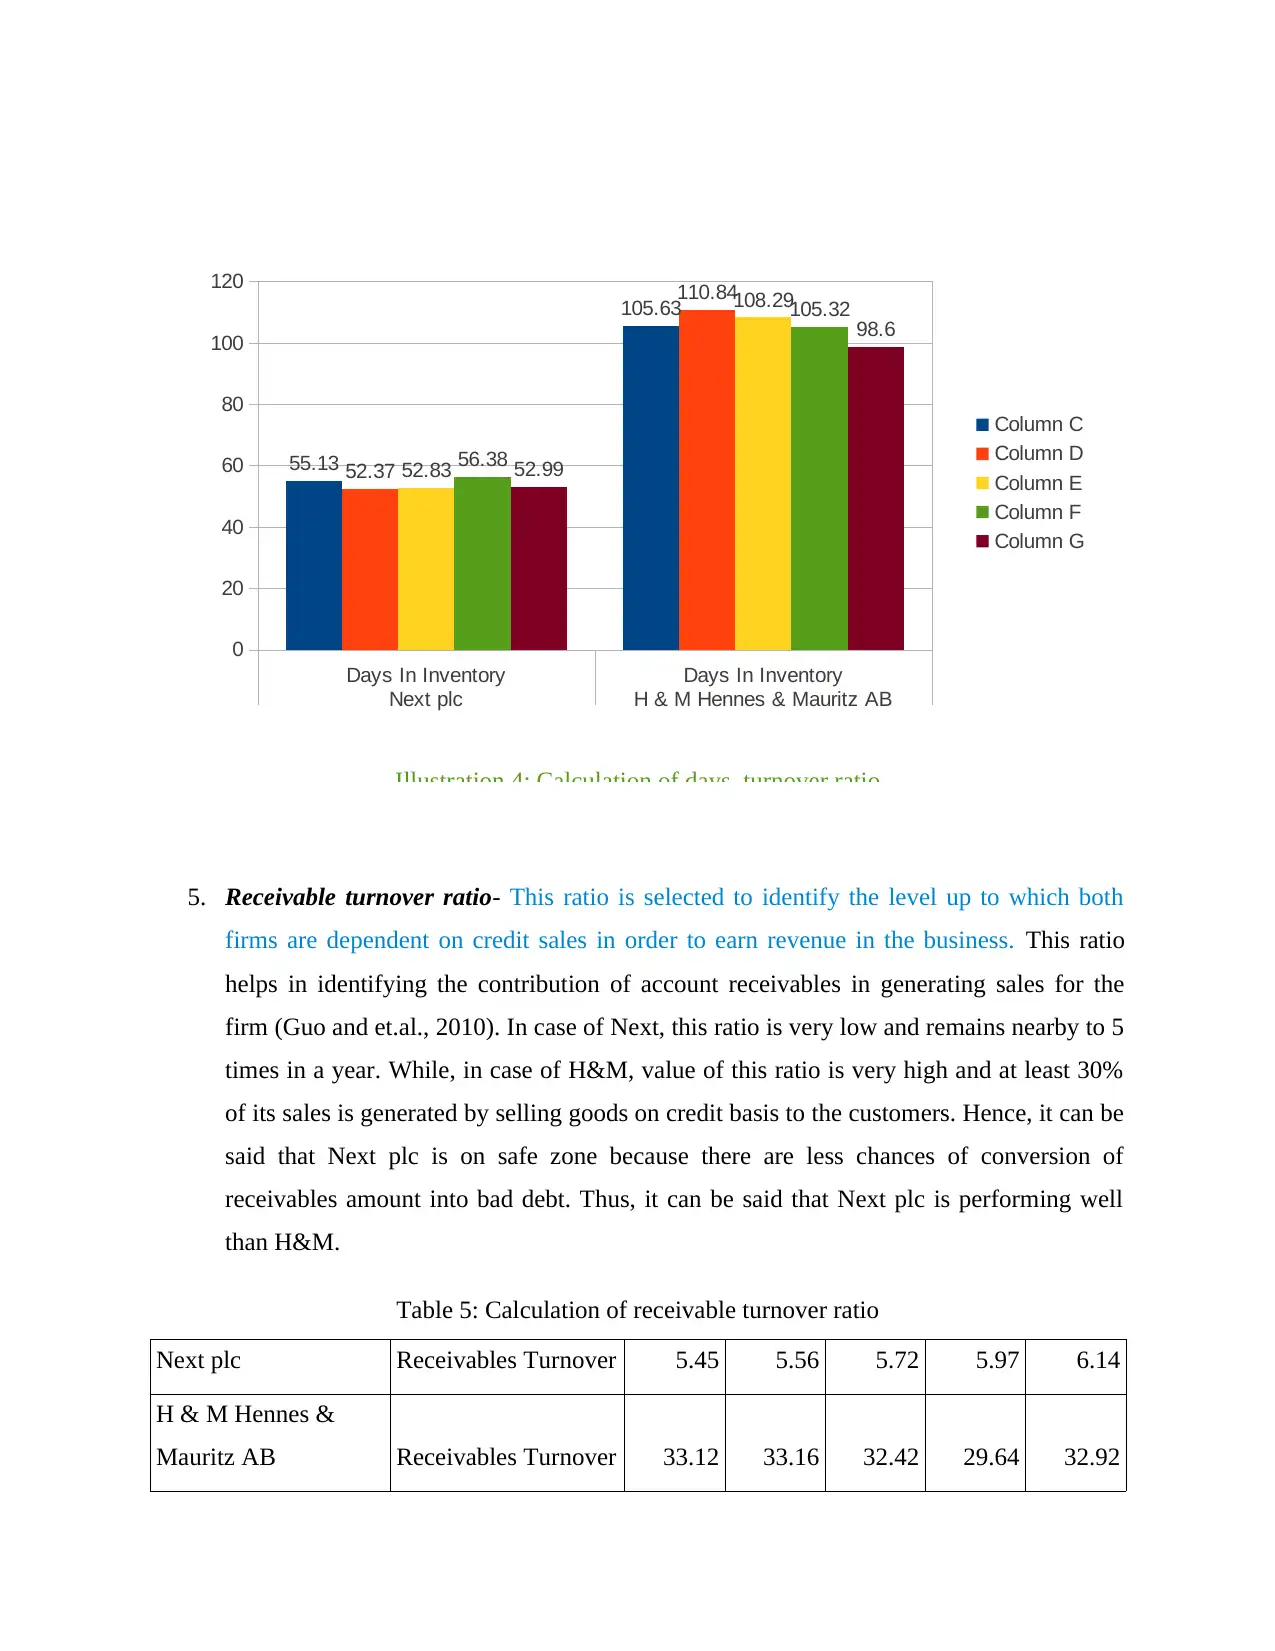
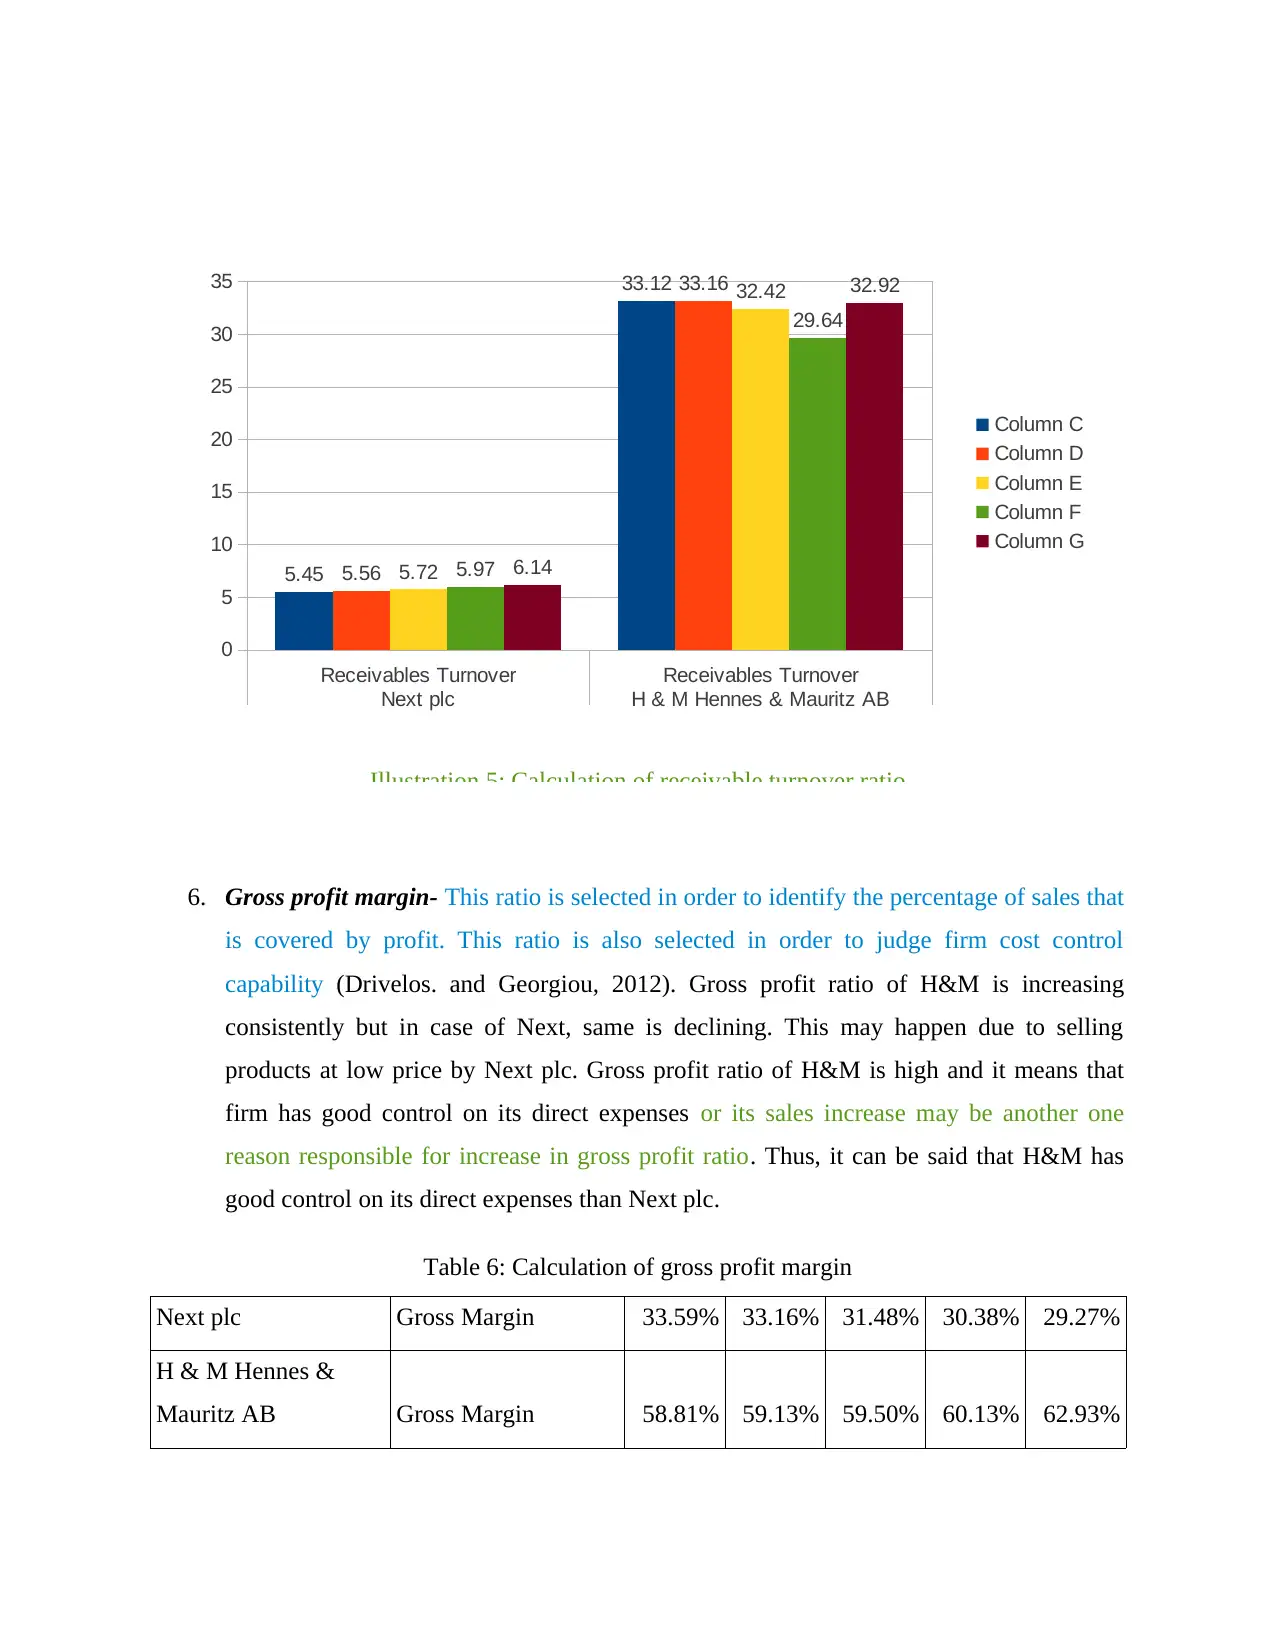
5. Receivable turnover ratio- This ratio is selected to identify the level up to which both
firms are dependent on credit sales in order to earn revenue in the business. This ratio
helps in identifying the contribution of account receivables in generating sales for the
firm (Guo and et.al., 2010). In case of Next, this ratio is very low and remains nearby to 5
times in a year. While, in case of H&M, value of this ratio is very high and at least 30%
of its sales is generated by selling goods on credit basis to the customers. Hence, it can be
said that Next plc is on safe zone because there are less chances of conversion of
receivables amount into bad debt. Thus, it can be said that Next plc is performing well
than H&M.
Table 5: Calculation of receivable turnover ratio
Next plc Receivables Turnover 5.45 5.56 5.72 5.97 6.14
H & M Hennes &
Mauritz AB Receivables Turnover 33.12 33.16 32.42 29.64 32.92
Days In Inventory Days In Inventory
Next plc H & M Hennes & Mauritz AB
0
20
40
60
80
100
120
55.13
105.63
52.37
110.84
52.83
108.29
56.38
105.32
52.99
98.6
Column C
Column D
Column E
Column F
Column G
Illustration 4: Calculation of days turnover ratio
Paraphrase This Document
Need a fresh take? Get an instant paraphrase of this document with our AI Paraphraser

6. Gross profit margin- This ratio is selected in order to identify the percentage of sales that
is covered by profit. This ratio is also selected in order to judge firm cost control
capability (Drivelos. and Georgiou, 2012). Gross profit ratio of H&M is increasing
consistently but in case of Next, same is declining. This may happen due to selling
products at low price by Next plc. Gross profit ratio of H&M is high and it means that
firm has good control on its direct expenses or its sales increase may be another one
reason responsible for increase in gross profit ratio. Thus, it can be said that H&M has
good control on its direct expenses than Next plc.
Table 6: Calculation of gross profit margin
Next plc Gross Margin 33.59% 33.16% 31.48% 30.38% 29.27%
H & M Hennes &
Mauritz AB Gross Margin 58.81% 59.13% 59.50% 60.13% 62.93%
Receivables Turnover Receivables Turnover
Next plc H & M Hennes & Mauritz AB
0
5
10
15
20
25
30
35
5.45
33.12
5.56
33.16
5.72
32.42
5.97
29.64
6.14
32.92
Column C
Column D
Column E
Column F
Column G
Illustration 5: Calculation of receivable turnover ratio
⊘ This is a preview!⊘
Do you want full access?
Subscribe today to unlock all pages.
Trusted by 1+ million students worldwide
1 out of 32
Related Documents


Your All-in-One AI-Powered Toolkit for Academic Success.
+13062052269
info@desklib.com
Available 24*7 on WhatsApp / Email
![[object Object]](/_next/static/media/star-bottom.7253800d.svg)
Unlock your academic potential
Copyright © 2020–2026 A2Z Services. All Rights Reserved. Developed and managed by ZUCOL.