Financial Ratio Analysis: Burberry Group Plc vs. Tiffany & Co Report
VerifiedAdded on 2020/05/11
|43
|8665
|433
Report
AI Summary
This report provides a detailed financial analysis comparing Burberry Group Plc and Tiffany & Co, focusing on their performance in 2015 and 2016. It begins with introductions to both companies, outlining their core businesses and market positions. The core of the report lies in the analysis of key financial ratios, including operating profit margin, return on capital employed, gearing ratio, interest coverage ratio, return on assets, and price-to-equity ratio. The report calculates and compares these ratios for both companies across the specified years, providing insights into their profitability, efficiency, and financial health. Interpretations of these ratios are provided, considering macroeconomic and business factors that may have influenced the results, such as economic conditions, consumer confidence, and market strategies. The report also includes an analysis of the sources of funding for Burberry Plc. The report concludes with a discussion of the relevance of management accounting within the context of these companies. Financial statements and ratio calculations are included in the appendix to support the analysis.
Running head: FINANCE AND ACCOUNTING
Finance and Accounting
University Name
Student Name
Authors’ Note
Finance and Accounting
University Name
Student Name
Authors’ Note
Paraphrase This Document
Need a fresh take? Get an instant paraphrase of this document with our AI Paraphraser
2FINANCE AND ACCOUNTING
Table of Contents
Finance and Accounting.............................................................................................................1
Solution to Task 1:.....................................................................................................................4
Introduction of Competitor Company: Tiffany & Co................................................................5
Analysis of key financial ratio of two firms during the period 2015 and 2016.........................6
Interpretations taking into account macro business and macroeconomic factors....................16
Solution to Task 2:...................................................................................................................21
Analysis of the sources of funding...........................................................................................21
Analysis of current state of financing in the selected company Burberry Plc.........................23
Solution to Task 3:...................................................................................................................29
Analytical and generic discussion of the relevance of management accounting.....................29
References................................................................................................................................34
Appendix:.................................................................................................................................38
Financial Statements of the selected firm Burberry Plc...........................................................38
Financial Statements of the competitor firm Tiffany & Co.....................................................41
Ratio Calculations....................................................................................................................44
I. Operating Profit Margin Ratio..........................................................................................44
II. Return on Capital Employed Ratio...............................................................................44
III. Gearing Ratio................................................................................................................44
IV. Interest Coverage Ratio.................................................................................................44
V. Return on Assets Ratio..................................................................................................45
VI. Price to Equity Ratio.....................................................................................................45
3FINANCE AND ACCOUNTING
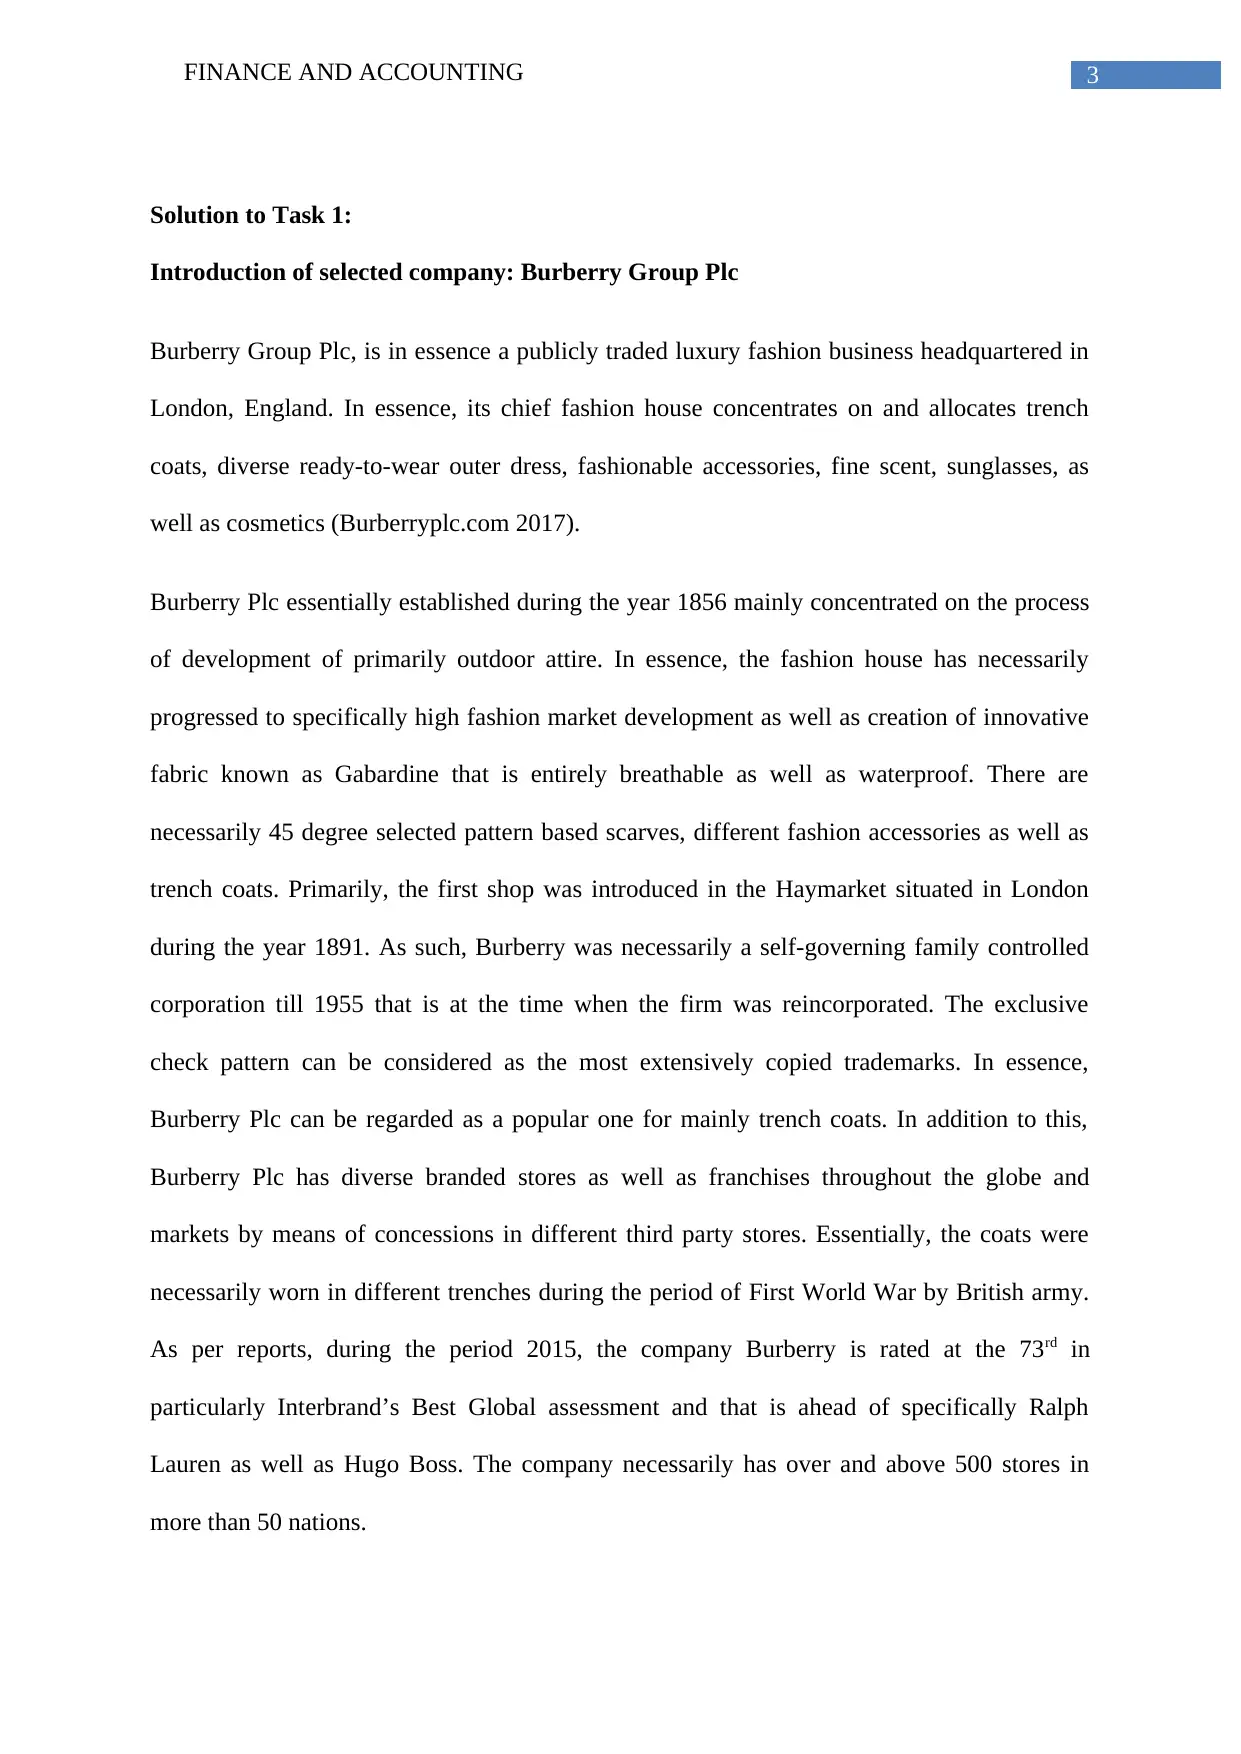
Solution to Task 1:
Introduction of selected company: Burberry Group Plc
Burberry Group Plc, is in essence a publicly traded luxury fashion business headquartered in
London, England. In essence, its chief fashion house concentrates on and allocates trench
coats, diverse ready-to-wear outer dress, fashionable accessories, fine scent, sunglasses, as
well as cosmetics (Burberryplc.com 2017).
Burberry Plc essentially established during the year 1856 mainly concentrated on the process
of development of primarily outdoor attire. In essence, the fashion house has necessarily
progressed to specifically high fashion market development as well as creation of innovative
fabric known as Gabardine that is entirely breathable as well as waterproof. There are
necessarily 45 degree selected pattern based scarves, different fashion accessories as well as
trench coats. Primarily, the first shop was introduced in the Haymarket situated in London
during the year 1891. As such, Burberry was necessarily a self-governing family controlled
corporation till 1955 that is at the time when the firm was reincorporated. The exclusive
check pattern can be considered as the most extensively copied trademarks. In essence,
Burberry Plc can be regarded as a popular one for mainly trench coats. In addition to this,
Burberry Plc has diverse branded stores as well as franchises throughout the globe and
markets by means of concessions in different third party stores. Essentially, the coats were
necessarily worn in different trenches during the period of First World War by British army.
As per reports, during the period 2015, the company Burberry is rated at the 73rd in
particularly Interbrand’s Best Global assessment and that is ahead of specifically Ralph
Lauren as well as Hugo Boss. The company necessarily has over and above 500 stores in
more than 50 nations.
⊘ This is a preview!⊘
Do you want full access?
Subscribe today to unlock all pages.
Trusted by 1+ million students worldwide

4FINANCE AND ACCOUNTING
Paraphrase This Document
Need a fresh take? Get an instant paraphrase of this document with our AI Paraphraser
5FINANCE AND ACCOUNTING
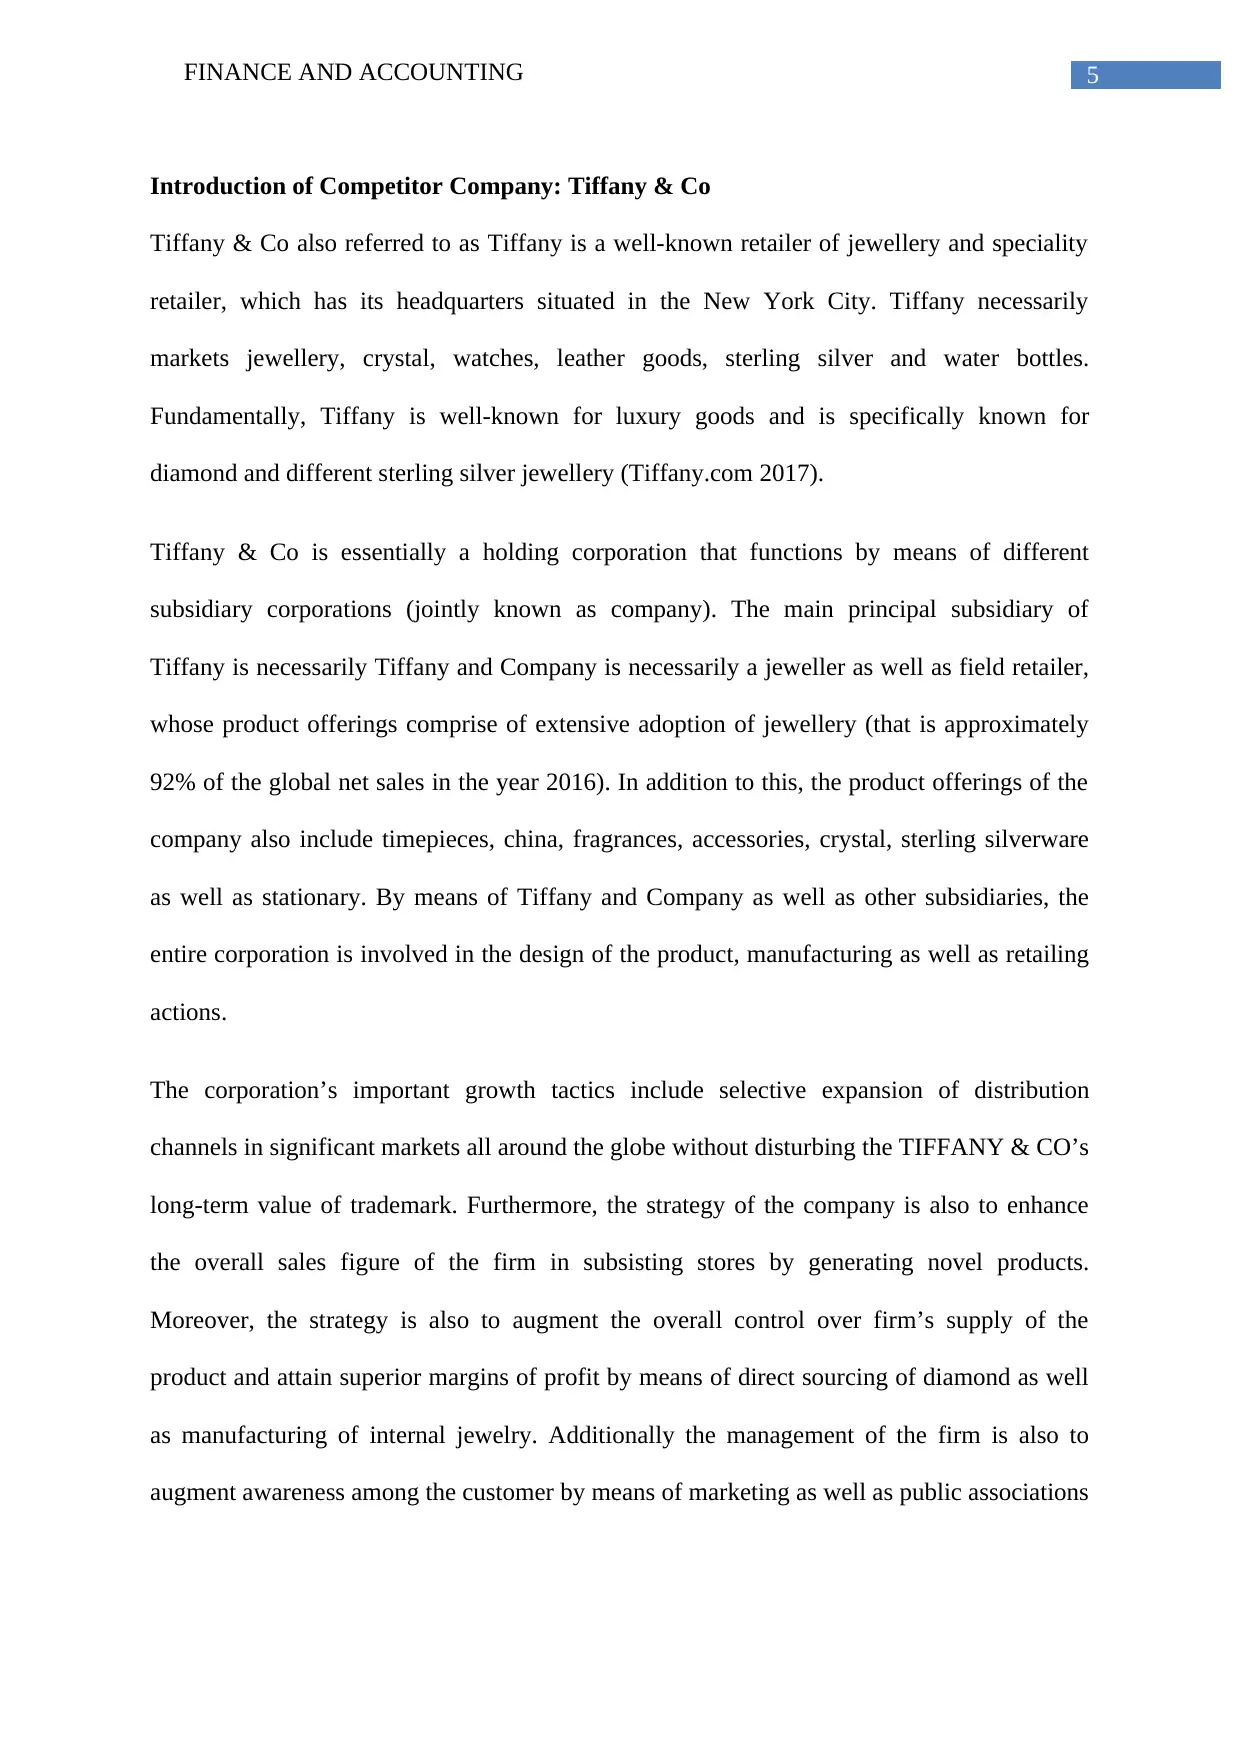
Introduction of Competitor Company: Tiffany & Co
Tiffany & Co also referred to as Tiffany is a well-known retailer of jewellery and speciality
retailer, which has its headquarters situated in the New York City. Tiffany necessarily
markets jewellery, crystal, watches, leather goods, sterling silver and water bottles.
Fundamentally, Tiffany is well-known for luxury goods and is specifically known for
diamond and different sterling silver jewellery (Tiffany.com 2017).
Tiffany & Co is essentially a holding corporation that functions by means of different
subsidiary corporations (jointly known as company). The main principal subsidiary of
Tiffany is necessarily Tiffany and Company is necessarily a jeweller as well as field retailer,
whose product offerings comprise of extensive adoption of jewellery (that is approximately
92% of the global net sales in the year 2016). In addition to this, the product offerings of the
company also include timepieces, china, fragrances, accessories, crystal, sterling silverware
as well as stationary. By means of Tiffany and Company as well as other subsidiaries, the
entire corporation is involved in the design of the product, manufacturing as well as retailing
actions.
The corporation’s important growth tactics include selective expansion of distribution
channels in significant markets all around the globe without disturbing the TIFFANY & CO’s
long-term value of trademark. Furthermore, the strategy of the company is also to enhance
the overall sales figure of the firm in subsisting stores by generating novel products.
Moreover, the strategy is also to augment the overall control over firm’s supply of the
product and attain superior margins of profit by means of direct sourcing of diamond as well
as manufacturing of internal jewelry. Additionally the management of the firm is also to
augment awareness among the customer by means of marketing as well as public associations
6FINANCE AND ACCOUNTING
programs. In addition to this, the company is to offer customer service that makes certain a
finer shopping experience.
Analysis of key financial ratio of two firms during the period 2015 and 2016
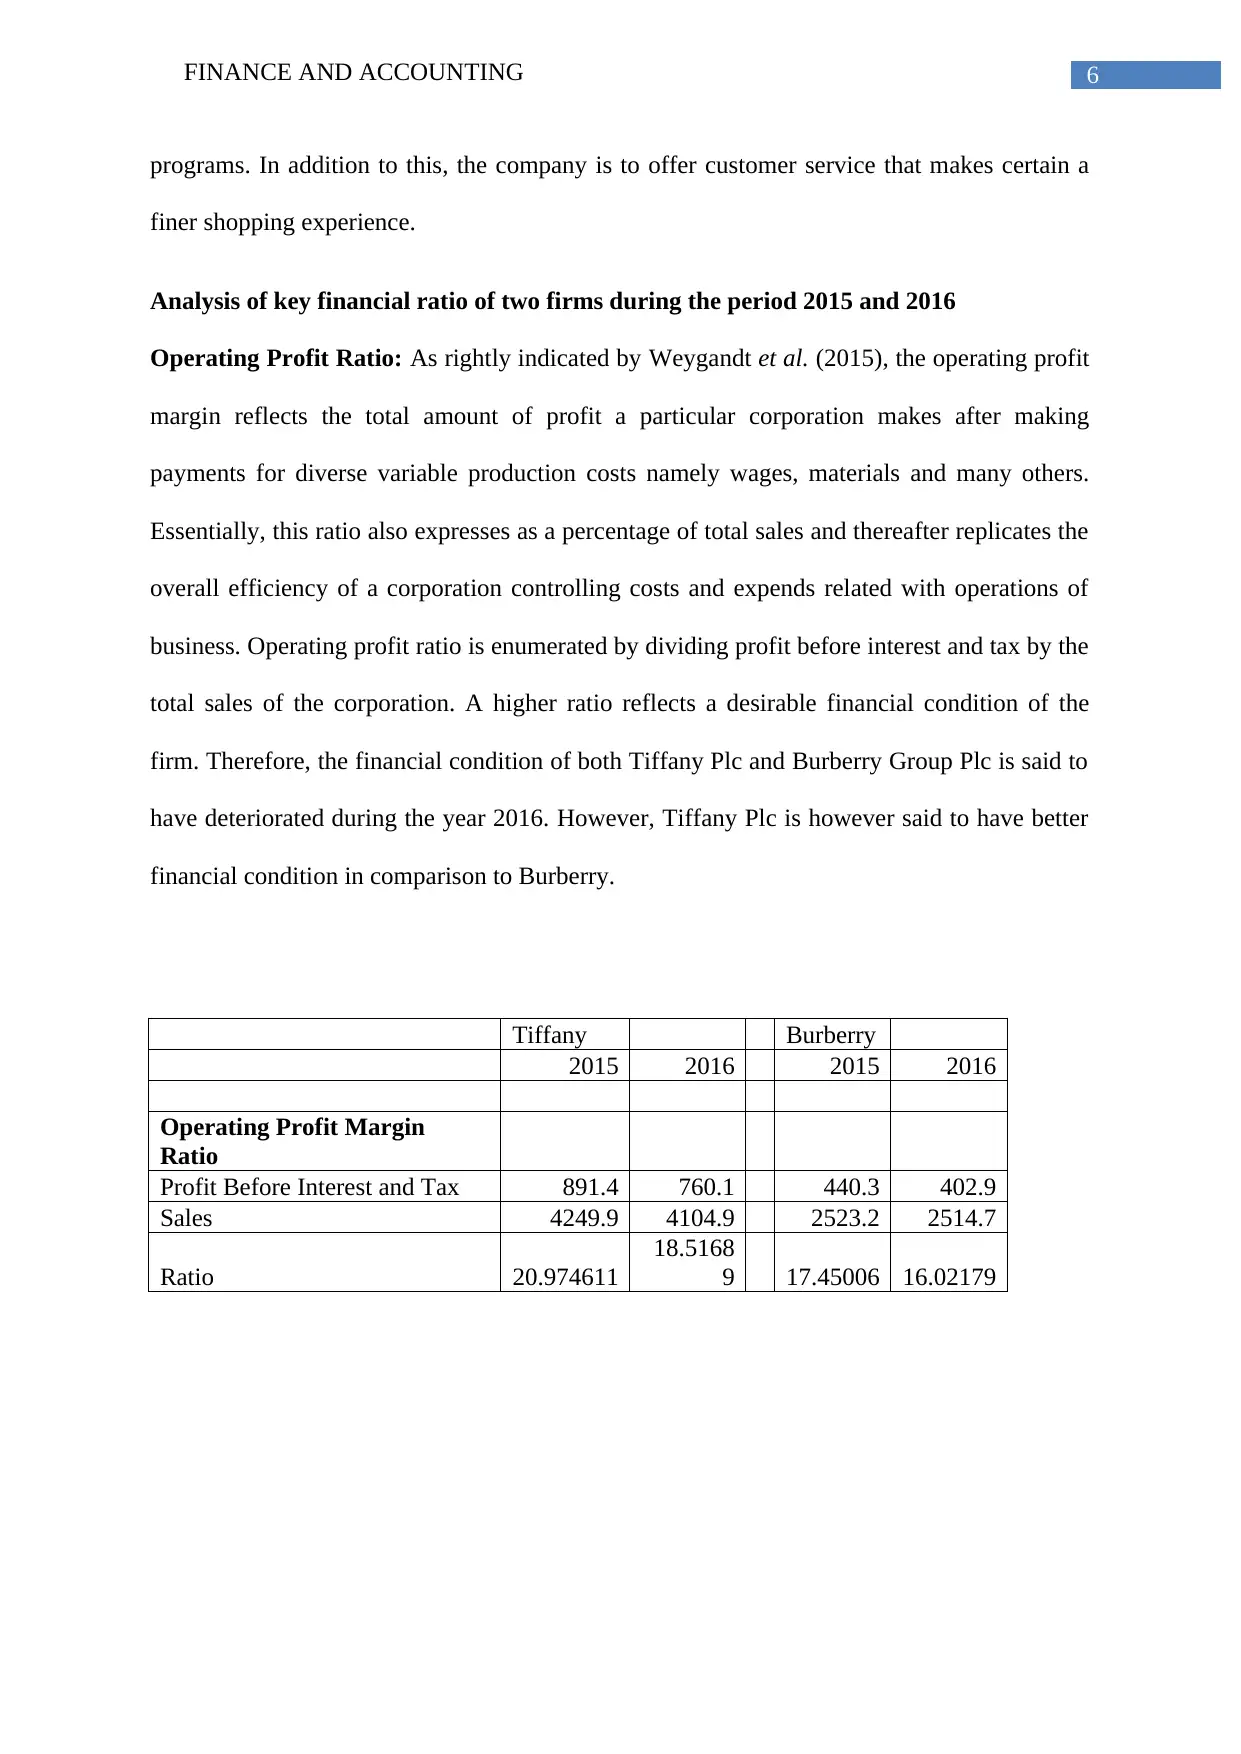
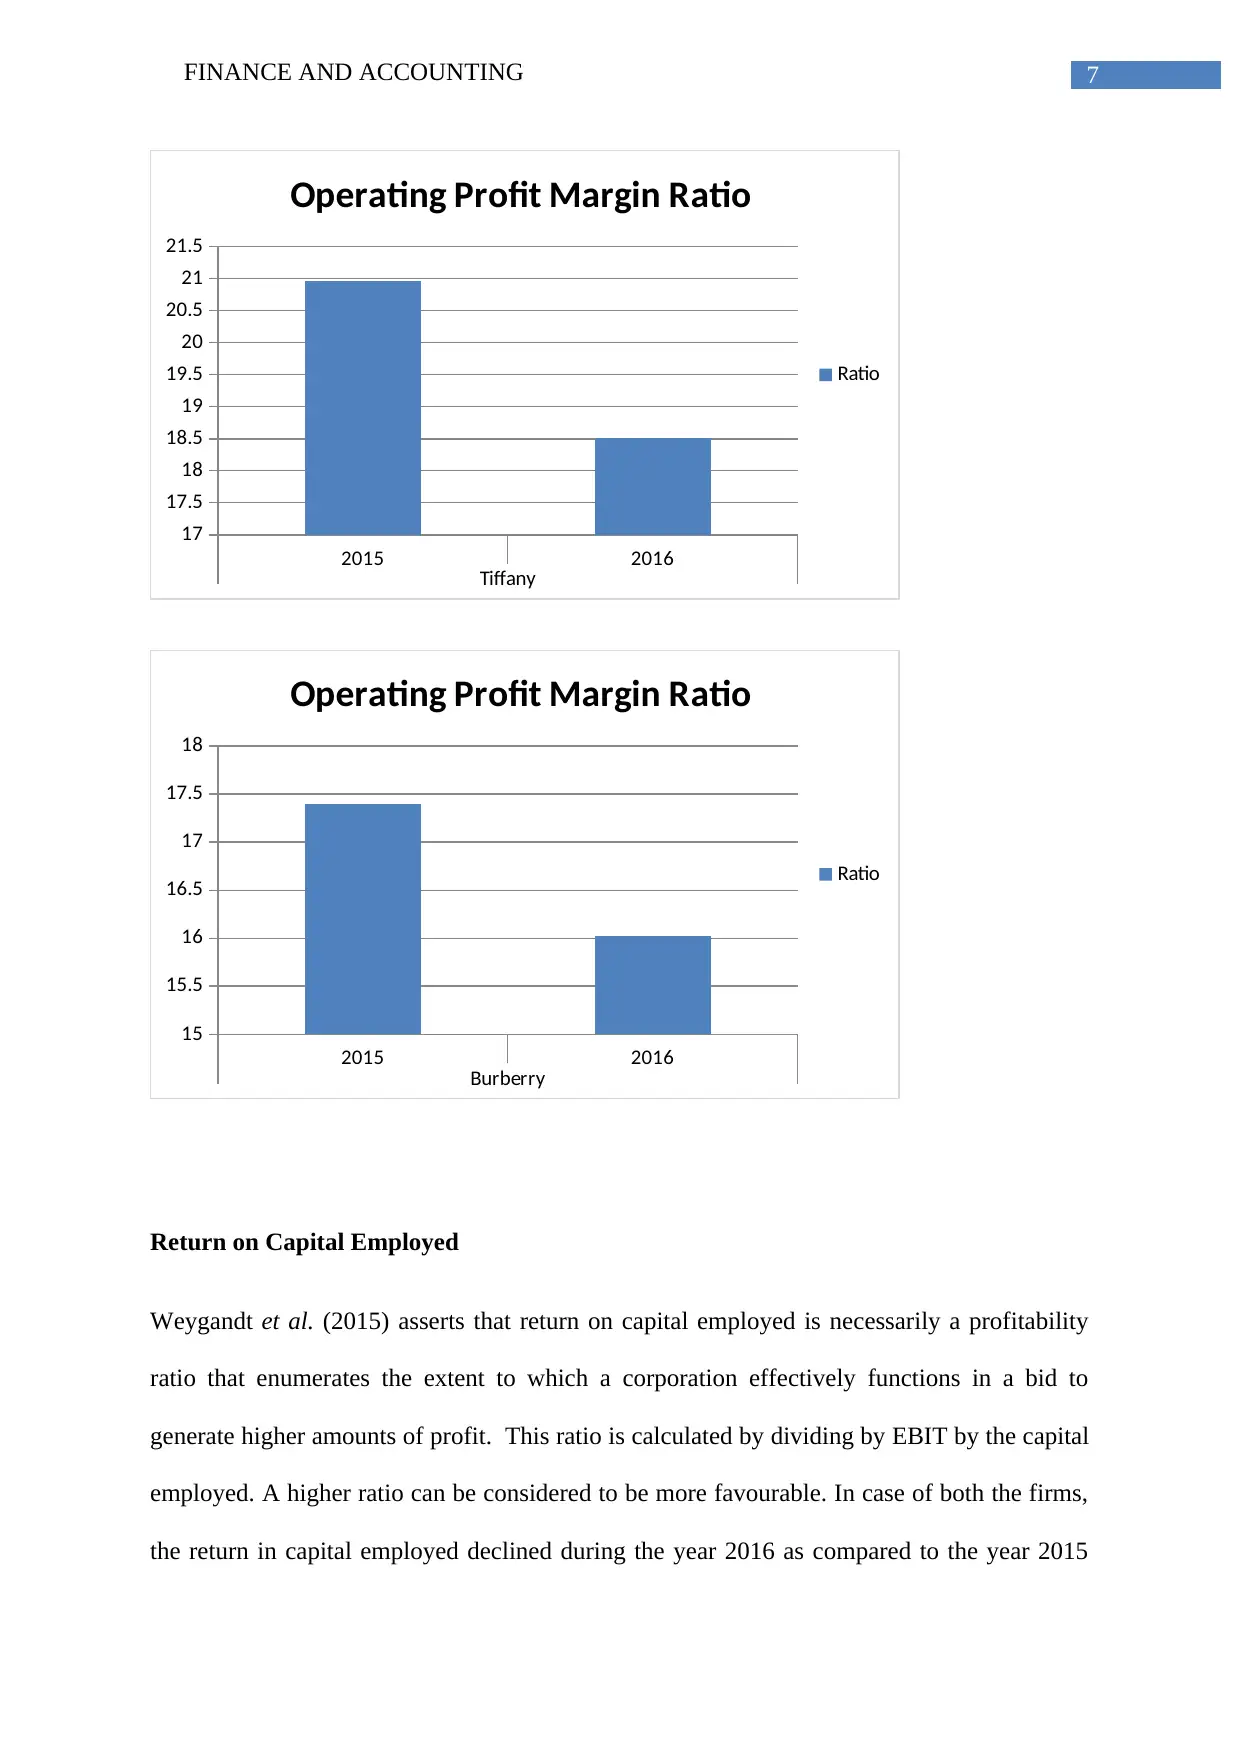
Operating Profit Ratio: As rightly indicated by Weygandt et al. (2015), the operating profit
margin reflects the total amount of profit a particular corporation makes after making
payments for diverse variable production costs namely wages, materials and many others.
Essentially, this ratio also expresses as a percentage of total sales and thereafter replicates the
overall efficiency of a corporation controlling costs and expends related with operations of
business. Operating profit ratio is enumerated by dividing profit before interest and tax by the
total sales of the corporation. A higher ratio reflects a desirable financial condition of the
firm. Therefore, the financial condition of both Tiffany Plc and Burberry Group Plc is said to
have deteriorated during the year 2016. However, Tiffany Plc is however said to have better
financial condition in comparison to Burberry.
Tiffany Burberry
2015 2016 2015 2016
Operating Profit Margin
Ratio
Profit Before Interest and Tax 891.4 760.1 440.3 402.9
Sales 4249.9 4104.9 2523.2 2514.7
Ratio 20.974611
18.5168
9 17.45006 16.02179
programs. In addition to this, the company is to offer customer service that makes certain a
finer shopping experience.
Analysis of key financial ratio of two firms during the period 2015 and 2016
Operating Profit Ratio: As rightly indicated by Weygandt et al. (2015), the operating profit
margin reflects the total amount of profit a particular corporation makes after making
payments for diverse variable production costs namely wages, materials and many others.
Essentially, this ratio also expresses as a percentage of total sales and thereafter replicates the
overall efficiency of a corporation controlling costs and expends related with operations of
business. Operating profit ratio is enumerated by dividing profit before interest and tax by the
total sales of the corporation. A higher ratio reflects a desirable financial condition of the
firm. Therefore, the financial condition of both Tiffany Plc and Burberry Group Plc is said to
have deteriorated during the year 2016. However, Tiffany Plc is however said to have better
financial condition in comparison to Burberry.
Tiffany Burberry
2015 2016 2015 2016
Operating Profit Margin
Ratio
Profit Before Interest and Tax 891.4 760.1 440.3 402.9
Sales 4249.9 4104.9 2523.2 2514.7
Ratio 20.974611
18.5168
9 17.45006 16.02179
⊘ This is a preview!⊘
Do you want full access?
Subscribe today to unlock all pages.
Trusted by 1+ million students worldwide
7FINANCE AND ACCOUNTING
2015 2016
Tiffany
17
17.5
18
18.5
19
19.5
20
20.5
21
21.5
Operating Profit Margin Ratio
Ratio
2015 2016
Burberry
15
15.5
16
16.5
17
17.5
18
Operating Profit Margin Ratio
Ratio
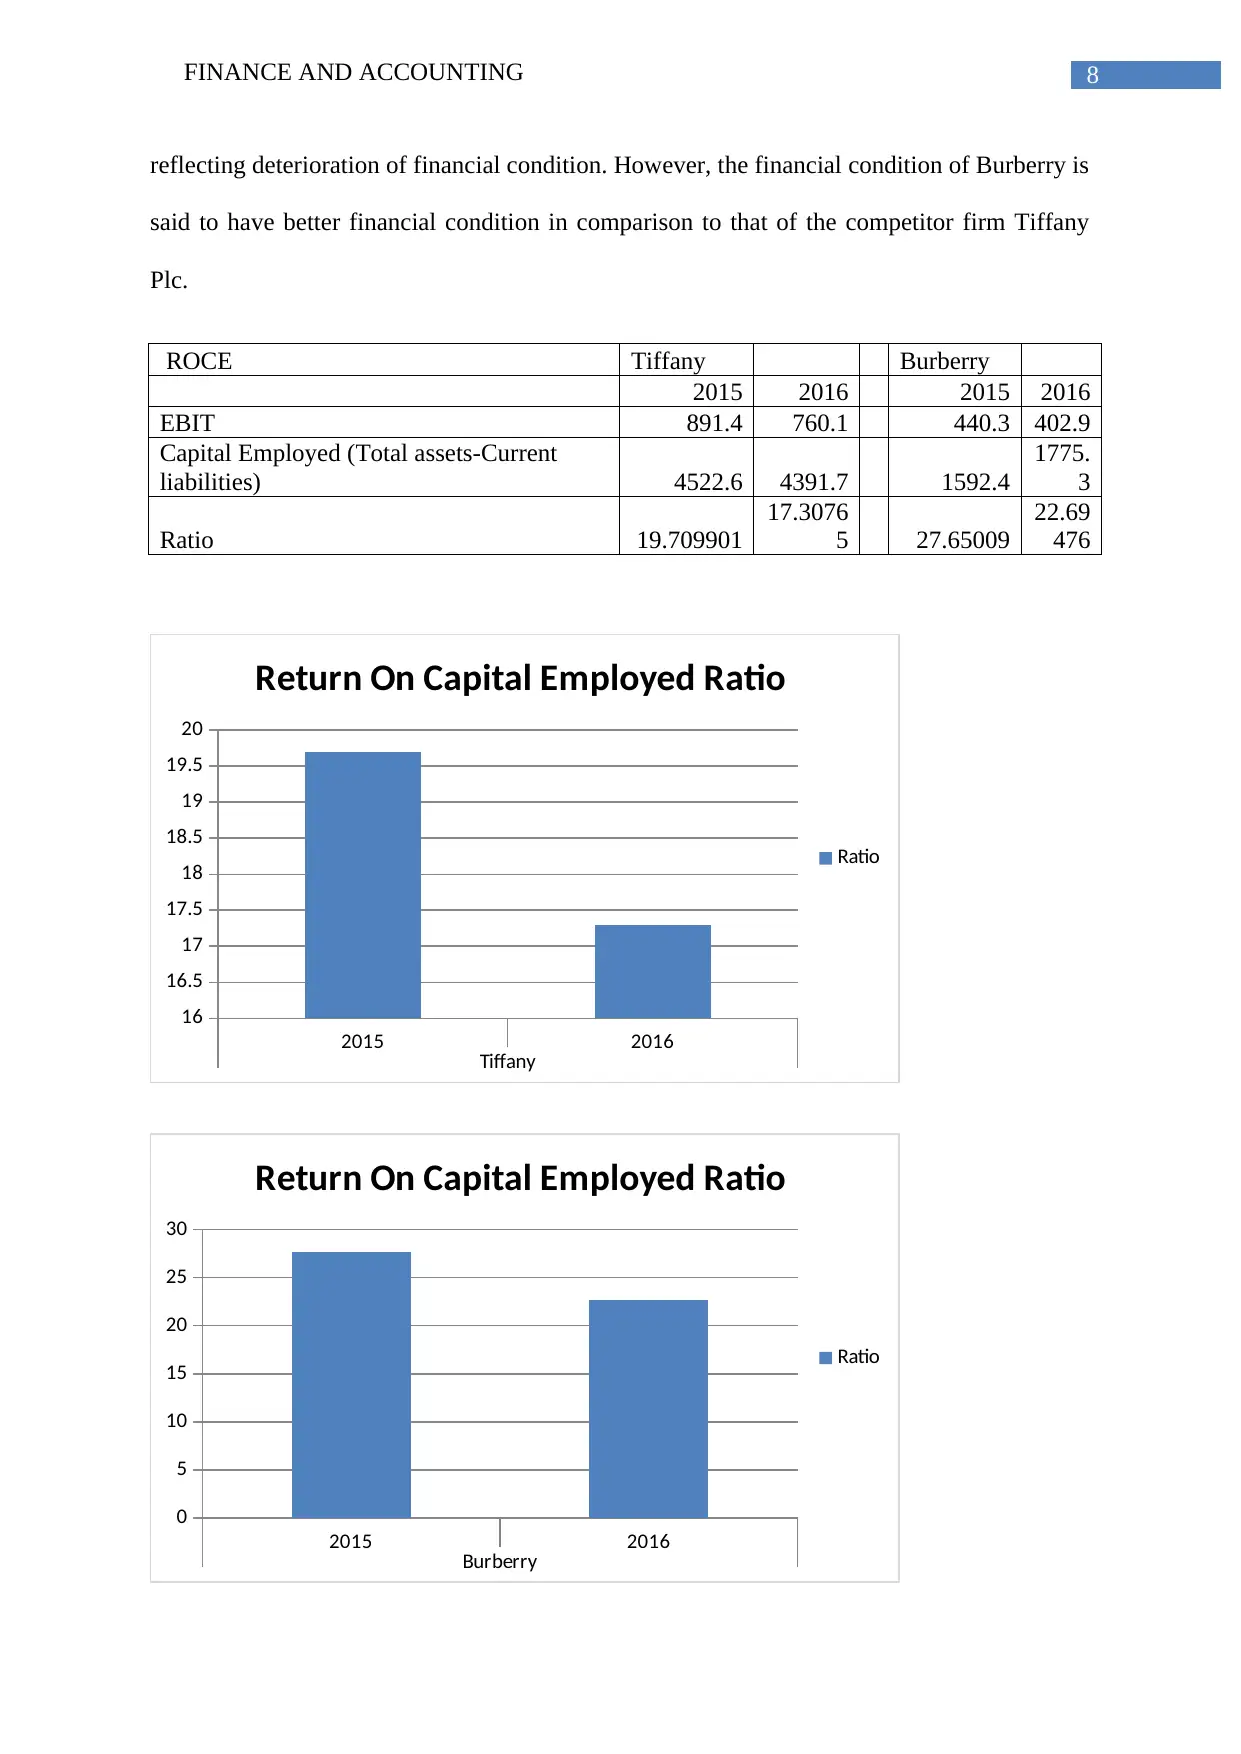
Return on Capital Employed
Weygandt et al. (2015) asserts that return on capital employed is necessarily a profitability
ratio that enumerates the extent to which a corporation effectively functions in a bid to
generate higher amounts of profit. This ratio is calculated by dividing by EBIT by the capital
employed. A higher ratio can be considered to be more favourable. In case of both the firms,
the return in capital employed declined during the year 2016 as compared to the year 2015
2015 2016
Tiffany
17
17.5
18
18.5
19
19.5
20
20.5
21
21.5
Operating Profit Margin Ratio
Ratio
2015 2016
Burberry
15
15.5
16
16.5
17
17.5
18
Operating Profit Margin Ratio
Ratio
Return on Capital Employed
Weygandt et al. (2015) asserts that return on capital employed is necessarily a profitability
ratio that enumerates the extent to which a corporation effectively functions in a bid to
generate higher amounts of profit. This ratio is calculated by dividing by EBIT by the capital
employed. A higher ratio can be considered to be more favourable. In case of both the firms,
the return in capital employed declined during the year 2016 as compared to the year 2015
Paraphrase This Document
Need a fresh take? Get an instant paraphrase of this document with our AI Paraphraser
8FINANCE AND ACCOUNTING
reflecting deterioration of financial condition. However, the financial condition of Burberry is
said to have better financial condition in comparison to that of the competitor firm Tiffany
Plc.
ROCE Tiffany Burberry
2015 2016 2015 2016
EBIT 891.4 760.1 440.3 402.9
Capital Employed (Total assets-Current
liabilities) 4522.6 4391.7 1592.4
1775.
3
Ratio 19.709901
17.3076
5 27.65009
22.69
476
2015 2016
Tiffany
16
16.5
17
17.5
18
18.5
19
19.5
20
Return On Capital Employed Ratio
Ratio
2015 2016
Burberry
0
5
10
15
20
25
30
Return On Capital Employed Ratio
Ratio
9FINANCE AND ACCOUNTING
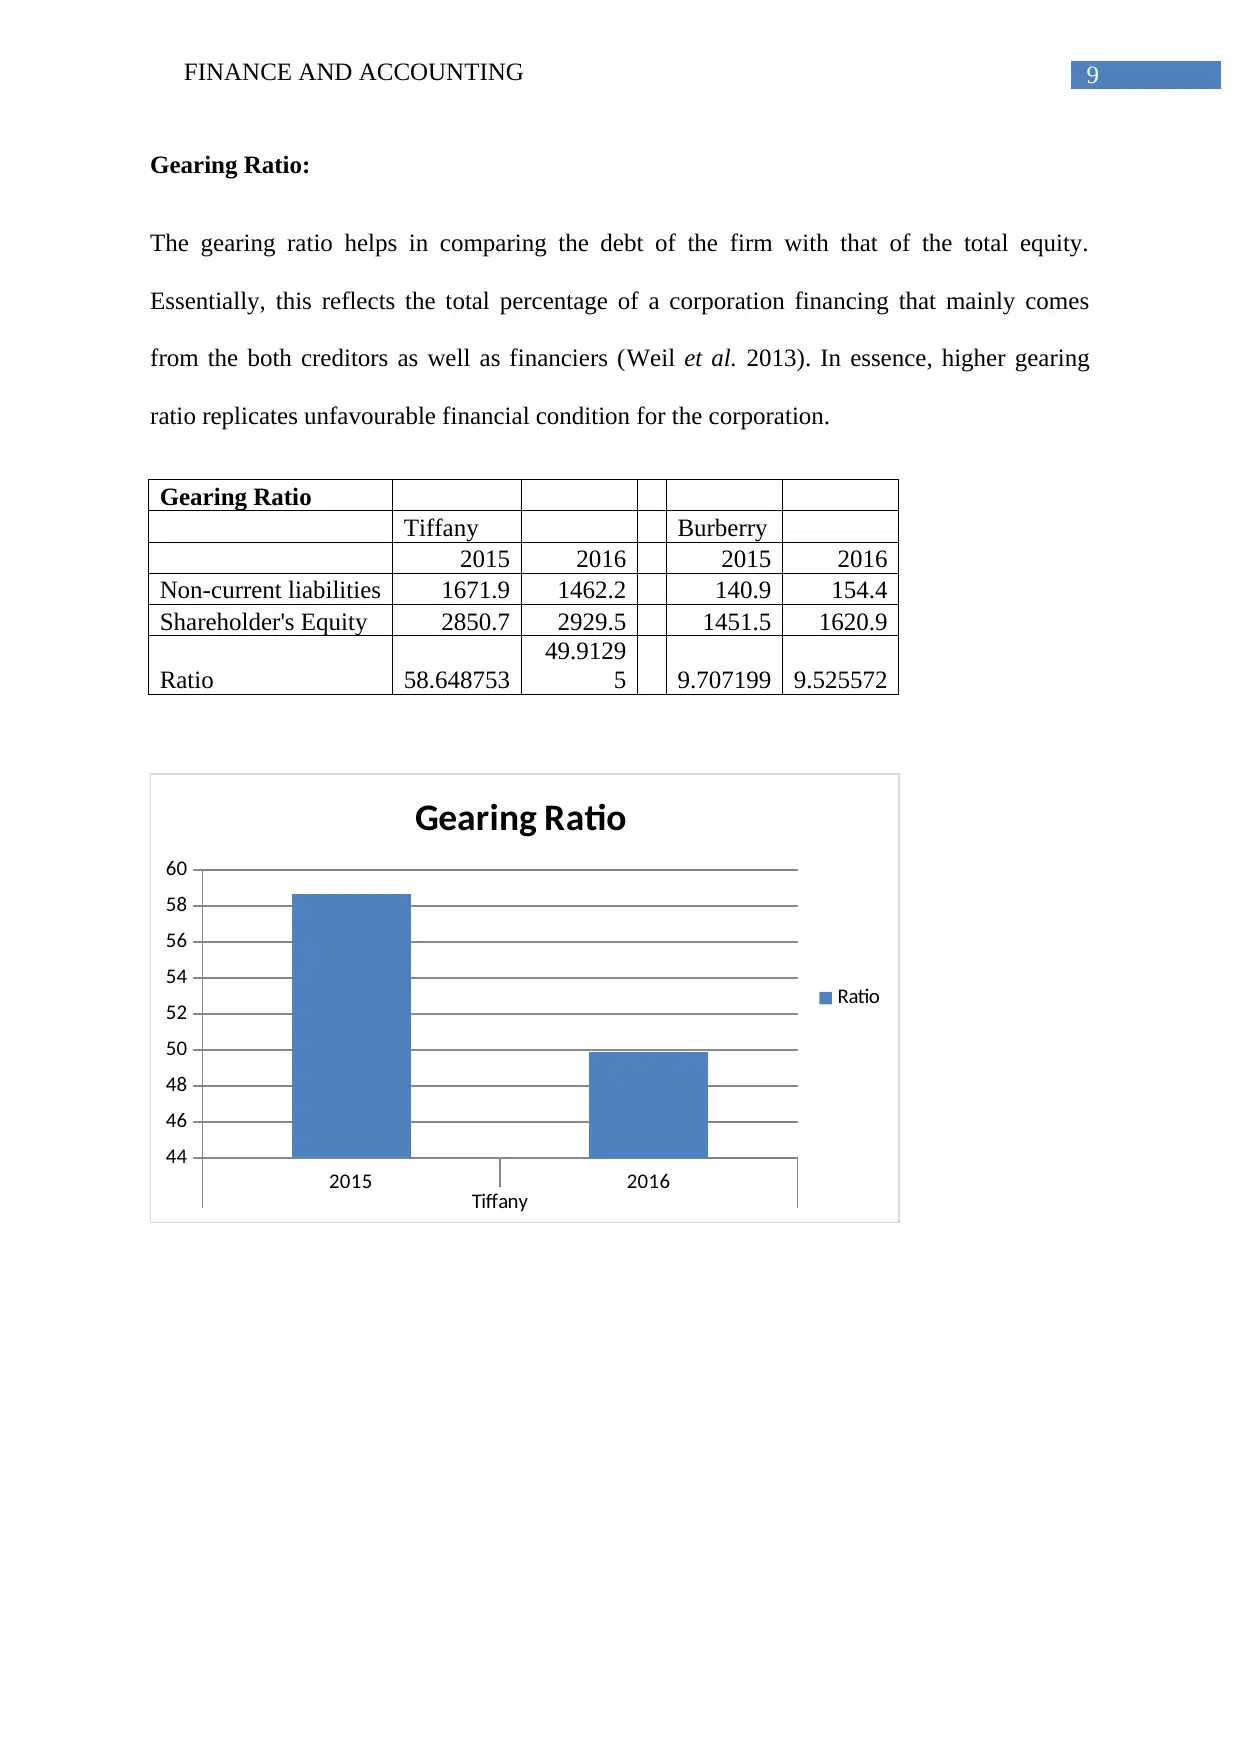
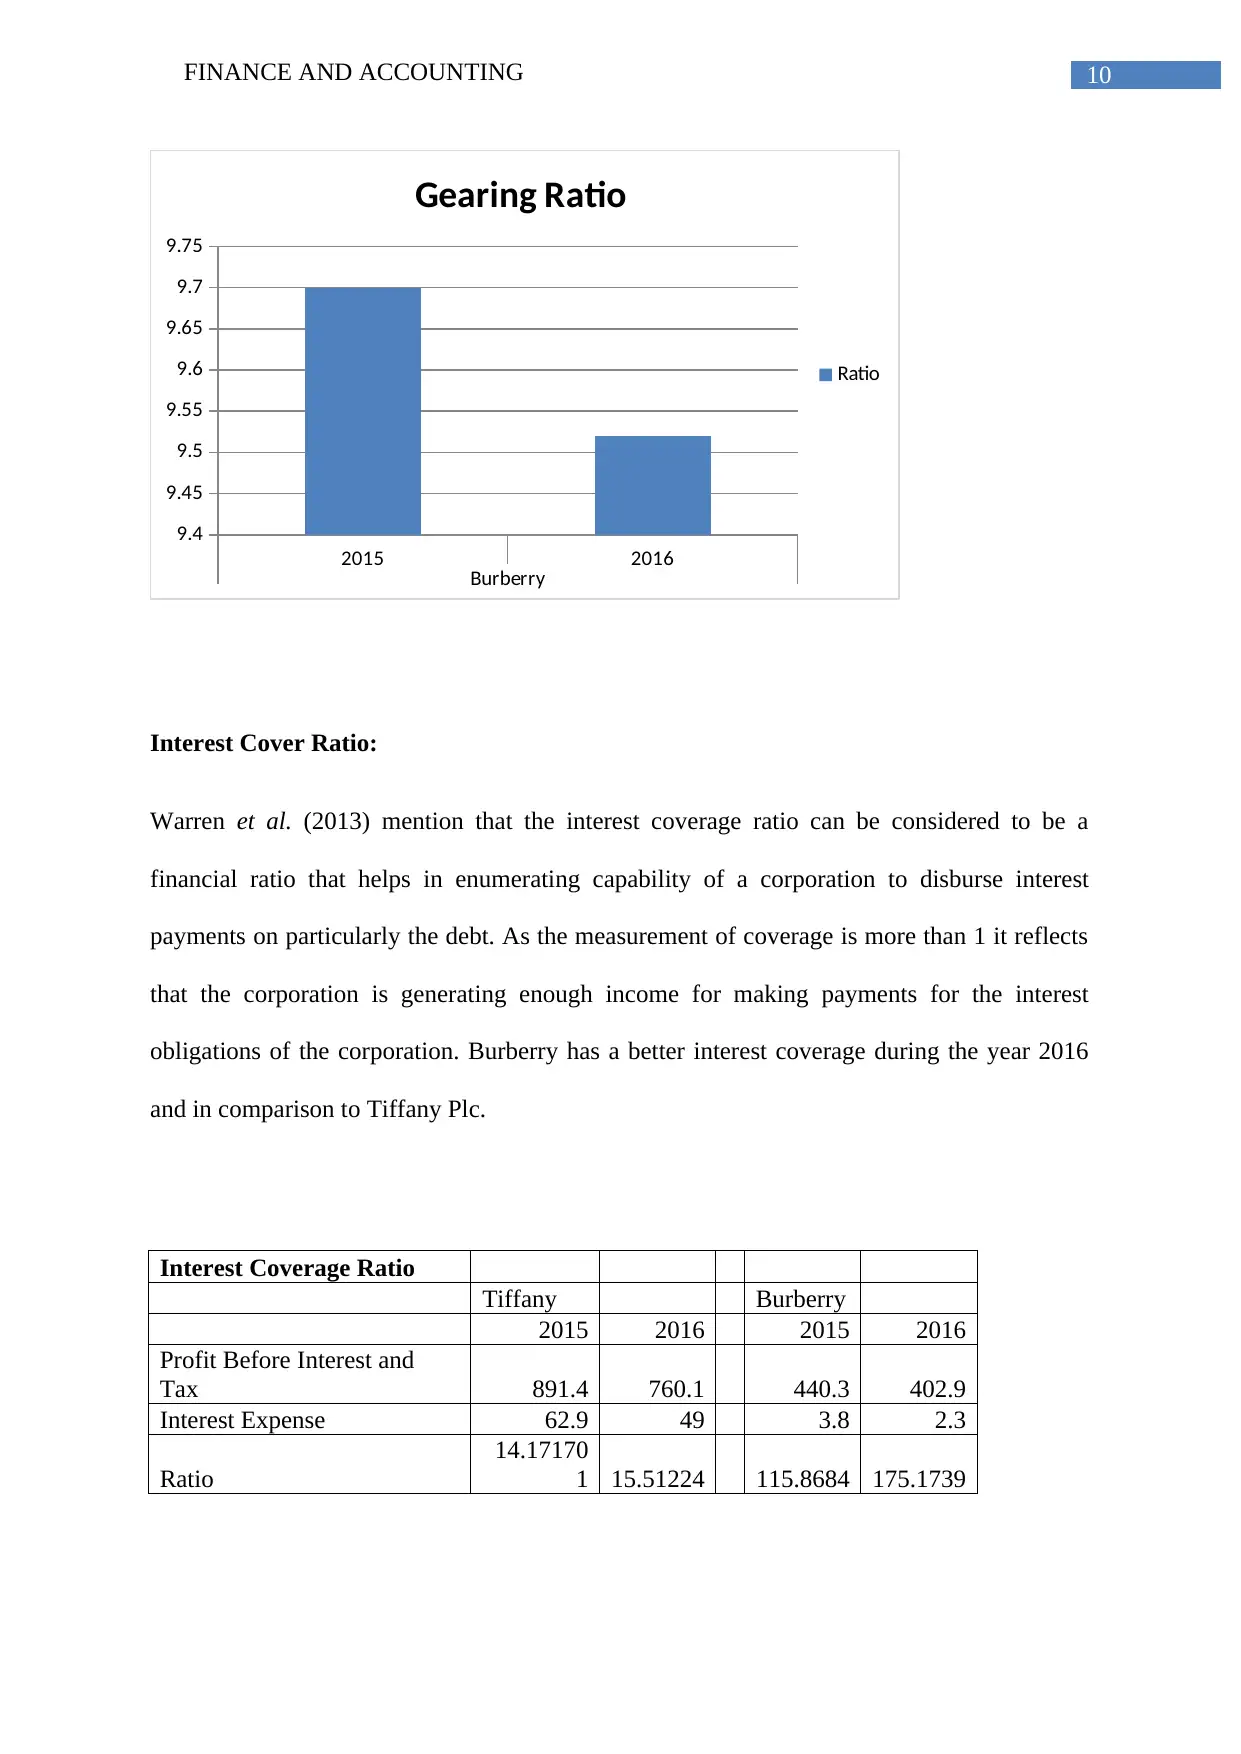
Gearing Ratio:
The gearing ratio helps in comparing the debt of the firm with that of the total equity.
Essentially, this reflects the total percentage of a corporation financing that mainly comes
from the both creditors as well as financiers (Weil et al. 2013). In essence, higher gearing
ratio replicates unfavourable financial condition for the corporation.
Gearing Ratio
Tiffany Burberry
2015 2016 2015 2016
Non-current liabilities 1671.9 1462.2 140.9 154.4
Shareholder's Equity 2850.7 2929.5 1451.5 1620.9
Ratio 58.648753
49.9129
5 9.707199 9.525572
2015 2016
Tiffany
44
46
48
50
52
54
56
58
60
Gearing Ratio
Ratio
⊘ This is a preview!⊘
Do you want full access?
Subscribe today to unlock all pages.
Trusted by 1+ million students worldwide
10FINANCE AND ACCOUNTING
2015 2016
Burberry
9.4
9.45
9.5
9.55
9.6
9.65
9.7
9.75
Gearing Ratio
Ratio
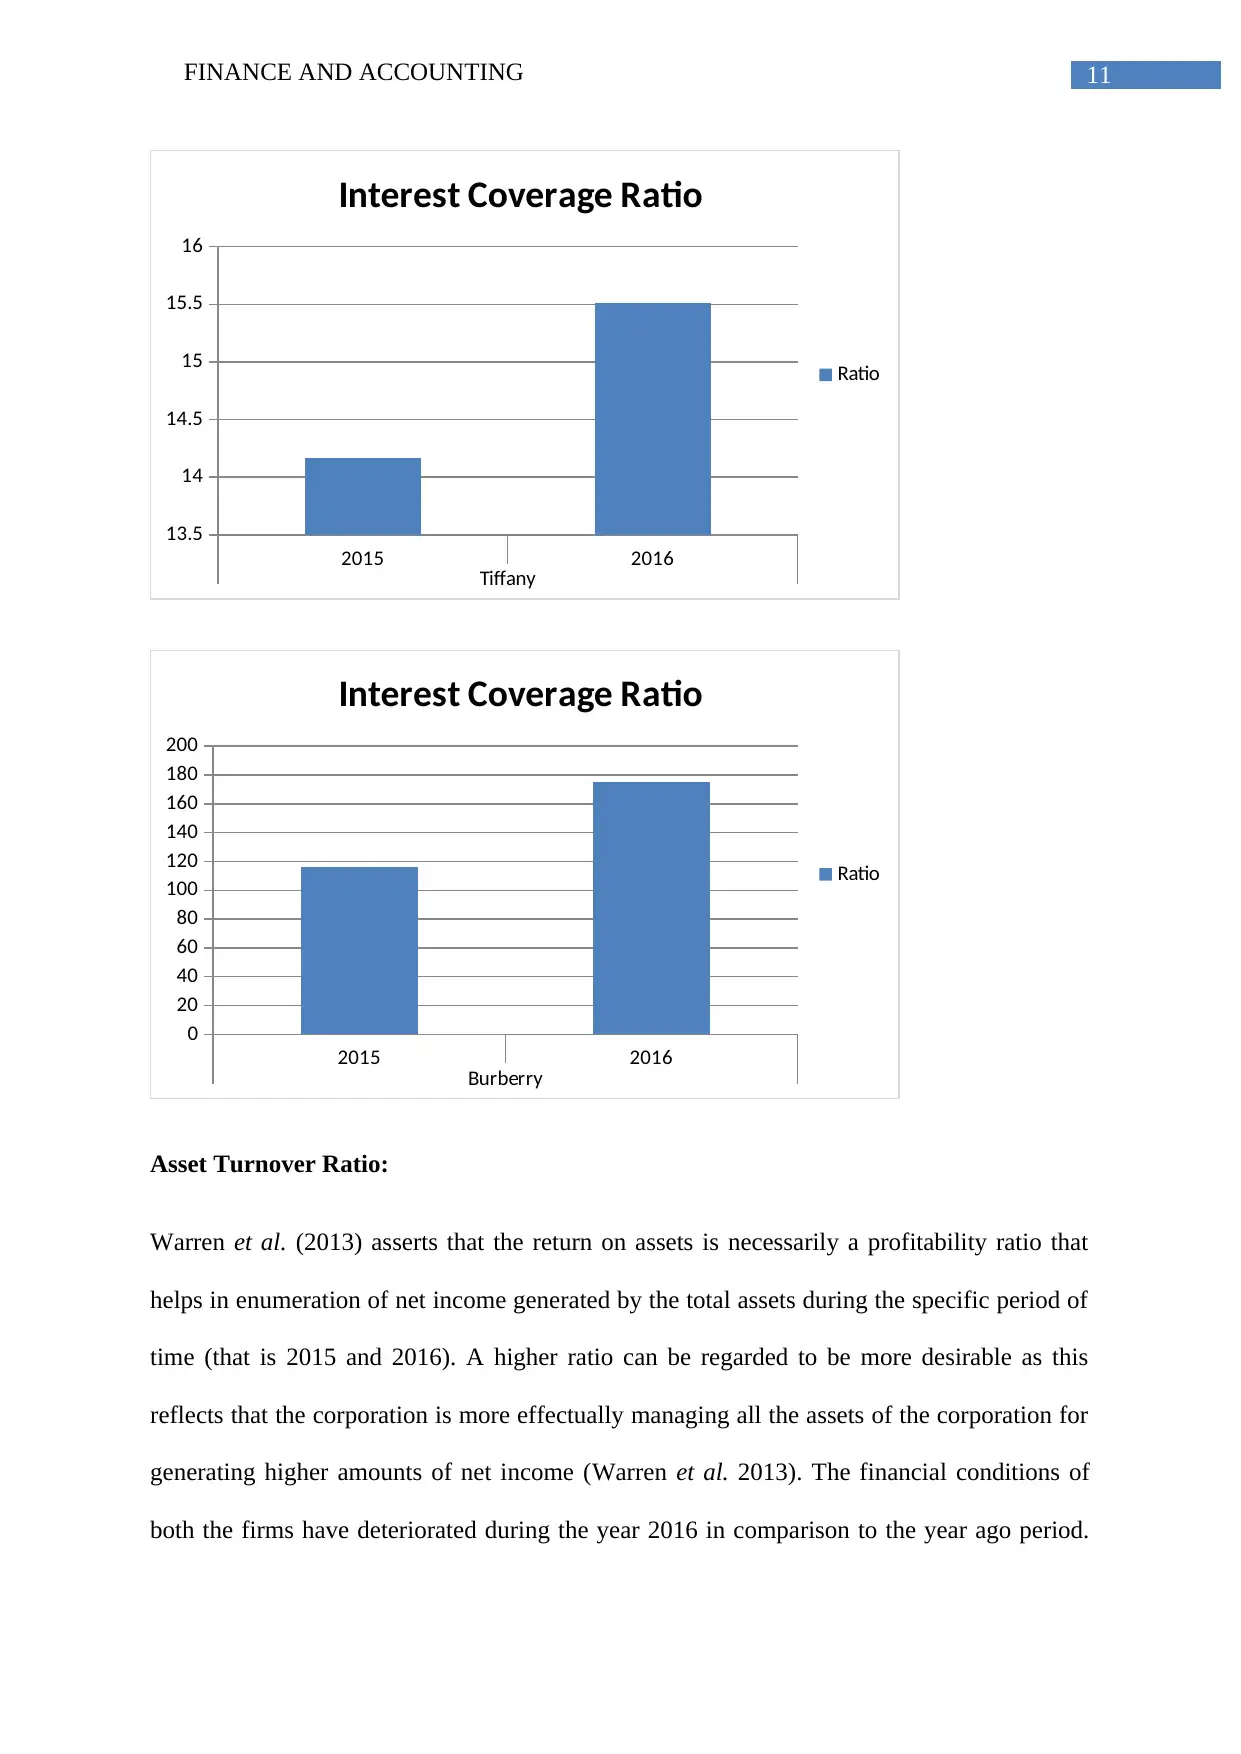
Interest Cover Ratio:
Warren et al. (2013) mention that the interest coverage ratio can be considered to be a
financial ratio that helps in enumerating capability of a corporation to disburse interest
payments on particularly the debt. As the measurement of coverage is more than 1 it reflects
that the corporation is generating enough income for making payments for the interest
obligations of the corporation. Burberry has a better interest coverage during the year 2016
and in comparison to Tiffany Plc.
Interest Coverage Ratio
Tiffany Burberry
2015 2016 2015 2016
Profit Before Interest and
Tax 891.4 760.1 440.3 402.9
Interest Expense 62.9 49 3.8 2.3
Ratio
14.17170
1 15.51224 115.8684 175.1739
2015 2016
Burberry
9.4
9.45
9.5
9.55
9.6
9.65
9.7
9.75
Gearing Ratio
Ratio
Interest Cover Ratio:
Warren et al. (2013) mention that the interest coverage ratio can be considered to be a
financial ratio that helps in enumerating capability of a corporation to disburse interest
payments on particularly the debt. As the measurement of coverage is more than 1 it reflects
that the corporation is generating enough income for making payments for the interest
obligations of the corporation. Burberry has a better interest coverage during the year 2016
and in comparison to Tiffany Plc.
Interest Coverage Ratio
Tiffany Burberry
2015 2016 2015 2016
Profit Before Interest and
Tax 891.4 760.1 440.3 402.9
Interest Expense 62.9 49 3.8 2.3
Ratio
14.17170
1 15.51224 115.8684 175.1739
Paraphrase This Document
Need a fresh take? Get an instant paraphrase of this document with our AI Paraphraser
11FINANCE AND ACCOUNTING
2015 2016
Tiffany
13.5
14
14.5
15
15.5
16
Interest Coverage Ratio
Ratio
2015 2016
Burberry
0
20
40
60
80
100
120
140
160
180
200
Interest Coverage Ratio
Ratio
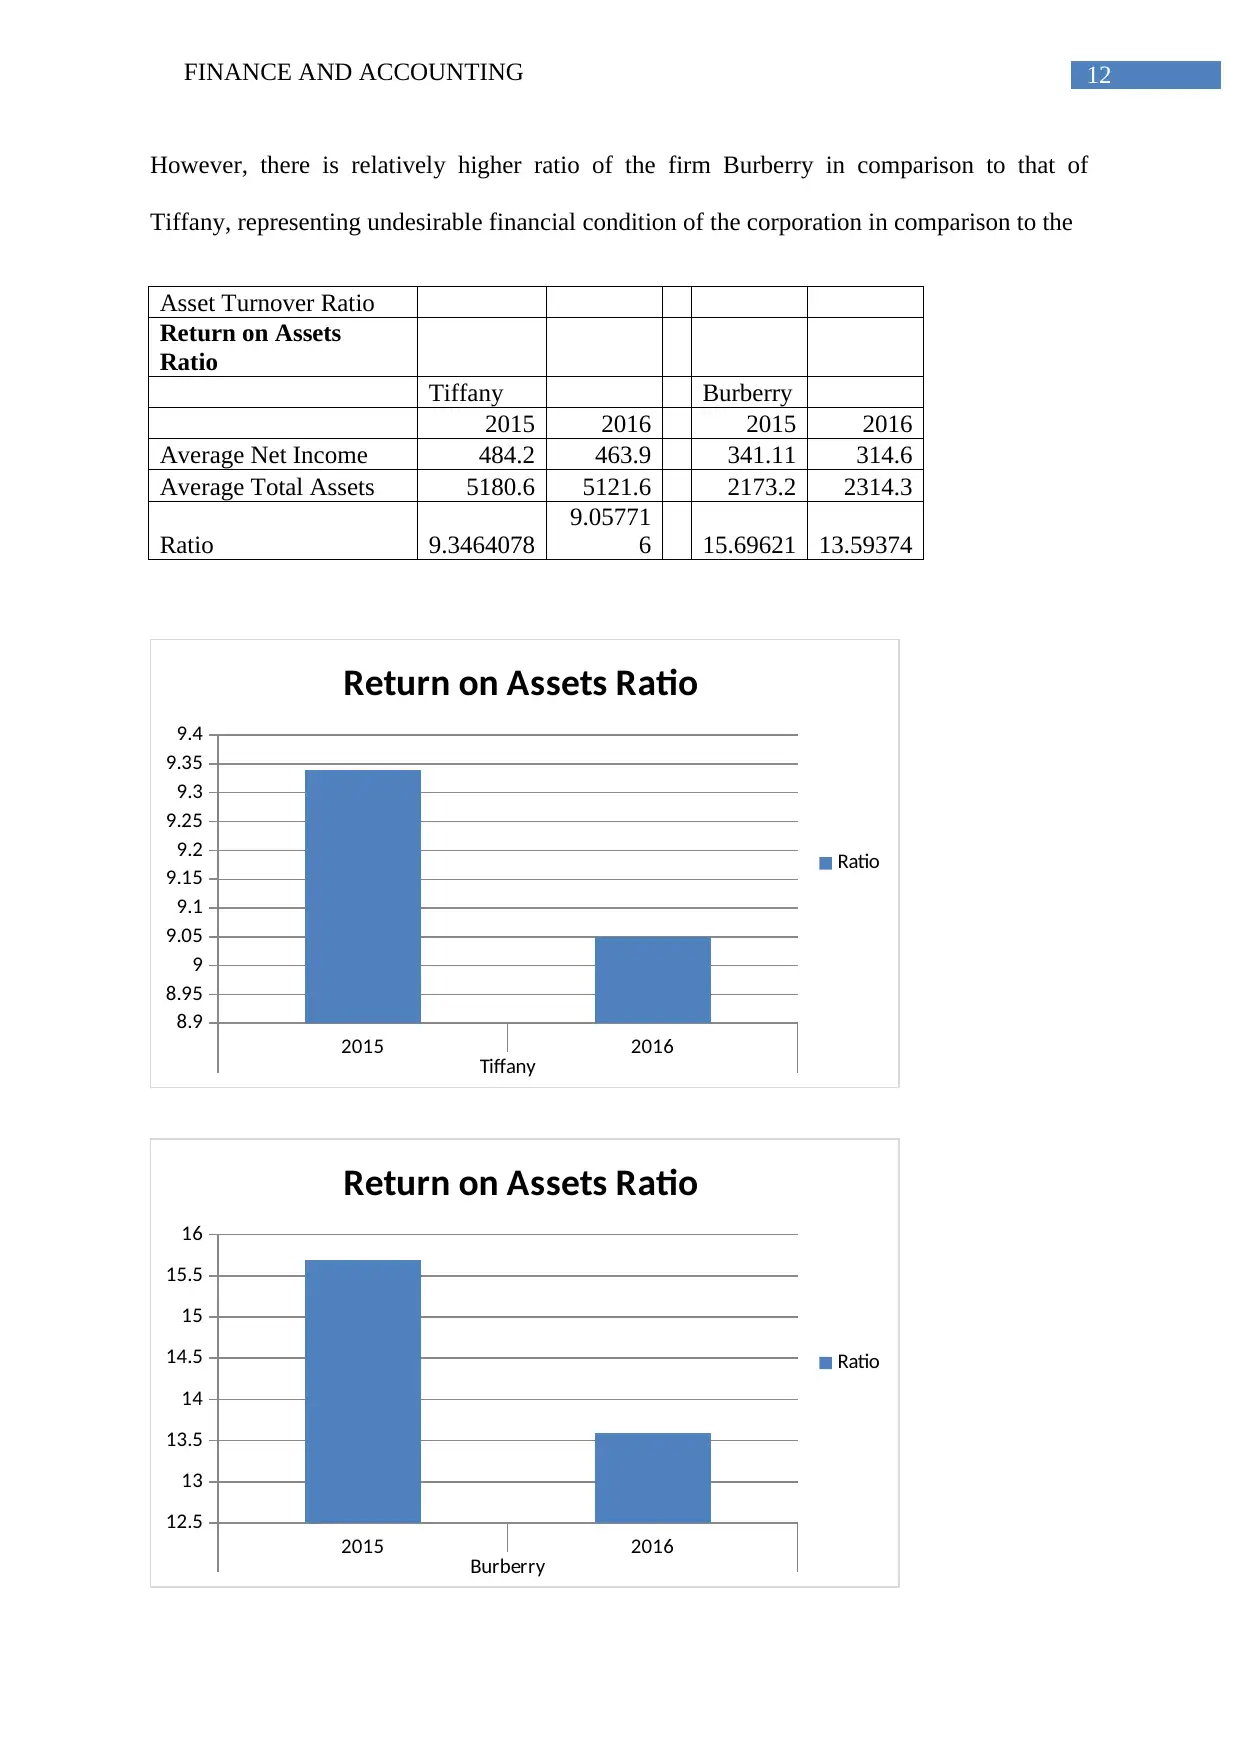
Asset Turnover Ratio:
Warren et al. (2013) asserts that the return on assets is necessarily a profitability ratio that
helps in enumeration of net income generated by the total assets during the specific period of
time (that is 2015 and 2016). A higher ratio can be regarded to be more desirable as this
reflects that the corporation is more effectually managing all the assets of the corporation for
generating higher amounts of net income (Warren et al. 2013). The financial conditions of
both the firms have deteriorated during the year 2016 in comparison to the year ago period.
2015 2016
Tiffany
13.5
14
14.5
15
15.5
16
Interest Coverage Ratio
Ratio
2015 2016
Burberry
0
20
40
60
80
100
120
140
160
180
200
Interest Coverage Ratio
Ratio
Asset Turnover Ratio:
Warren et al. (2013) asserts that the return on assets is necessarily a profitability ratio that
helps in enumeration of net income generated by the total assets during the specific period of
time (that is 2015 and 2016). A higher ratio can be regarded to be more desirable as this
reflects that the corporation is more effectually managing all the assets of the corporation for
generating higher amounts of net income (Warren et al. 2013). The financial conditions of
both the firms have deteriorated during the year 2016 in comparison to the year ago period.
12FINANCE AND ACCOUNTING
However, there is relatively higher ratio of the firm Burberry in comparison to that of
Tiffany, representing undesirable financial condition of the corporation in comparison to the
Asset Turnover Ratio
Return on Assets
Ratio
Tiffany Burberry
2015 2016 2015 2016
Average Net Income 484.2 463.9 341.11 314.6
Average Total Assets 5180.6 5121.6 2173.2 2314.3
Ratio 9.3464078
9.05771
6 15.69621 13.59374
2015 2016
Tiffany
8.9
8.95
9
9.05
9.1
9.15
9.2
9.25
9.3
9.35
9.4
Return on Assets Ratio
Ratio
2015 2016
Burberry
12.5
13
13.5
14
14.5
15
15.5
16
Return on Assets Ratio
Ratio
⊘ This is a preview!⊘
Do you want full access?
Subscribe today to unlock all pages.
Trusted by 1+ million students worldwide
1 out of 43

Your All-in-One AI-Powered Toolkit for Academic Success.
+13062052269
info@desklib.com
Available 24*7 on WhatsApp / Email
![[object Object]](/_next/static/media/star-bottom.7253800d.svg)
Unlock your academic potential
Copyright © 2020–2026 A2Z Services. All Rights Reserved. Developed and managed by ZUCOL.