Financial Management and Control: Performance Analysis Report
VerifiedAdded on 2020/02/03
|21
|5368
|111
Report
AI Summary
This report delves into the critical domains of financial management and project evaluation, crucial for firm performance and strategic decision-making. Part A focuses on a detailed ratio analysis, evaluating the financial performance of a firm, and identifying its strengths and weaknesses through various profitability, liquidity, gearing, asset utilization, and investor ratios. The analysis provides interpretations and highlights the implications of each ratio, comparing performance across two years. Part B explores investment appraisal methods, evaluating project cash flows and interpreting the results, alongside a discussion of the benefits and limitations of these methods. The report concludes with an overview of potential sources of finance in the context of project finance.

FINANCIAL MANAGEMENT AND
CONTROL
CONTROL
Paraphrase This Document
Need a fresh take? Get an instant paraphrase of this document with our AI Paraphraser
TABLE OF CONTENTS
INTRODUCTION...........................................................................................................................3
Part A...............................................................................................................................................3
1 Ratio analysis............................................................................................................................3
2 Limitation of ratio analysis.....................................................................................................13
Part B.............................................................................................................................................14
1 Investment appraisal method and interpretation of results.....................................................14
2 Benefits and limitations of the project evaluation methods....................................................18
3 Sources of finance...................................................................................................................19
CONCLUSION..............................................................................................................................20
REFERENCES..............................................................................................................................21
INTRODUCTION
Finance and the project management are the domain that heavily affects firm performance
and business decisions. In the current report, ratio analysis is done and performance of the firm is
measured as well as comments are given on same. Along with this, project evaluation methods
are applied on the cash flows and results are interpreted. In middle part of the report limitations
and benefits of the project evaluation method are discussed in detail. At end of the report,
sources of finance are discussed in context of project finance.
Part A
1 Ratio analysis
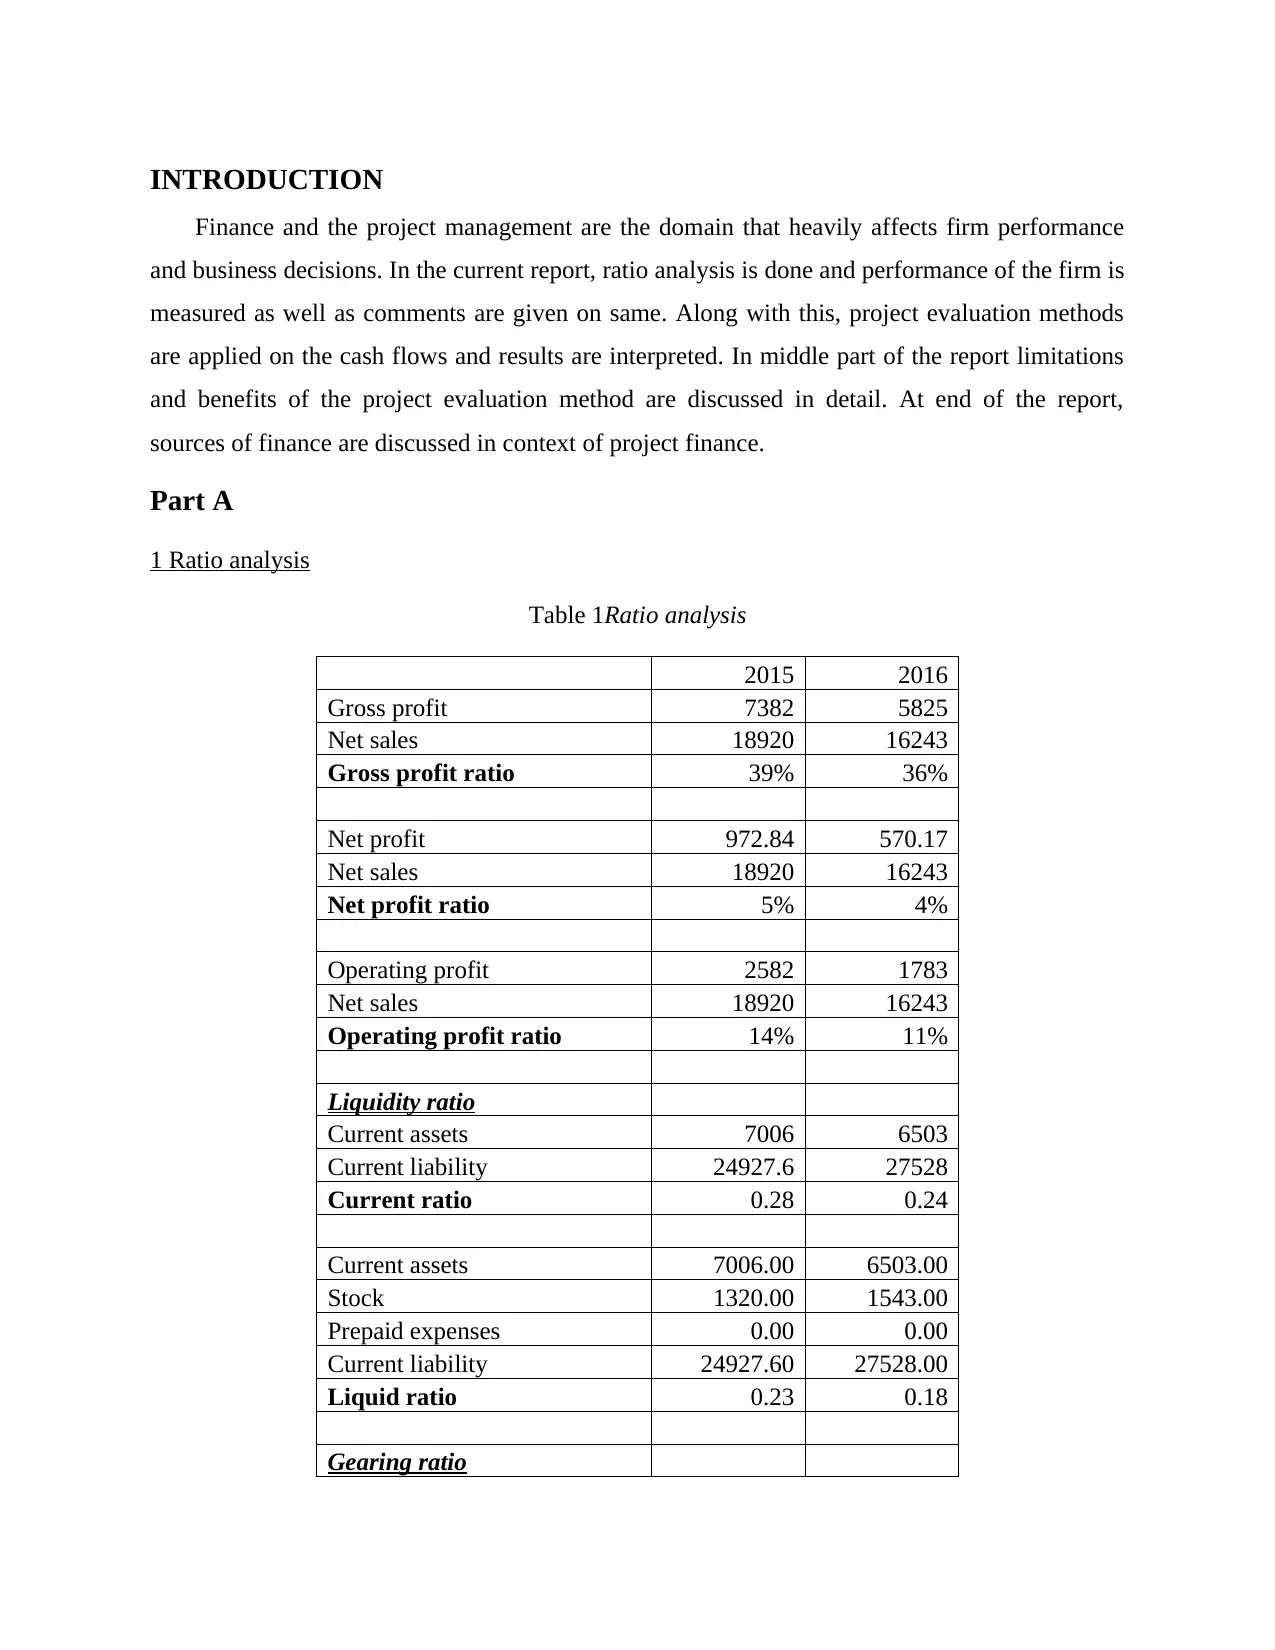
Table 1Ratio analysis
2015 2016
Gross profit 7382 5825
Net sales 18920 16243
Gross profit ratio 39% 36%
Net profit 972.84 570.17
Net sales 18920 16243
Net profit ratio 5% 4%
Operating profit 2582 1783
Net sales 18920 16243
Operating profit ratio 14% 11%
Liquidity ratio
Current assets 7006 6503
Current liability 24927.6 27528
Current ratio 0.28 0.24
Current assets 7006.00 6503.00
Stock 1320.00 1543.00
Prepaid expenses 0.00 0.00
Current liability 24927.60 27528.00
Liquid ratio 0.23 0.18
Gearing ratio
Finance and the project management are the domain that heavily affects firm performance
and business decisions. In the current report, ratio analysis is done and performance of the firm is
measured as well as comments are given on same. Along with this, project evaluation methods
are applied on the cash flows and results are interpreted. In middle part of the report limitations
and benefits of the project evaluation method are discussed in detail. At end of the report,
sources of finance are discussed in context of project finance.
Part A
1 Ratio analysis
Table 1Ratio analysis
2015 2016
Gross profit 7382 5825
Net sales 18920 16243
Gross profit ratio 39% 36%
Net profit 972.84 570.17
Net sales 18920 16243
Net profit ratio 5% 4%
Operating profit 2582 1783
Net sales 18920 16243
Operating profit ratio 14% 11%
Liquidity ratio
Current assets 7006 6503
Current liability 24927.6 27528
Current ratio 0.28 0.24
Current assets 7006.00 6503.00
Stock 1320.00 1543.00
Prepaid expenses 0.00 0.00
Current liability 24927.60 27528.00
Liquid ratio 0.23 0.18
Gearing ratio
⊘ This is a preview!⊘
Do you want full access?
Subscribe today to unlock all pages.
Trusted by 1+ million students worldwide
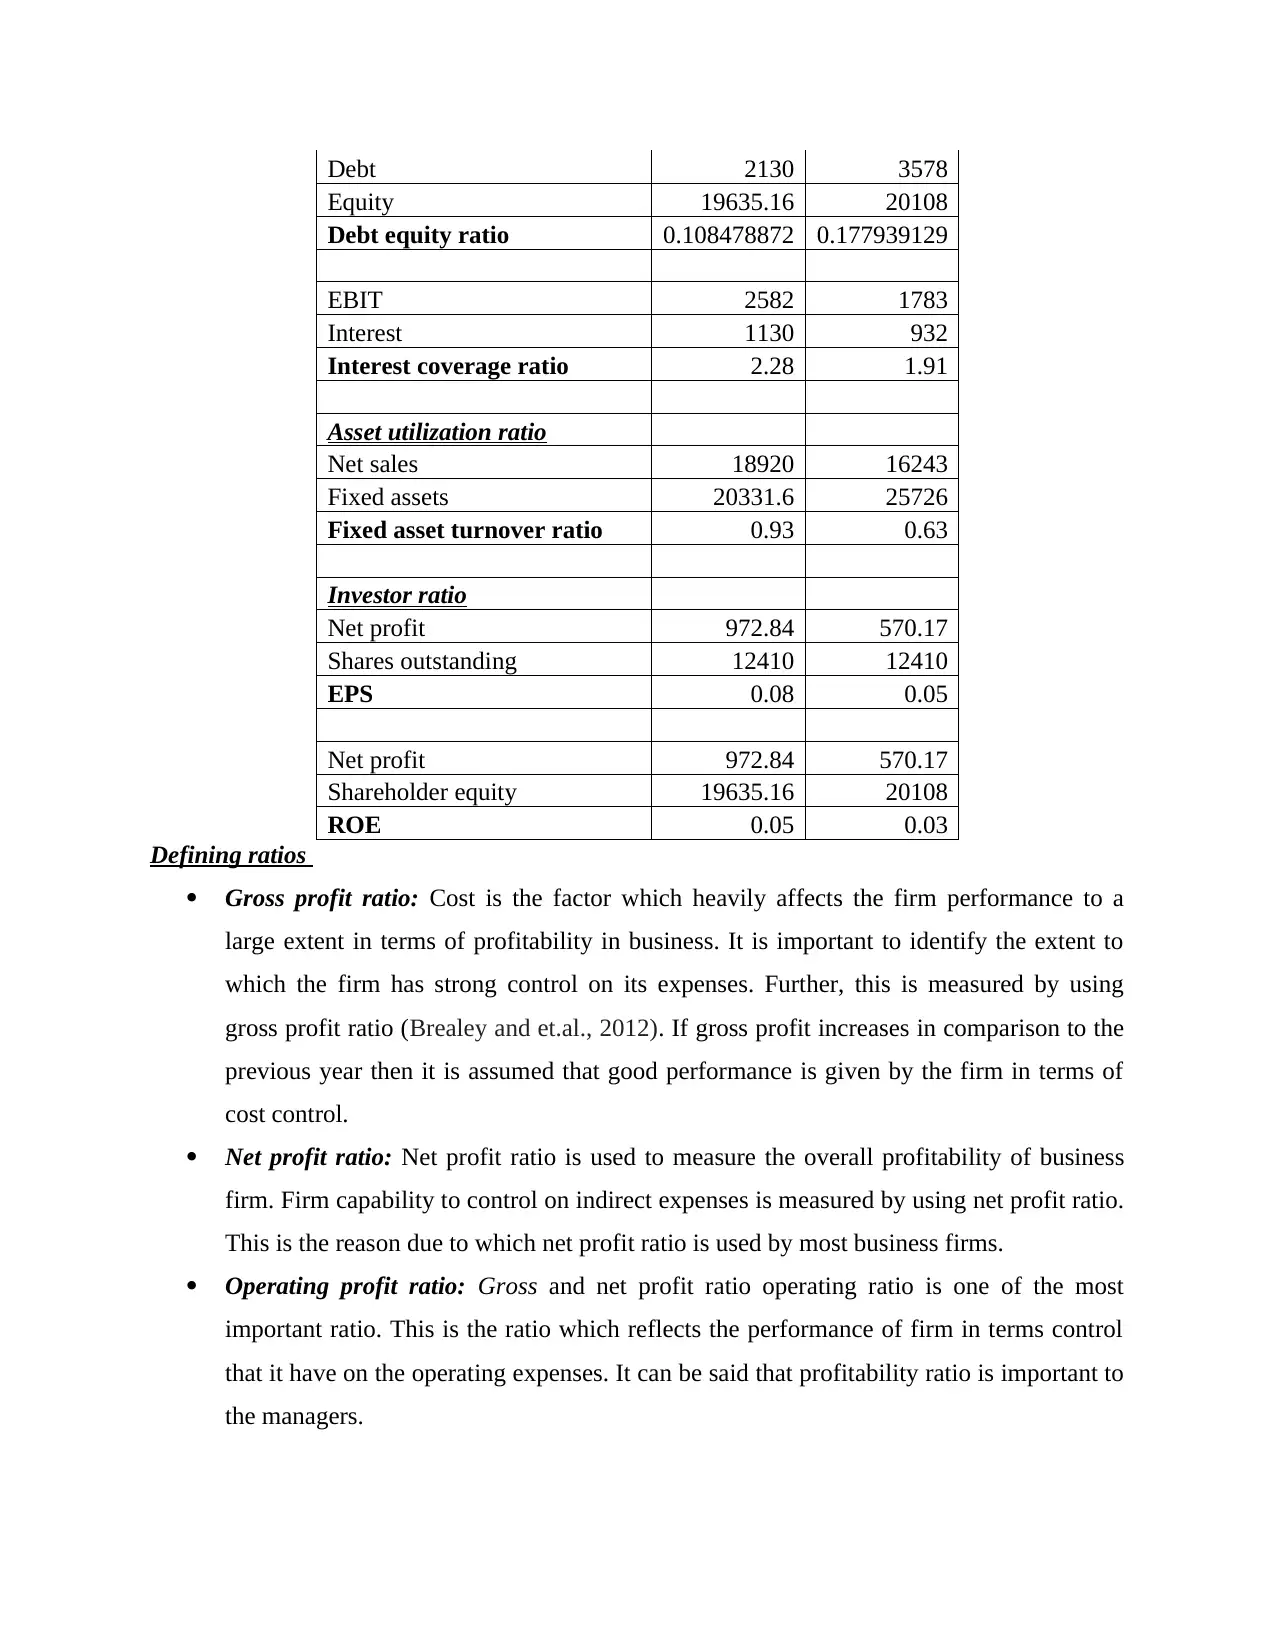
Debt 2130 3578
Equity 19635.16 20108
Debt equity ratio 0.108478872 0.177939129
EBIT 2582 1783
Interest 1130 932
Interest coverage ratio 2.28 1.91
Asset utilization ratio
Net sales 18920 16243
Fixed assets 20331.6 25726
Fixed asset turnover ratio 0.93 0.63
Investor ratio
Net profit 972.84 570.17
Shares outstanding 12410 12410
EPS 0.08 0.05
Net profit 972.84 570.17
Shareholder equity 19635.16 20108
ROE 0.05 0.03
Defining ratios
Gross profit ratio: Cost is the factor which heavily affects the firm performance to a
large extent in terms of profitability in business. It is important to identify the extent to
which the firm has strong control on its expenses. Further, this is measured by using
gross profit ratio (Brealey and et.al., 2012). If gross profit increases in comparison to the
previous year then it is assumed that good performance is given by the firm in terms of
cost control.
Net profit ratio: Net profit ratio is used to measure the overall profitability of business
firm. Firm capability to control on indirect expenses is measured by using net profit ratio.
This is the reason due to which net profit ratio is used by most business firms.
Operating profit ratio: Gross and net profit ratio operating ratio is one of the most
important ratio. This is the ratio which reflects the performance of firm in terms control
that it have on the operating expenses. It can be said that profitability ratio is important to
the managers.
Paraphrase This Document
Need a fresh take? Get an instant paraphrase of this document with our AI Paraphraser
Current ratio: Liquidity position matter a lot for the organization because it indicates that
whether firm will be able to meet its short term finance needs sufficiently. Proportion of
current assets to current liability is compared in the current ratio to access the firm
performance and availability of cash which will be used to meet the short term
obligations.
Liquid ratio: There is a high degree of similarity between current and liquid ratio
(Gitman and Zutter, 2012). In the liquid ratio, stock and prepaid expenses are subtracted
from the current assets to identify the more accurate liquidity position of the business
firm.
Debt equity ratio: Capital structure of Zurich Plc is measured by using the debt equity
ratio (Debt to equity ratio, 2017). In the mentioned ratio, debt is compared with equity to
identify whether the capital structure is balanced or not.
Interest coverage ratio: Interest coverage ratio reflects the extent to which by using
profit interest can be covered. In other words, it can be said that number of times interest
can be paid by using profit is revealed by the interest coverage ratio.
Fixed asset turnover ratio: Fixed asset turnover ratio is used to measure the efficiency
with which firm is using its asset to generate sales in its business (Embrechts,
Klüppelberg and Mikosch, 2013). This ratio reflects the extent to which resources are
efficiently used by the firm in its business.
EPS: Earning per share is one of the most important ratio which reflect the portion of
earning that comes on each share that investor possessed in current time period. If EPS is
increasing then it is assumed that the firm performance has been improved.
Return on equity: Return on equity refers to the return that is earned on per unit of equity
that same hold for the specific time period. Elevation in value of return on equity reflects
that the firm is giving good amount of return to the investor for the risk they have taken
for investing in the business firm.
To,
Board of Directors,
Zurich Plc.
Date: 20th March 2017
Profitability ratios:
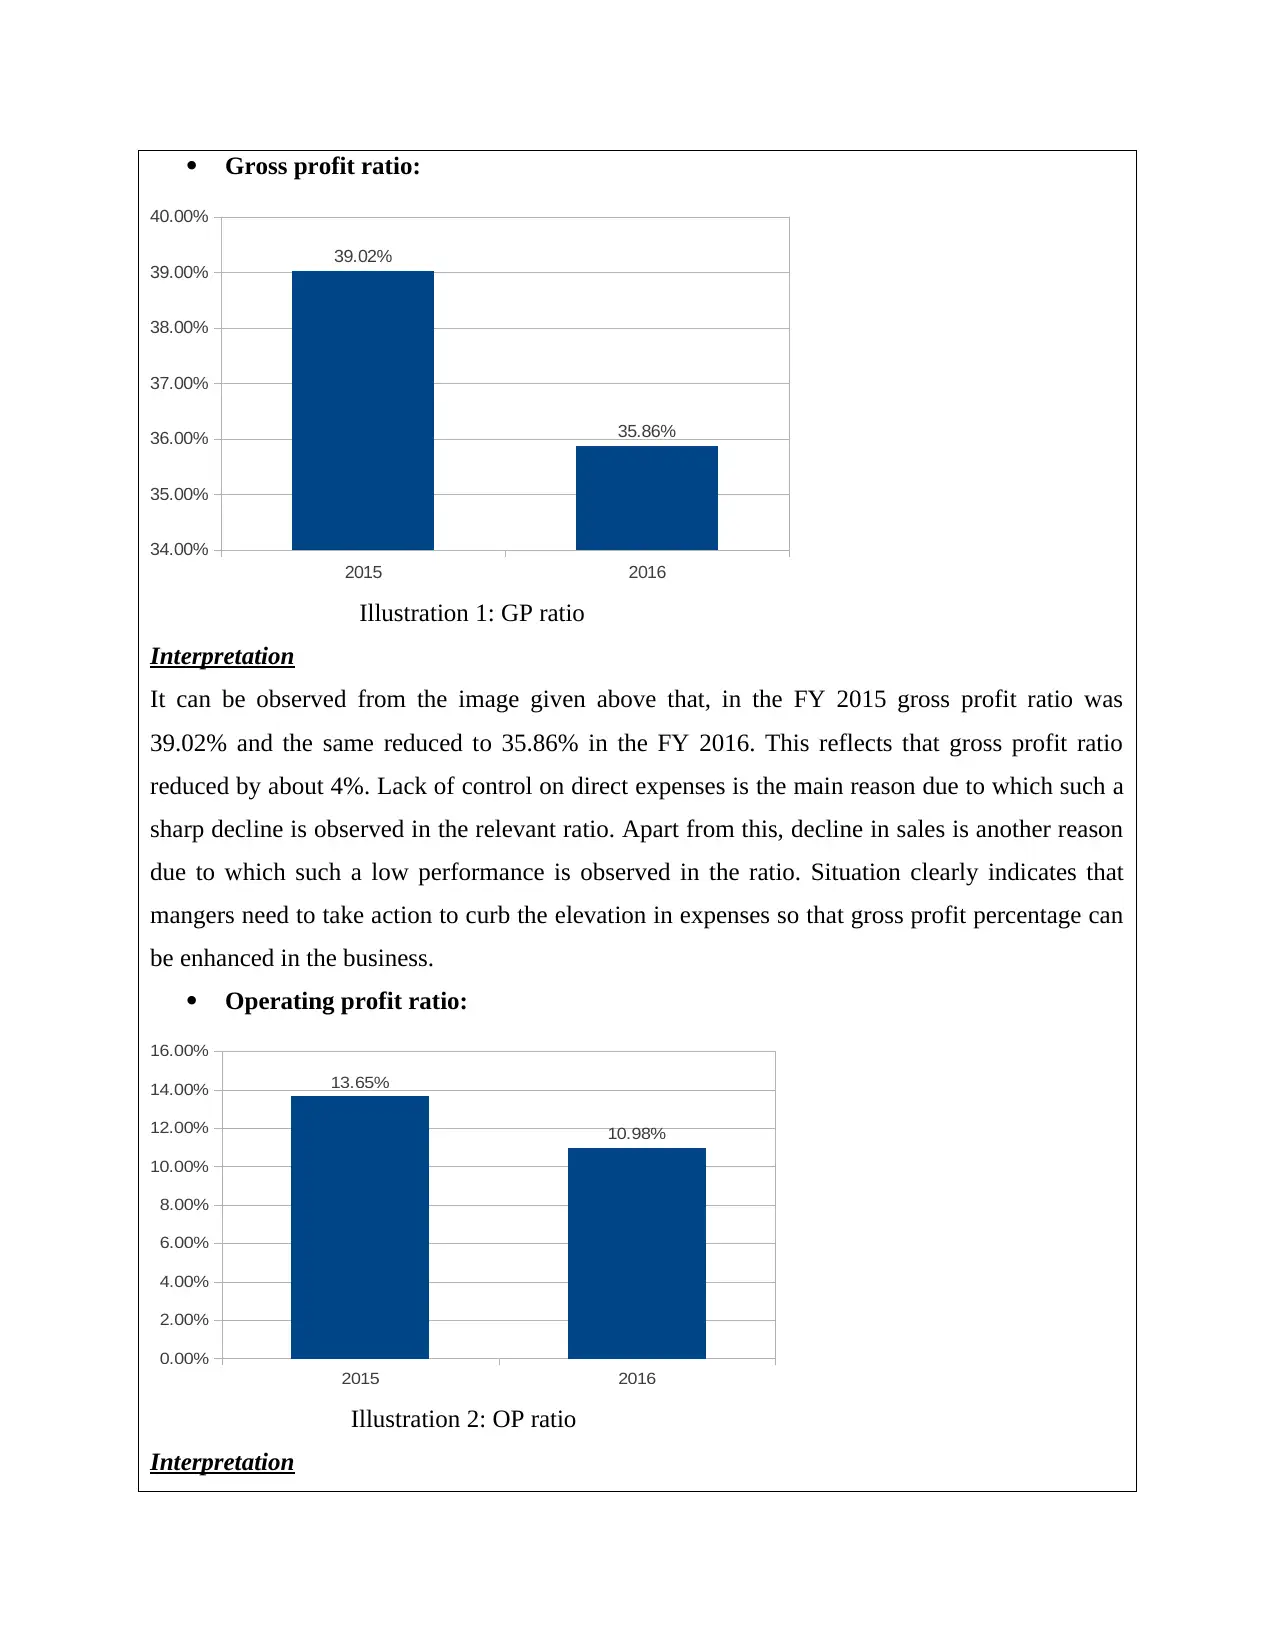
Gross profit ratio:
2015 2016
34.00%
35.00%
36.00%
37.00%
38.00%
39.00%
40.00%
39.02%
35.86%
Illustration 1: GP ratio
Interpretation
It can be observed from the image given above that, in the FY 2015 gross profit ratio was
39.02% and the same reduced to 35.86% in the FY 2016. This reflects that gross profit ratio
reduced by about 4%. Lack of control on direct expenses is the main reason due to which such a
sharp decline is observed in the relevant ratio. Apart from this, decline in sales is another reason
due to which such a low performance is observed in the ratio. Situation clearly indicates that
mangers need to take action to curb the elevation in expenses so that gross profit percentage can
be enhanced in the business.
Operating profit ratio:
2015 2016
0.00%
2.00%
4.00%
6.00%
8.00%
10.00%
12.00%
14.00%
16.00%
13.65%
10.98%
Illustration 2: OP ratio
Interpretation
2015 2016
34.00%
35.00%
36.00%
37.00%
38.00%
39.00%
40.00%
39.02%
35.86%
Illustration 1: GP ratio
Interpretation
It can be observed from the image given above that, in the FY 2015 gross profit ratio was
39.02% and the same reduced to 35.86% in the FY 2016. This reflects that gross profit ratio
reduced by about 4%. Lack of control on direct expenses is the main reason due to which such a
sharp decline is observed in the relevant ratio. Apart from this, decline in sales is another reason
due to which such a low performance is observed in the ratio. Situation clearly indicates that
mangers need to take action to curb the elevation in expenses so that gross profit percentage can
be enhanced in the business.
Operating profit ratio:
2015 2016
0.00%
2.00%
4.00%
6.00%
8.00%
10.00%
12.00%
14.00%
16.00%
13.65%
10.98%
Illustration 2: OP ratio
Interpretation
⊘ This is a preview!⊘
Do you want full access?
Subscribe today to unlock all pages.
Trusted by 1+ million students worldwide
Operating profit ratio has declined slightly by 2% in the current financial year. Operating profit
and sales valued reduced at the sharp rate and fast elevation in operating expenses led to decline
in ratio value by 2%. This reflects that there is a strong need to maintain control on sales and
administrative and other operating expenses in the business. By doing so, the operating profit can
be increased in the business and performance can be improved. Reduction in the operating profit
will lead to improvement in value of net profit in the business. Thus, it can be said that there is a
wide impact of value of the operating profit on the firm performance.
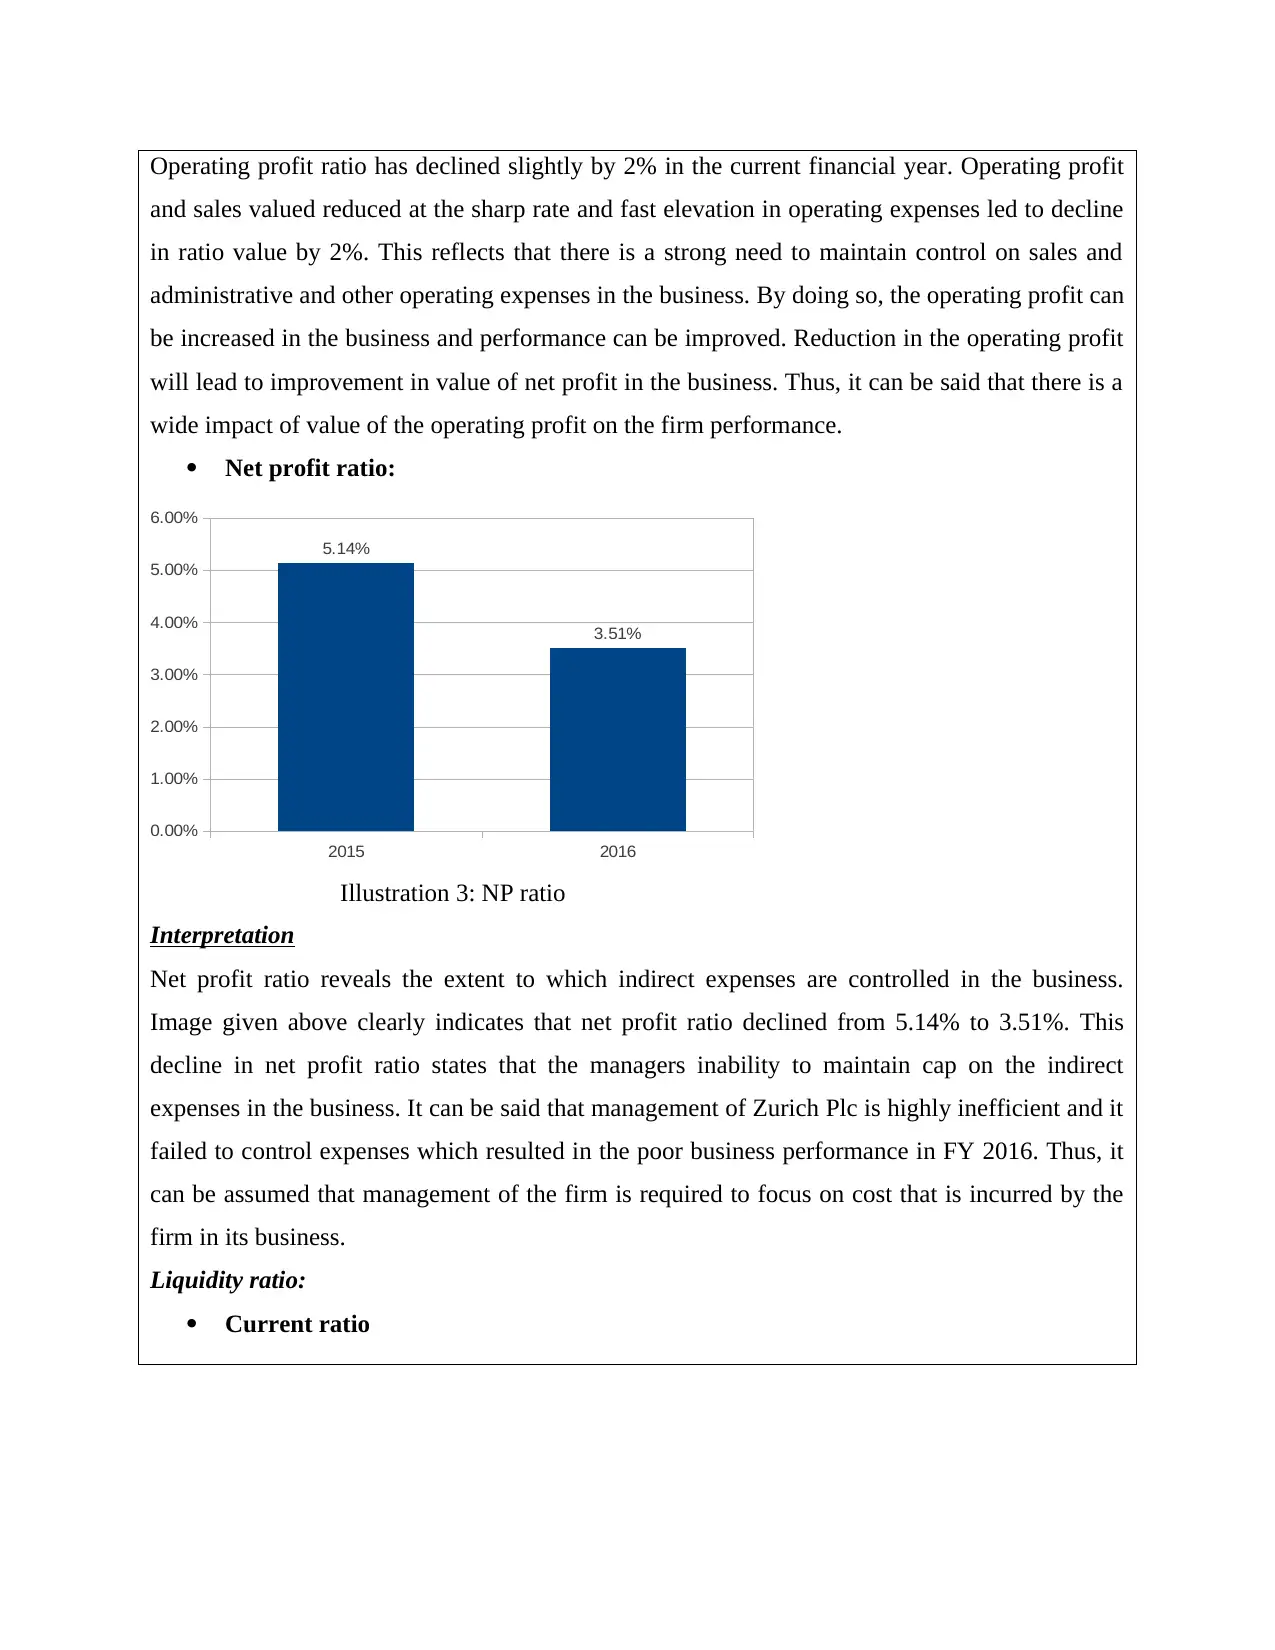
Net profit ratio:
2015 2016
0.00%
1.00%
2.00%
3.00%
4.00%
5.00%
6.00%
5.14%
3.51%
Illustration 3: NP ratio
Interpretation
Net profit ratio reveals the extent to which indirect expenses are controlled in the business.
Image given above clearly indicates that net profit ratio declined from 5.14% to 3.51%. This
decline in net profit ratio states that the managers inability to maintain cap on the indirect
expenses in the business. It can be said that management of Zurich Plc is highly inefficient and it
failed to control expenses which resulted in the poor business performance in FY 2016. Thus, it
can be assumed that management of the firm is required to focus on cost that is incurred by the
firm in its business.
Liquidity ratio:
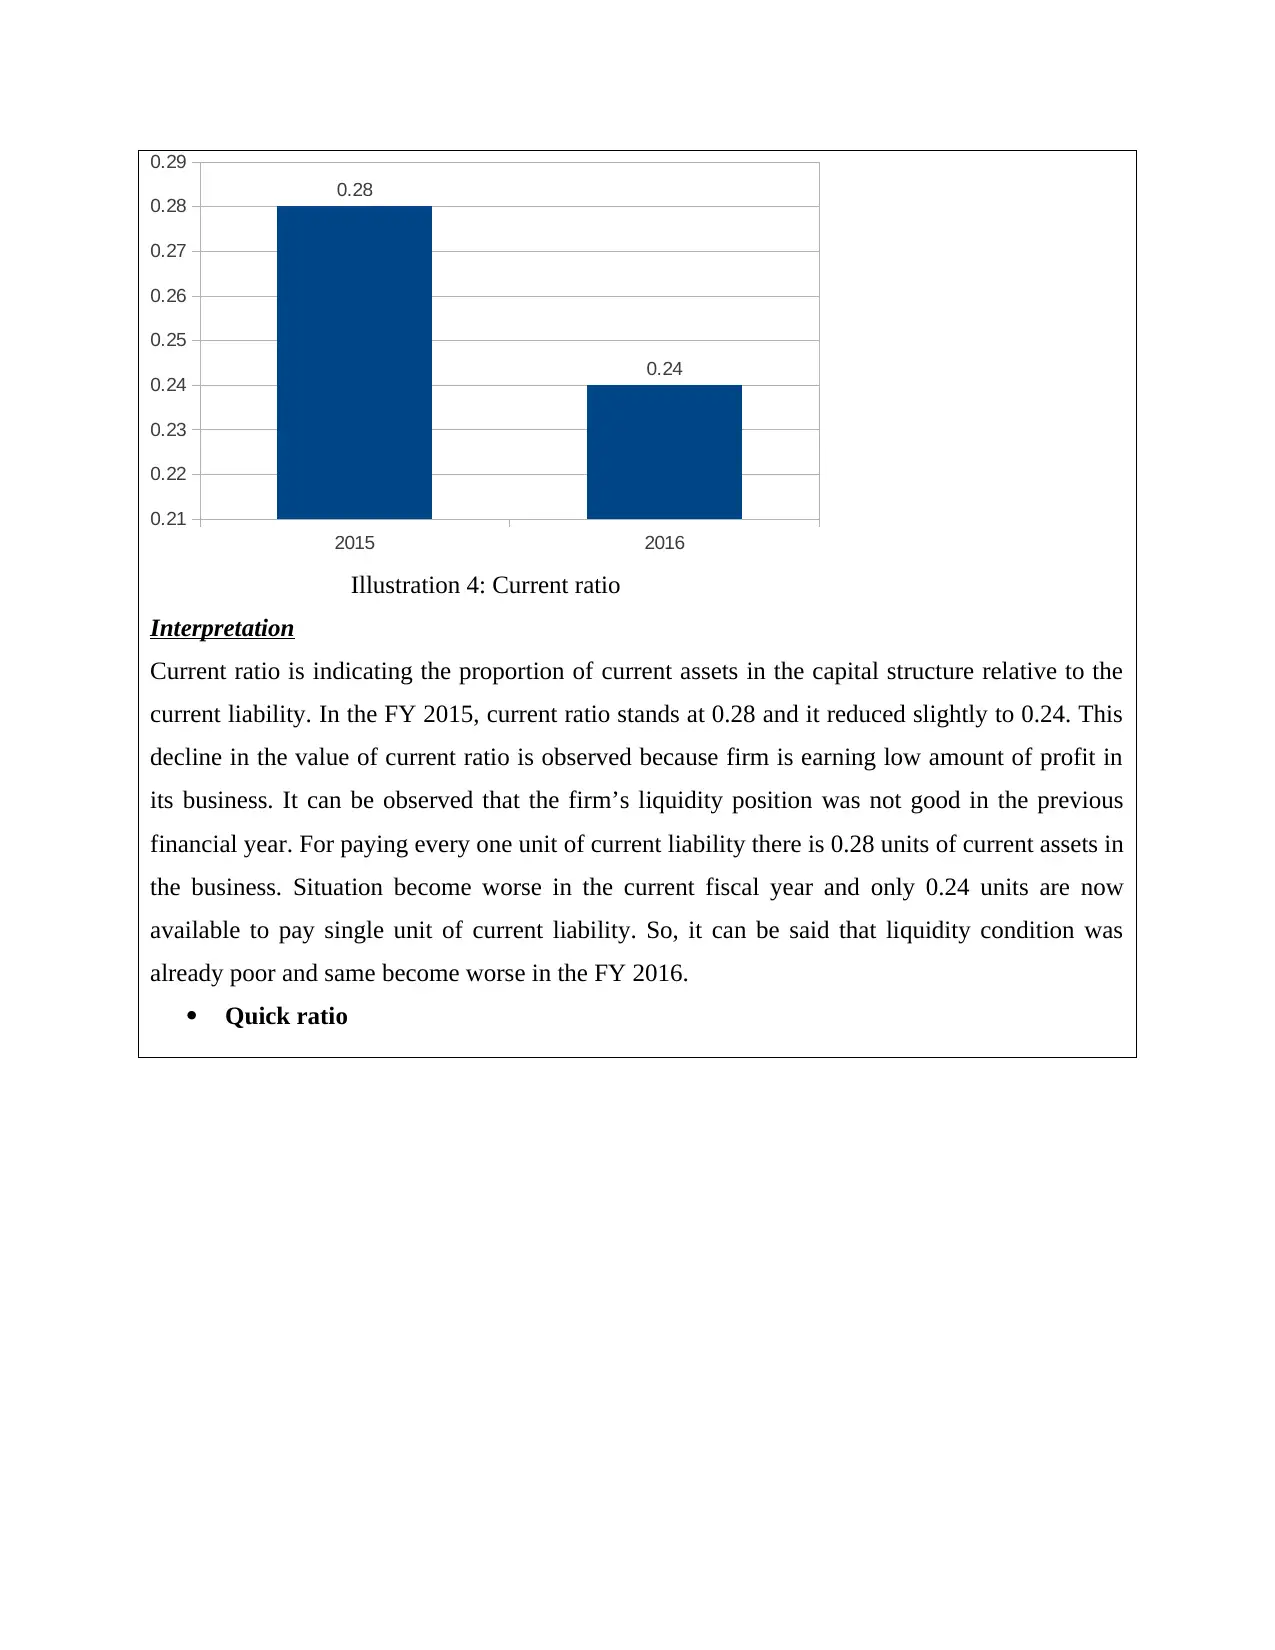
Current ratio
and sales valued reduced at the sharp rate and fast elevation in operating expenses led to decline
in ratio value by 2%. This reflects that there is a strong need to maintain control on sales and
administrative and other operating expenses in the business. By doing so, the operating profit can
be increased in the business and performance can be improved. Reduction in the operating profit
will lead to improvement in value of net profit in the business. Thus, it can be said that there is a
wide impact of value of the operating profit on the firm performance.
Net profit ratio:
2015 2016
0.00%
1.00%
2.00%
3.00%
4.00%
5.00%
6.00%
5.14%
3.51%
Illustration 3: NP ratio
Interpretation
Net profit ratio reveals the extent to which indirect expenses are controlled in the business.
Image given above clearly indicates that net profit ratio declined from 5.14% to 3.51%. This
decline in net profit ratio states that the managers inability to maintain cap on the indirect
expenses in the business. It can be said that management of Zurich Plc is highly inefficient and it
failed to control expenses which resulted in the poor business performance in FY 2016. Thus, it
can be assumed that management of the firm is required to focus on cost that is incurred by the
firm in its business.
Liquidity ratio:
Current ratio
Paraphrase This Document
Need a fresh take? Get an instant paraphrase of this document with our AI Paraphraser
2015 2016
0.21
0.22
0.23
0.24
0.25
0.26
0.27
0.28
0.29
0.28
0.24
Illustration 4: Current ratio
Interpretation
Current ratio is indicating the proportion of current assets in the capital structure relative to the
current liability. In the FY 2015, current ratio stands at 0.28 and it reduced slightly to 0.24. This
decline in the value of current ratio is observed because firm is earning low amount of profit in
its business. It can be observed that the firm’s liquidity position was not good in the previous
financial year. For paying every one unit of current liability there is 0.28 units of current assets in
the business. Situation become worse in the current fiscal year and only 0.24 units are now
available to pay single unit of current liability. So, it can be said that liquidity condition was
already poor and same become worse in the FY 2016.
Quick ratio
0.21
0.22
0.23
0.24
0.25
0.26
0.27
0.28
0.29
0.28
0.24
Illustration 4: Current ratio
Interpretation
Current ratio is indicating the proportion of current assets in the capital structure relative to the
current liability. In the FY 2015, current ratio stands at 0.28 and it reduced slightly to 0.24. This
decline in the value of current ratio is observed because firm is earning low amount of profit in
its business. It can be observed that the firm’s liquidity position was not good in the previous
financial year. For paying every one unit of current liability there is 0.28 units of current assets in
the business. Situation become worse in the current fiscal year and only 0.24 units are now
available to pay single unit of current liability. So, it can be said that liquidity condition was
already poor and same become worse in the FY 2016.
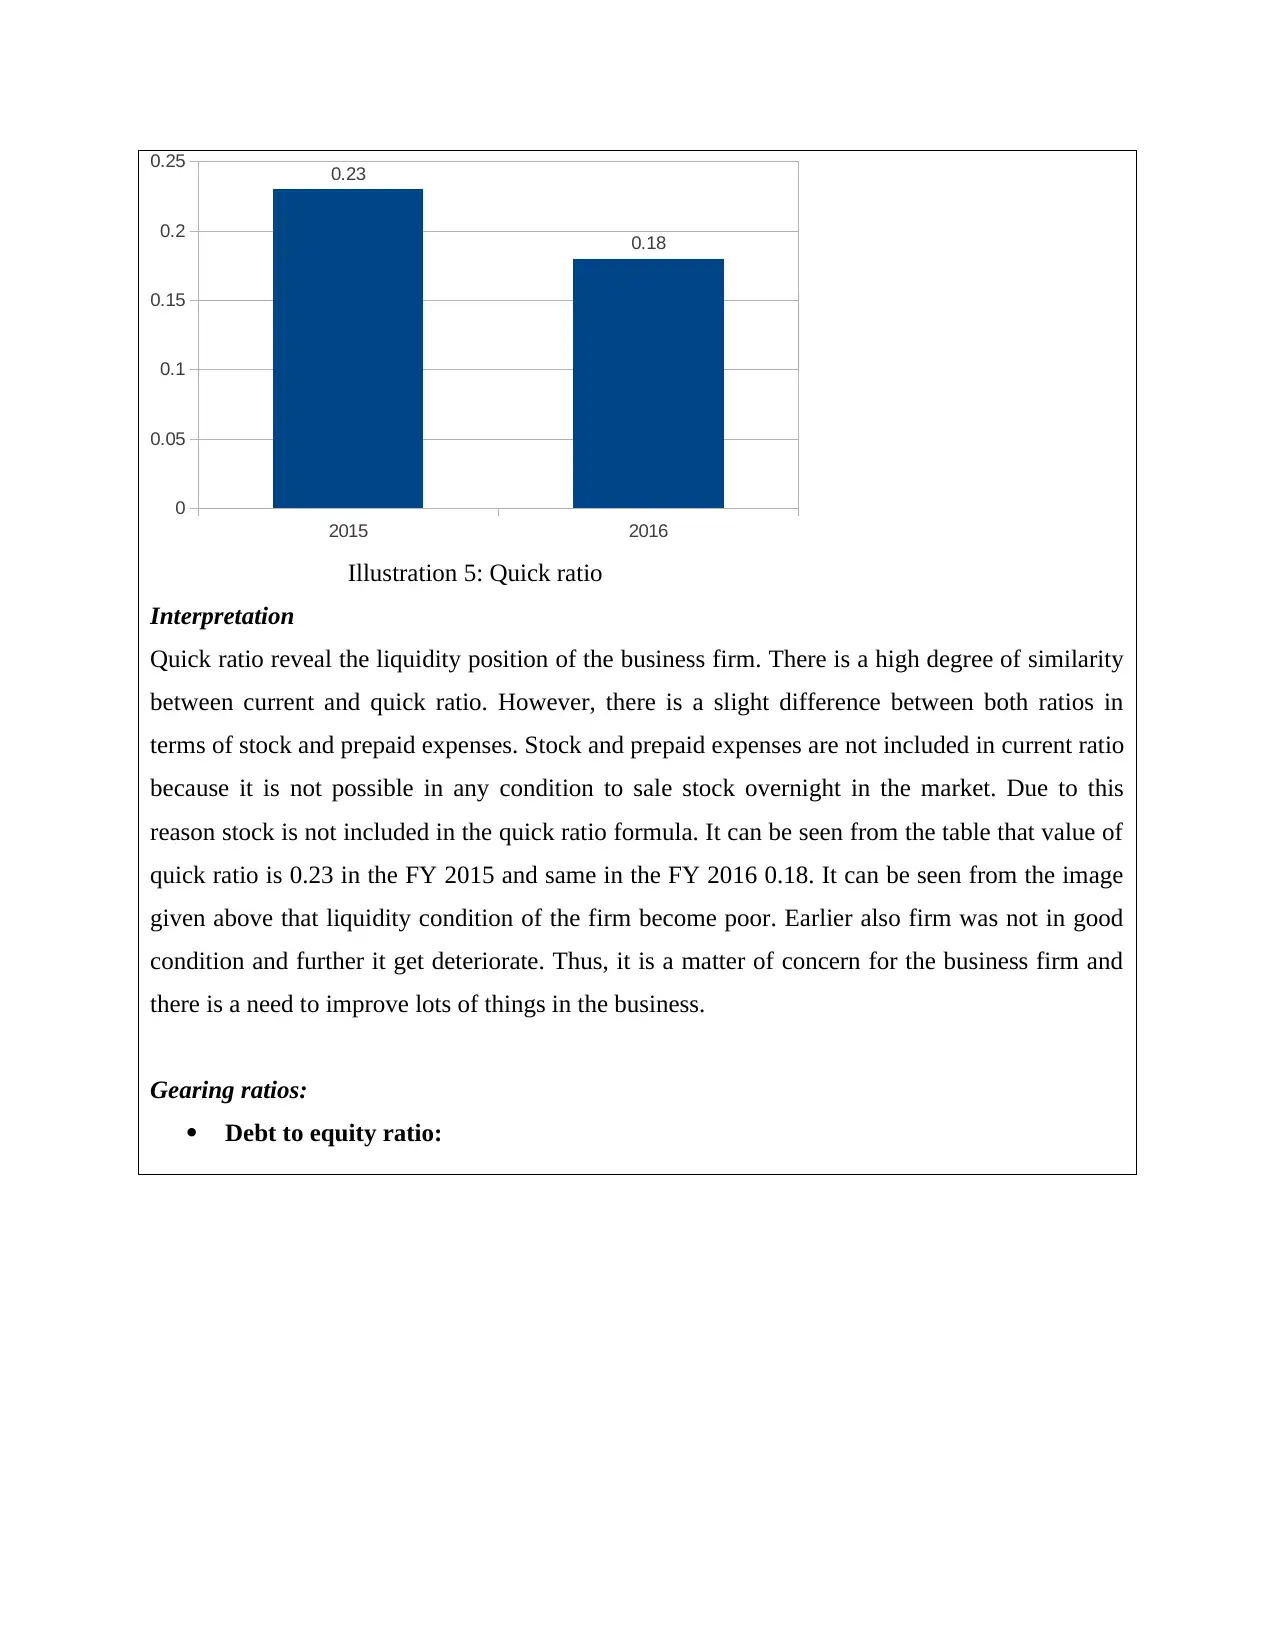
Quick ratio
2015 2016
0
0.05
0.1
0.15
0.2
0.25 0.23
0.18
Illustration 5: Quick ratio
Interpretation
Quick ratio reveal the liquidity position of the business firm. There is a high degree of similarity
between current and quick ratio. However, there is a slight difference between both ratios in
terms of stock and prepaid expenses. Stock and prepaid expenses are not included in current ratio
because it is not possible in any condition to sale stock overnight in the market. Due to this
reason stock is not included in the quick ratio formula. It can be seen from the table that value of
quick ratio is 0.23 in the FY 2015 and same in the FY 2016 0.18. It can be seen from the image
given above that liquidity condition of the firm become poor. Earlier also firm was not in good
condition and further it get deteriorate. Thus, it is a matter of concern for the business firm and
there is a need to improve lots of things in the business.
Gearing ratios:
Debt to equity ratio:
⊘ This is a preview!⊘
Do you want full access?
Subscribe today to unlock all pages.
Trusted by 1+ million students worldwide
2015 2016
0
0.02
0.04
0.06
0.08
0.1
0.12
0.14
0.16
0.18
0.2
0.11
0.18
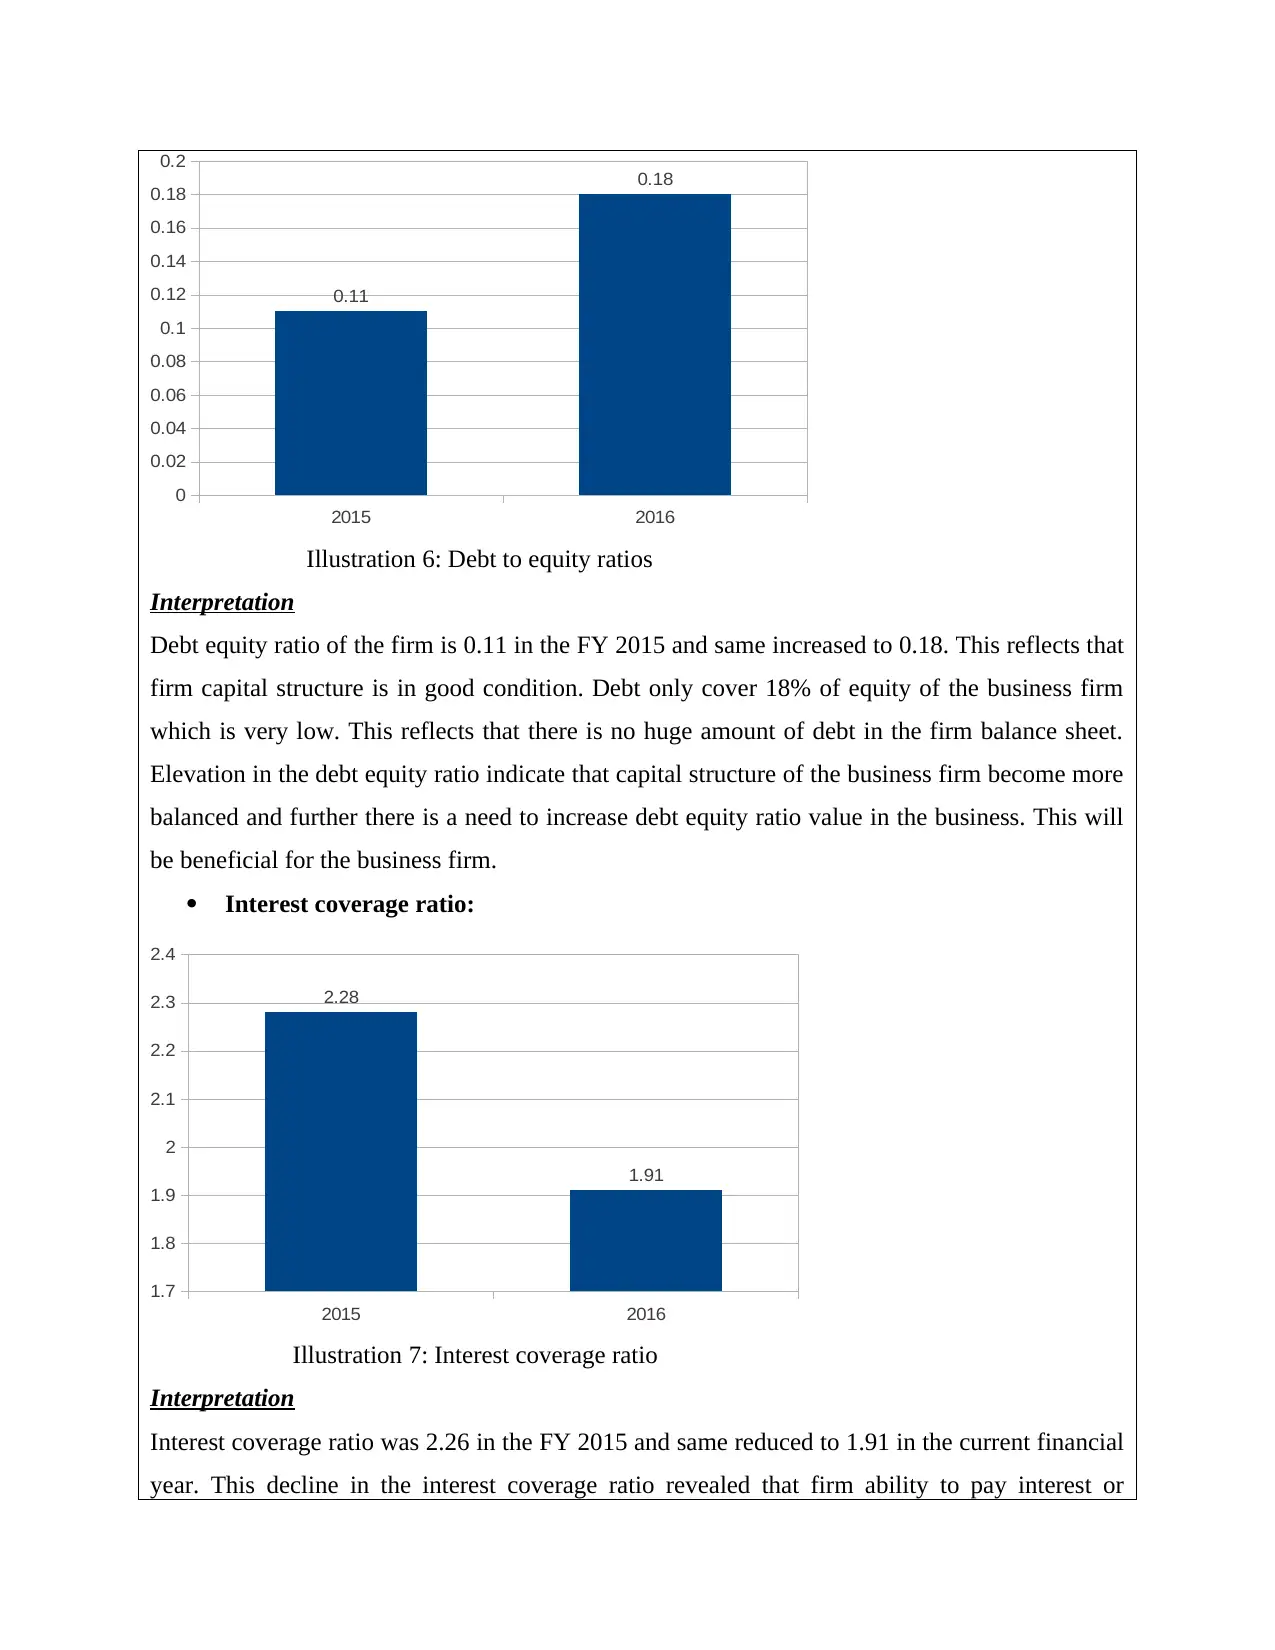
Illustration 6: Debt to equity ratios
Interpretation
Debt equity ratio of the firm is 0.11 in the FY 2015 and same increased to 0.18. This reflects that
firm capital structure is in good condition. Debt only cover 18% of equity of the business firm
which is very low. This reflects that there is no huge amount of debt in the firm balance sheet.
Elevation in the debt equity ratio indicate that capital structure of the business firm become more
balanced and further there is a need to increase debt equity ratio value in the business. This will
be beneficial for the business firm.
Interest coverage ratio:
2015 2016
1.7
1.8
1.9
2
2.1
2.2
2.3
2.4
2.28
1.91
Illustration 7: Interest coverage ratio
Interpretation
Interest coverage ratio was 2.26 in the FY 2015 and same reduced to 1.91 in the current financial
year. This decline in the interest coverage ratio revealed that firm ability to pay interest or
0
0.02
0.04
0.06
0.08
0.1
0.12
0.14
0.16
0.18
0.2
0.11
0.18
Illustration 6: Debt to equity ratios
Interpretation
Debt equity ratio of the firm is 0.11 in the FY 2015 and same increased to 0.18. This reflects that
firm capital structure is in good condition. Debt only cover 18% of equity of the business firm
which is very low. This reflects that there is no huge amount of debt in the firm balance sheet.
Elevation in the debt equity ratio indicate that capital structure of the business firm become more
balanced and further there is a need to increase debt equity ratio value in the business. This will
be beneficial for the business firm.
Interest coverage ratio:
2015 2016
1.7
1.8
1.9
2
2.1
2.2
2.3
2.4
2.28
1.91
Illustration 7: Interest coverage ratio
Interpretation
Interest coverage ratio was 2.26 in the FY 2015 and same reduced to 1.91 in the current financial
year. This decline in the interest coverage ratio revealed that firm ability to pay interest or
Paraphrase This Document
Need a fresh take? Get an instant paraphrase of this document with our AI Paraphraser
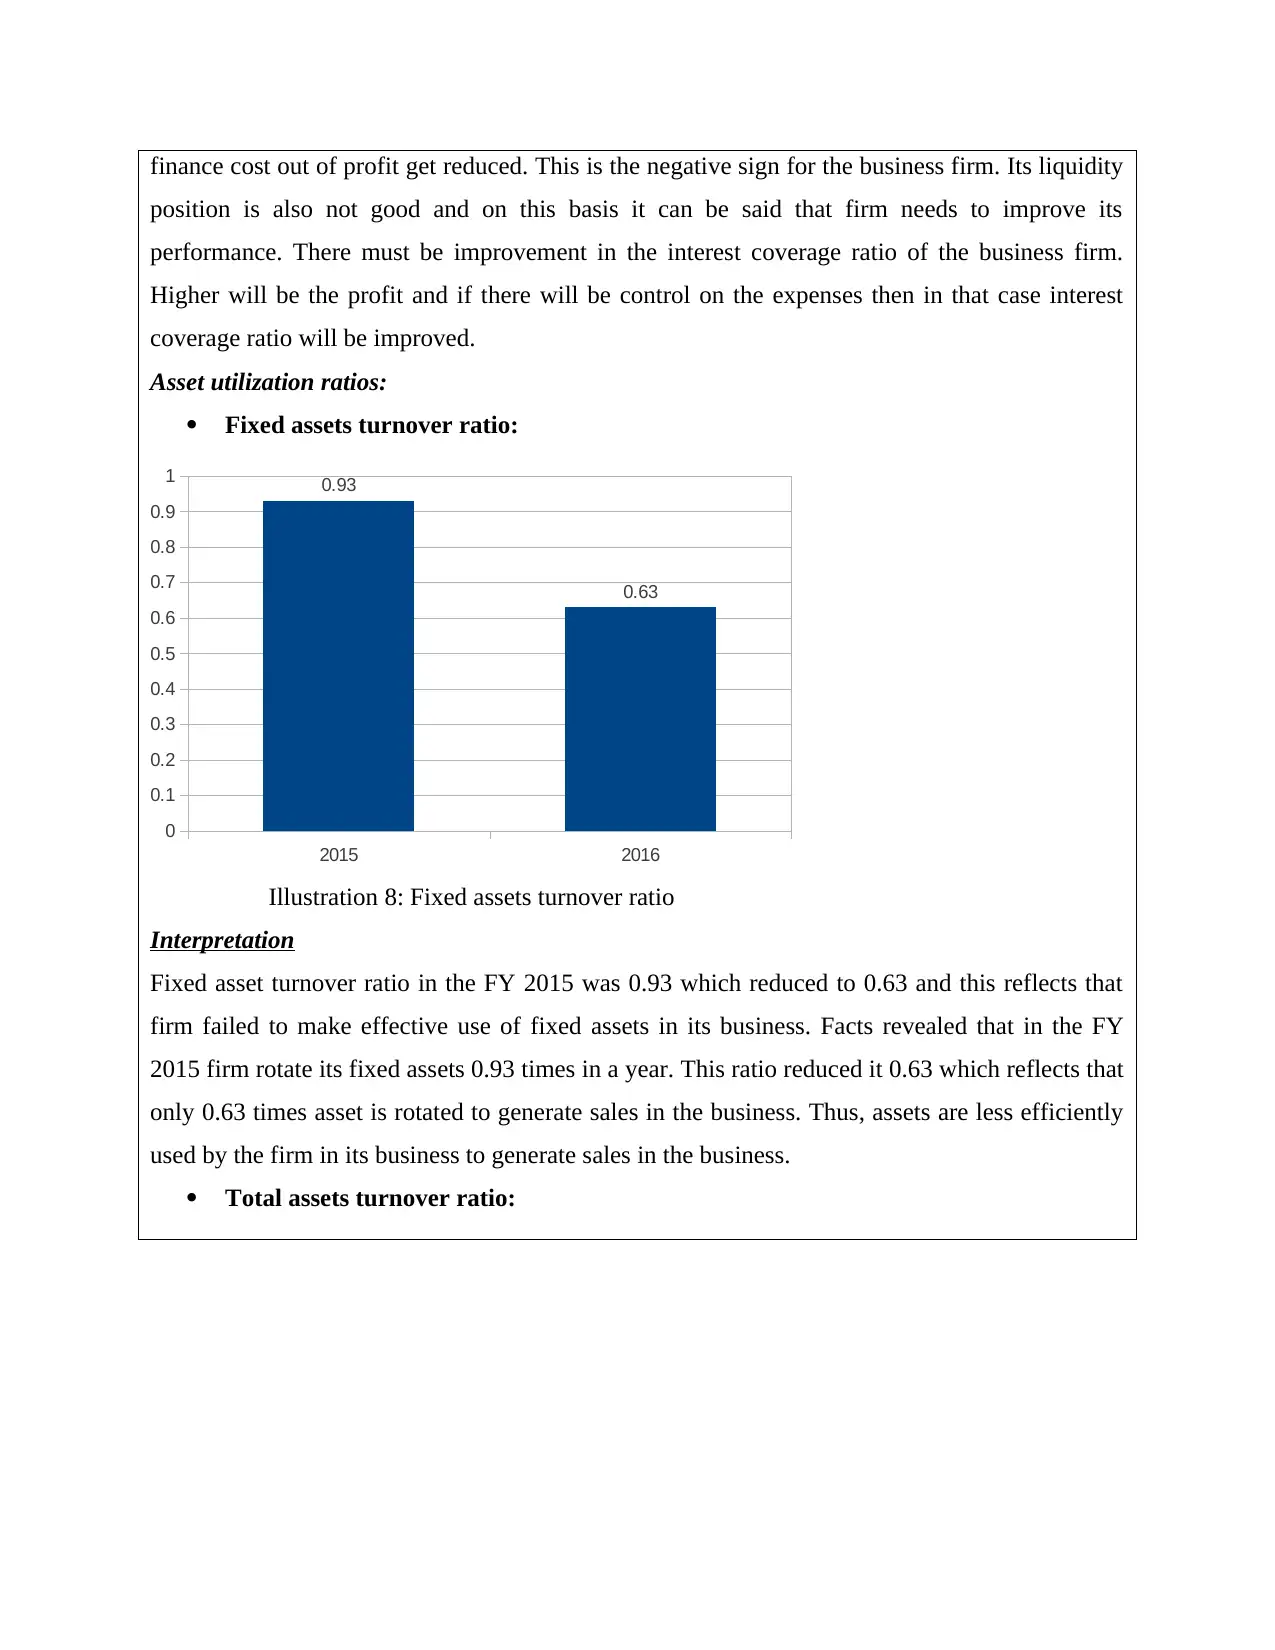
finance cost out of profit get reduced. This is the negative sign for the business firm. Its liquidity
position is also not good and on this basis it can be said that firm needs to improve its
performance. There must be improvement in the interest coverage ratio of the business firm.
Higher will be the profit and if there will be control on the expenses then in that case interest
coverage ratio will be improved.
Asset utilization ratios:
Fixed assets turnover ratio:
2015 2016
0
0.1
0.2
0.3
0.4
0.5
0.6
0.7
0.8
0.9
1 0.93
0.63
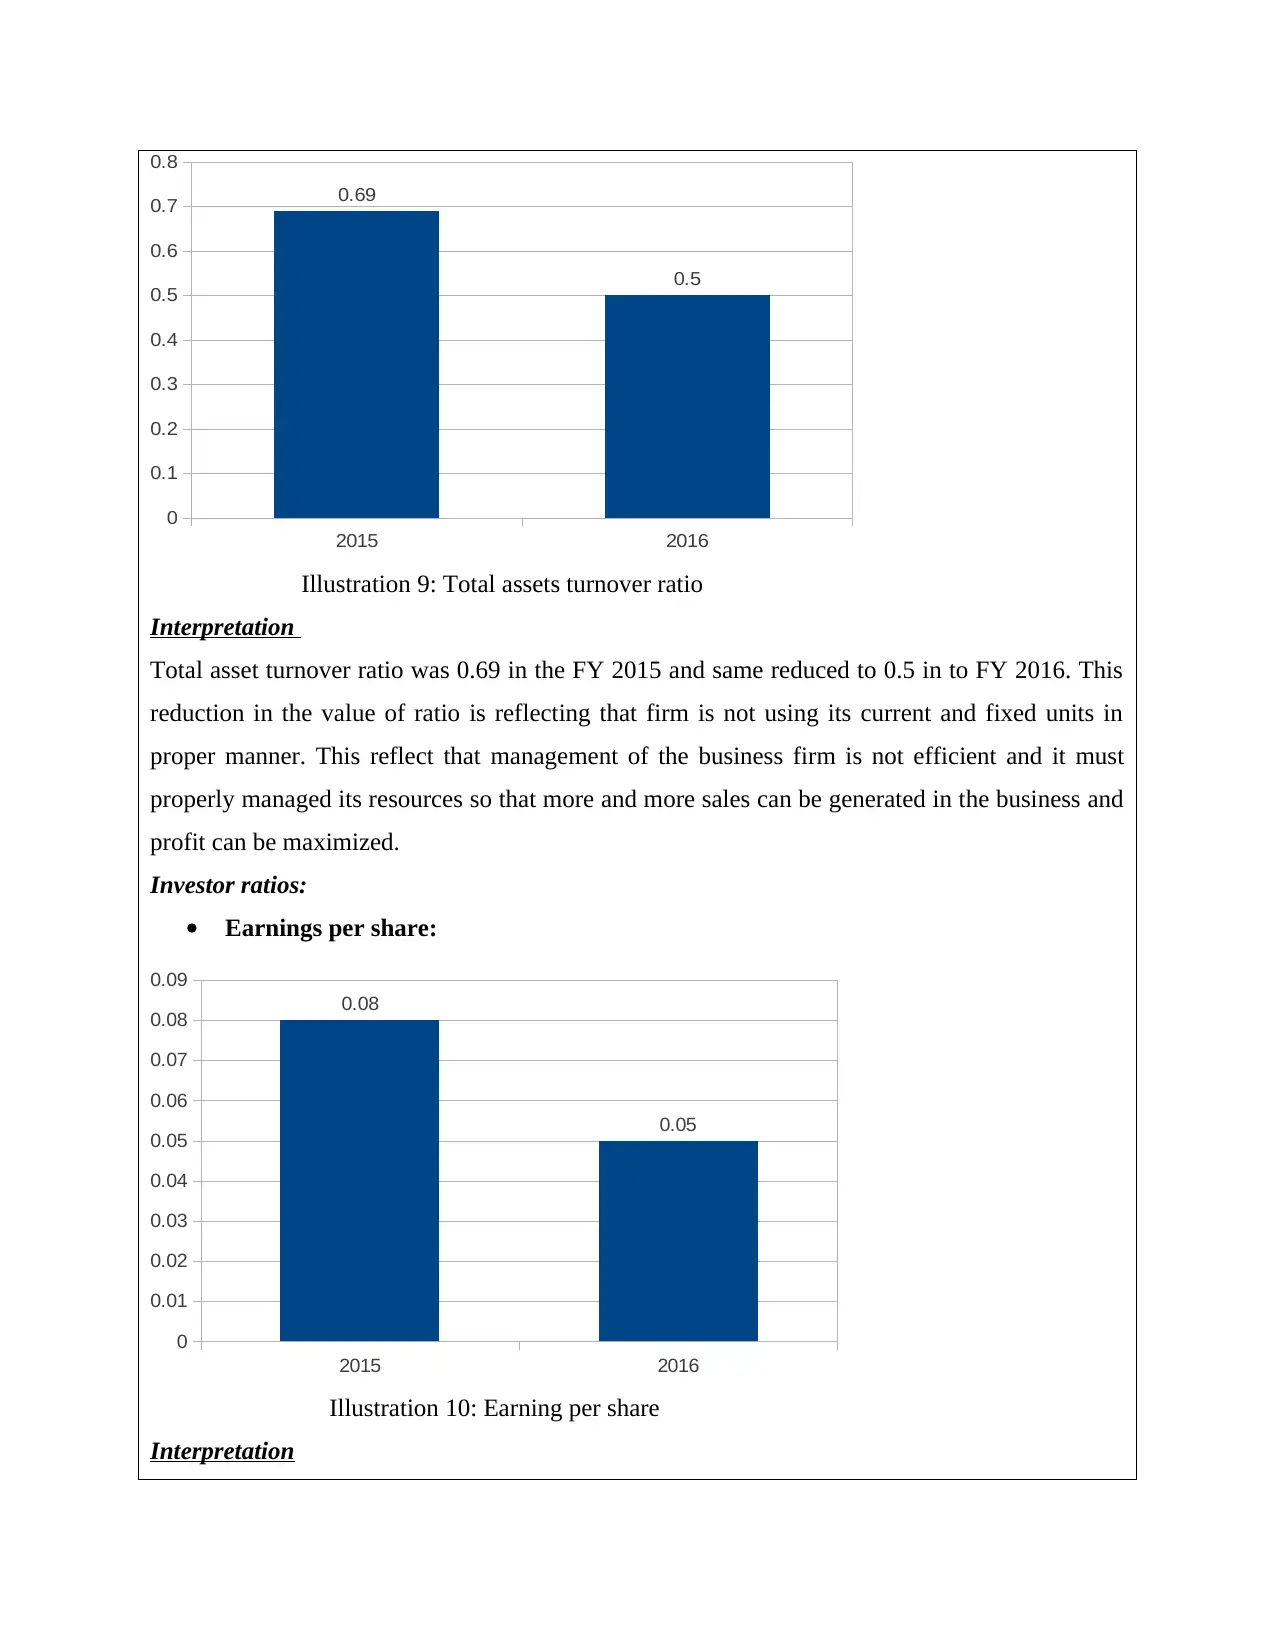
Illustration 8: Fixed assets turnover ratio
Interpretation
Fixed asset turnover ratio in the FY 2015 was 0.93 which reduced to 0.63 and this reflects that
firm failed to make effective use of fixed assets in its business. Facts revealed that in the FY
2015 firm rotate its fixed assets 0.93 times in a year. This ratio reduced it 0.63 which reflects that
only 0.63 times asset is rotated to generate sales in the business. Thus, assets are less efficiently
used by the firm in its business to generate sales in the business.
Total assets turnover ratio:
position is also not good and on this basis it can be said that firm needs to improve its
performance. There must be improvement in the interest coverage ratio of the business firm.
Higher will be the profit and if there will be control on the expenses then in that case interest
coverage ratio will be improved.
Asset utilization ratios:
Fixed assets turnover ratio:
2015 2016
0
0.1
0.2
0.3
0.4
0.5
0.6
0.7
0.8
0.9
1 0.93
0.63
Illustration 8: Fixed assets turnover ratio
Interpretation
Fixed asset turnover ratio in the FY 2015 was 0.93 which reduced to 0.63 and this reflects that
firm failed to make effective use of fixed assets in its business. Facts revealed that in the FY
2015 firm rotate its fixed assets 0.93 times in a year. This ratio reduced it 0.63 which reflects that
only 0.63 times asset is rotated to generate sales in the business. Thus, assets are less efficiently
used by the firm in its business to generate sales in the business.
Total assets turnover ratio:
2015 2016
0
0.1
0.2
0.3
0.4
0.5
0.6
0.7
0.8
0.69
0.5
Illustration 9: Total assets turnover ratio
Interpretation
Total asset turnover ratio was 0.69 in the FY 2015 and same reduced to 0.5 in to FY 2016. This
reduction in the value of ratio is reflecting that firm is not using its current and fixed units in
proper manner. This reflect that management of the business firm is not efficient and it must
properly managed its resources so that more and more sales can be generated in the business and
profit can be maximized.
Investor ratios:
Earnings per share:
2015 2016
0
0.01
0.02
0.03
0.04
0.05
0.06
0.07
0.08
0.09
0.08
0.05
Illustration 10: Earning per share
Interpretation
0
0.1
0.2
0.3
0.4
0.5
0.6
0.7
0.8
0.69
0.5
Illustration 9: Total assets turnover ratio
Interpretation
Total asset turnover ratio was 0.69 in the FY 2015 and same reduced to 0.5 in to FY 2016. This
reduction in the value of ratio is reflecting that firm is not using its current and fixed units in
proper manner. This reflect that management of the business firm is not efficient and it must
properly managed its resources so that more and more sales can be generated in the business and
profit can be maximized.
Investor ratios:
Earnings per share:
2015 2016
0
0.01
0.02
0.03
0.04
0.05
0.06
0.07
0.08
0.09
0.08
0.05
Illustration 10: Earning per share
Interpretation
⊘ This is a preview!⊘
Do you want full access?
Subscribe today to unlock all pages.
Trusted by 1+ million students worldwide
1 out of 21
Related Documents


Your All-in-One AI-Powered Toolkit for Academic Success.
+13062052269
info@desklib.com
Available 24*7 on WhatsApp / Email
![[object Object]](/_next/static/media/star-bottom.7253800d.svg)
Unlock your academic potential
Copyright © 2020–2026 A2Z Services. All Rights Reserved. Developed and managed by ZUCOL.