Finance Report: Financial Analysis of Mission NewEnergy Limited (ASX)
VerifiedAdded on 2020/05/16
|10
|2700
|129
Report
AI Summary
This report presents a comprehensive financial analysis of Mission NewEnergy Limited, a renewable energy company listed on the ASX. The analysis evaluates the company's financial performance using various metrics, including ROA, ROE, WACC, and debt ratio, based on data from 2014 to 2017. The report examines ownership structure, key governance personnel, and share price movements, comparing them with market indices. It delves into the company's announcements, including agreements and acquisitions. The report calculates the weighted average cost of capital (WACC) and debt ratio, assesses the dividend policy, and provides an investment recommendation. The analysis reveals that the company has experienced fluctuations and losses, leading to a recommendation against investment, considering its current stage of winding up.
Running Head: Finance
Analysis of financial performance
Analysis of financial performance
Paraphrase This Document
Need a fresh take? Get an instant paraphrase of this document with our AI Paraphraser
Finance 1
Contents
Introduction................................................................................................................................2
Company’s Description..............................................................................................................2
Ownership and Governance Structure.......................................................................................2
Substantial holders..................................................................................................................2
Main people involved in governance.....................................................................................2
Key ratios...................................................................................................................................2
Share price movements..............................................................................................................4
Announcements..........................................................................................................................6
Stock Details..............................................................................................................................6
Weighted Average Cost of Capital............................................................................................7
Analysis of Debt ratio................................................................................................................7
Dividend policy..........................................................................................................................7
Recommendation letter..............................................................................................................8
Finance 2
Introduction
The overall analysis of company’s financial performance is known as financial analysis. It is
very important for the investors to conduct such analysis in order to have an idea about
company’s financial position and to decide whether to invest in such company or not. This
report contains a whole financial analysis of Mission NewEnergy Limited, listed on ASX. In
the analysis, various factors like dividend policy, ROE, ROA, WACC and debt ratio are
considered to measure the financial position of the company. The objective of this report is to
provide recommendations to the investor regarding its investment in this company.
Company’s Description
Mission NewEnergy Limited is a renewable energy company based in Australia. The
company is listed on Australian Securities Exchange. It has biodiesel plant which operates in
Malaysia and its segments include Biodiesel Refining and Corporate. Mission NewEnergy
owns an interest in a biodiesel refinery in Malaysia and its subsidiaries are Mission Biofuels
Sdn Bhd and M2 Capital Sdn Bhd. The strategy of the company is to become one of the
lowest cost producers of biodiesel in the world (Missionnewenergy.com, 2018).
Ownership and Governance Structure
Substantial holders
More than 5% shareholdings:
Nathan Mahalingam 13.7%
Guy Burnett 12.5%
James Garton 12.5%
KajaintharanSithambaran 12.2%
MuralidharMenon 12.2%
MohdAzlan bin Mohammed 12.2%
Main people involved in governance
Chairman and CEO: Nathan Mahalingam(Missionnewenergy.com, 2018).
Board members: Nathan Mahalingam (Chief Executive Officer), Guy Burnett: Chief
financial Officer (Executive), James Garton: Head of Corporate Finance (Executive).
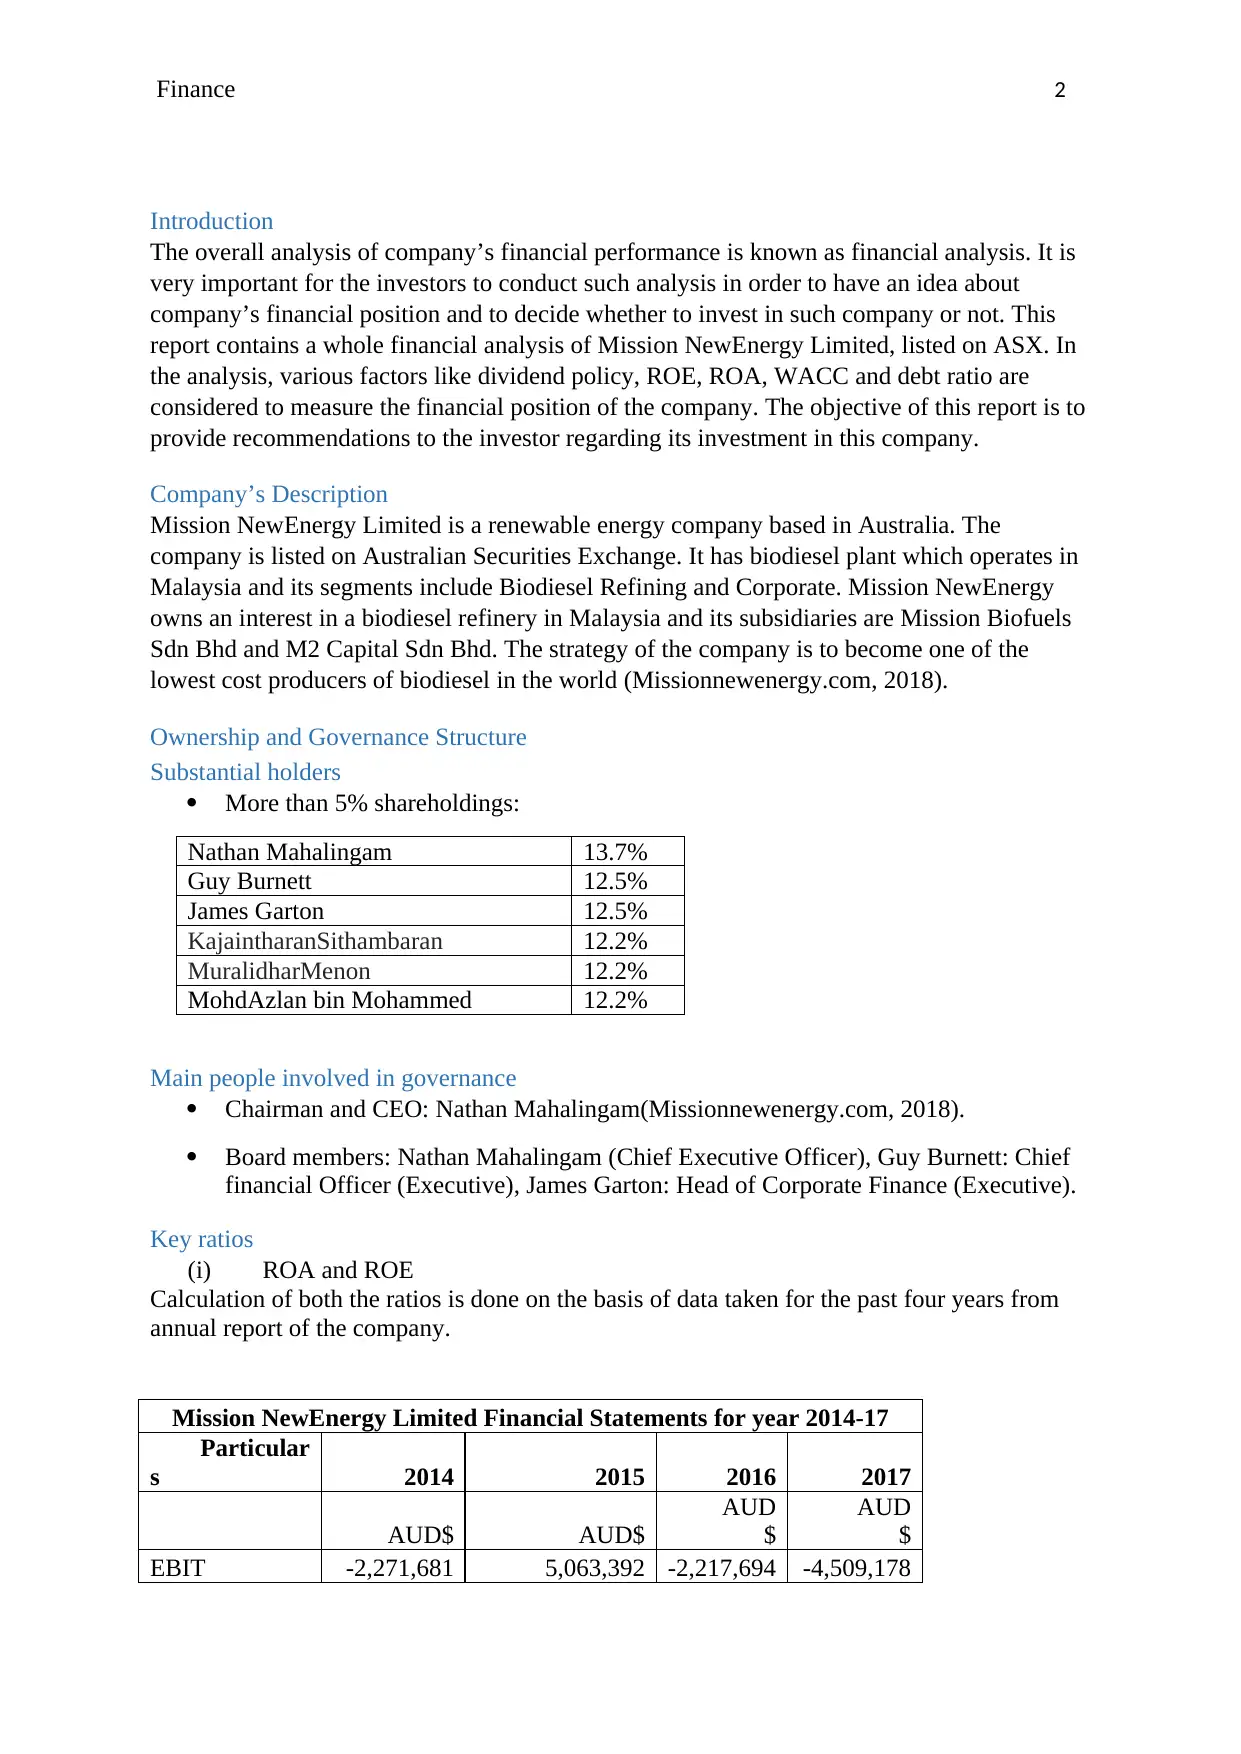
Key ratios
(i) ROA and ROE
Calculation of both the ratios is done on the basis of data taken for the past four years from
annual report of the company.
Mission NewEnergy Limited Financial Statements for year 2014-17
Particular
s 2014 2015 2016 2017
AUD$ AUD$
AUD
$
AUD
$
EBIT -2,271,681 5,063,392 -2,217,694 -4,509,178
Introduction
The overall analysis of company’s financial performance is known as financial analysis. It is
very important for the investors to conduct such analysis in order to have an idea about
company’s financial position and to decide whether to invest in such company or not. This
report contains a whole financial analysis of Mission NewEnergy Limited, listed on ASX. In
the analysis, various factors like dividend policy, ROE, ROA, WACC and debt ratio are
considered to measure the financial position of the company. The objective of this report is to
provide recommendations to the investor regarding its investment in this company.
Company’s Description
Mission NewEnergy Limited is a renewable energy company based in Australia. The
company is listed on Australian Securities Exchange. It has biodiesel plant which operates in
Malaysia and its segments include Biodiesel Refining and Corporate. Mission NewEnergy
owns an interest in a biodiesel refinery in Malaysia and its subsidiaries are Mission Biofuels
Sdn Bhd and M2 Capital Sdn Bhd. The strategy of the company is to become one of the
lowest cost producers of biodiesel in the world (Missionnewenergy.com, 2018).
Ownership and Governance Structure
Substantial holders
More than 5% shareholdings:
Nathan Mahalingam 13.7%
Guy Burnett 12.5%
James Garton 12.5%
KajaintharanSithambaran 12.2%
MuralidharMenon 12.2%
MohdAzlan bin Mohammed 12.2%
Main people involved in governance
Chairman and CEO: Nathan Mahalingam(Missionnewenergy.com, 2018).
Board members: Nathan Mahalingam (Chief Executive Officer), Guy Burnett: Chief
financial Officer (Executive), James Garton: Head of Corporate Finance (Executive).
Key ratios
(i) ROA and ROE
Calculation of both the ratios is done on the basis of data taken for the past four years from
annual report of the company.
Mission NewEnergy Limited Financial Statements for year 2014-17
Particular
s 2014 2015 2016 2017
AUD$ AUD$
AUD
$
AUD
$
EBIT -2,271,681 5,063,392 -2,217,694 -4,509,178
⊘ This is a preview!⊘
Do you want full access?
Subscribe today to unlock all pages.
Trusted by 1+ million students worldwide
Finance 3
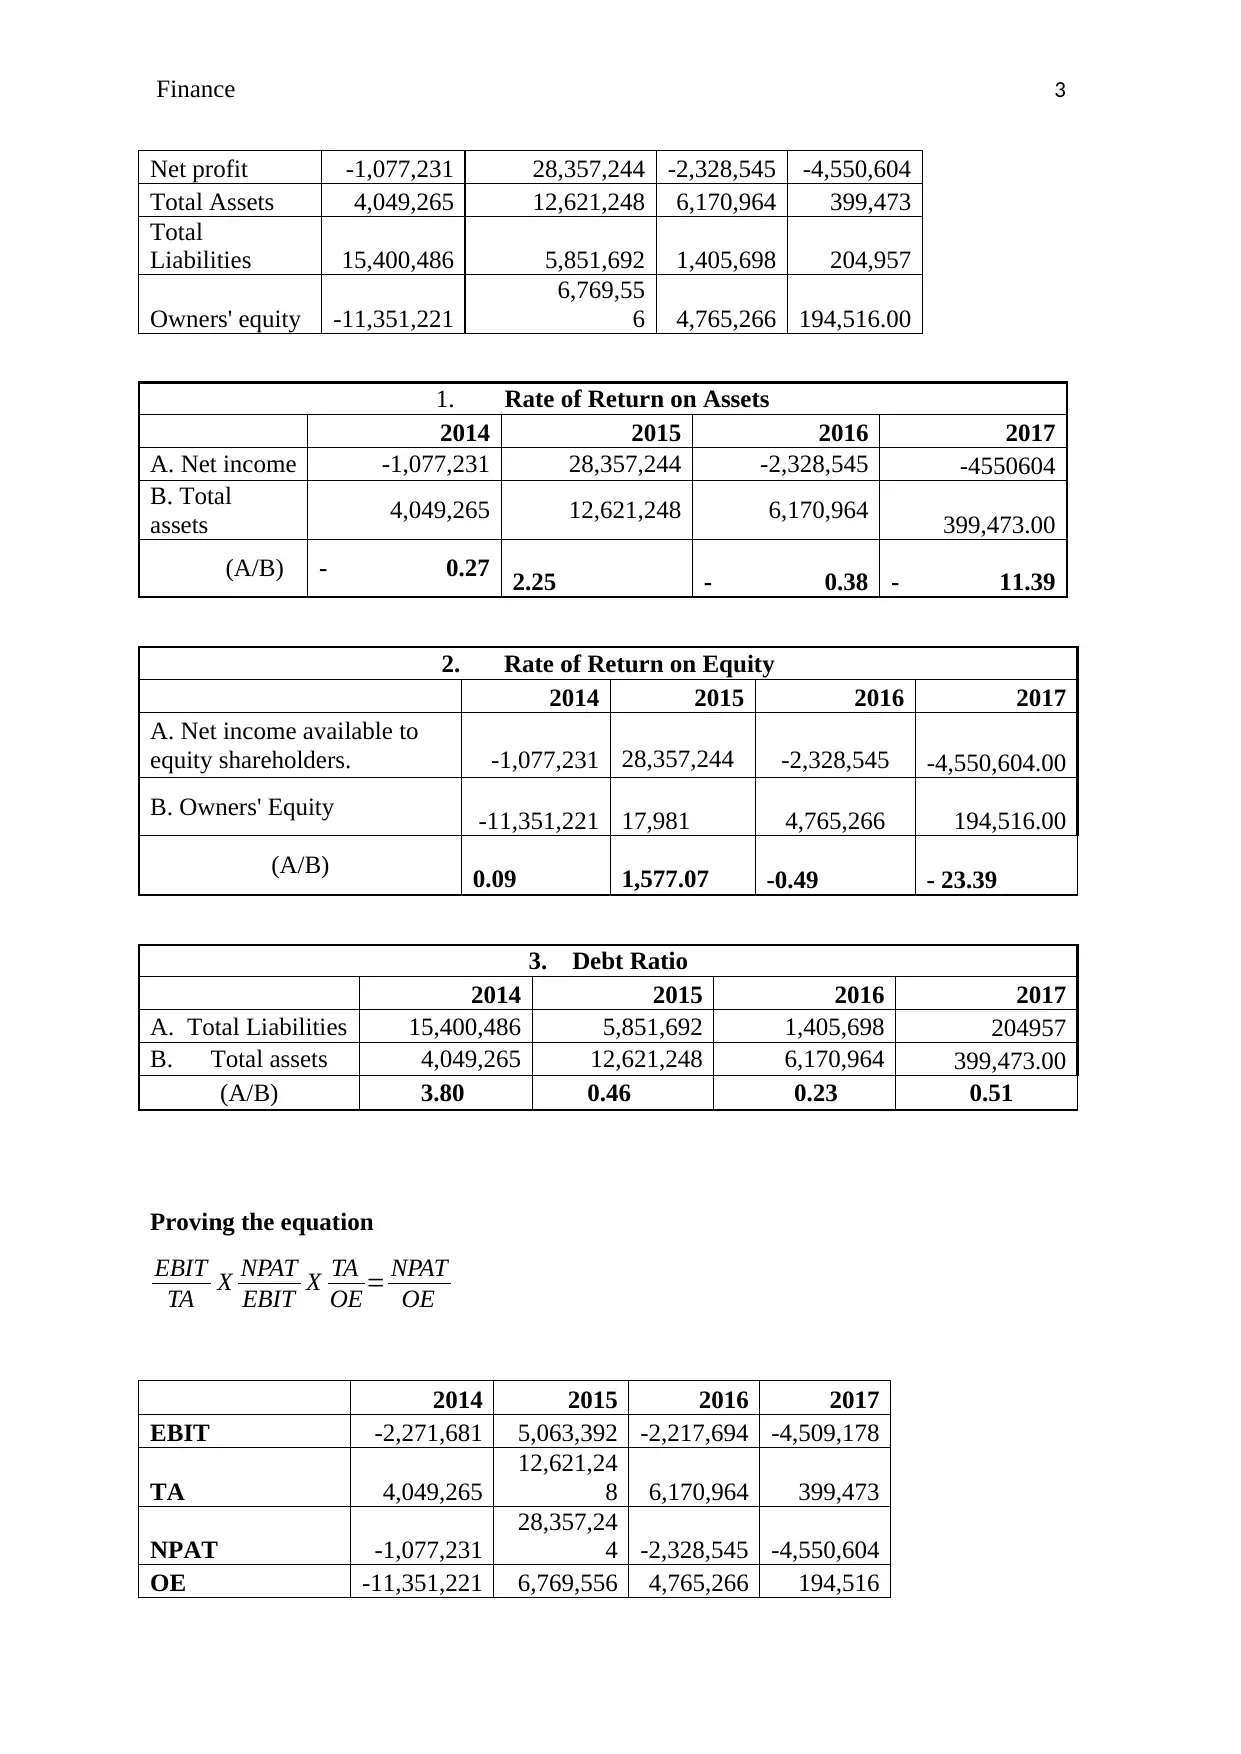
Net profit -1,077,231 28,357,244 -2,328,545 -4,550,604
Total Assets 4,049,265 12,621,248 6,170,964 399,473
Total
Liabilities 15,400,486 5,851,692 1,405,698 204,957
Owners' equity -11,351,221
6,769,55
6 4,765,266 194,516.00
1. Rate of Return on Assets
2014 2015 2016 2017
A. Net income -1,077,231 28,357,244 -2,328,545 -4550604
B. Total
assets 4,049,265 12,621,248 6,170,964 399,473.00
(A/B) - 0.27 2.25 - 0.38 - 11.39
2. Rate of Return on Equity
2014 2015 2016 2017
A. Net income available to
equity shareholders. -1,077,231 28,357,244 -2,328,545 -4,550,604.00
B. Owners' Equity -11,351,221 17,981 4,765,266 194,516.00
(A/B) 0.09 1,577.07 -0.49 - 23.39
3. Debt Ratio
2014 2015 2016 2017
A. Total Liabilities 15,400,486 5,851,692 1,405,698 204957
B. Total assets 4,049,265 12,621,248 6,170,964 399,473.00
(A/B) 3.80 0.46 0.23 0.51
Proving the equation
EBIT
TA X NPAT
EBIT X TA
OE = NPAT
OE
2014 2015 2016 2017
EBIT -2,271,681 5,063,392 -2,217,694 -4,509,178
TA 4,049,265
12,621,24
8 6,170,964 399,473
NPAT -1,077,231
28,357,24
4 -2,328,545 -4,550,604
OE -11,351,221 6,769,556 4,765,266 194,516
Paraphrase This Document
Need a fresh take? Get an instant paraphrase of this document with our AI Paraphraser
Finance 4
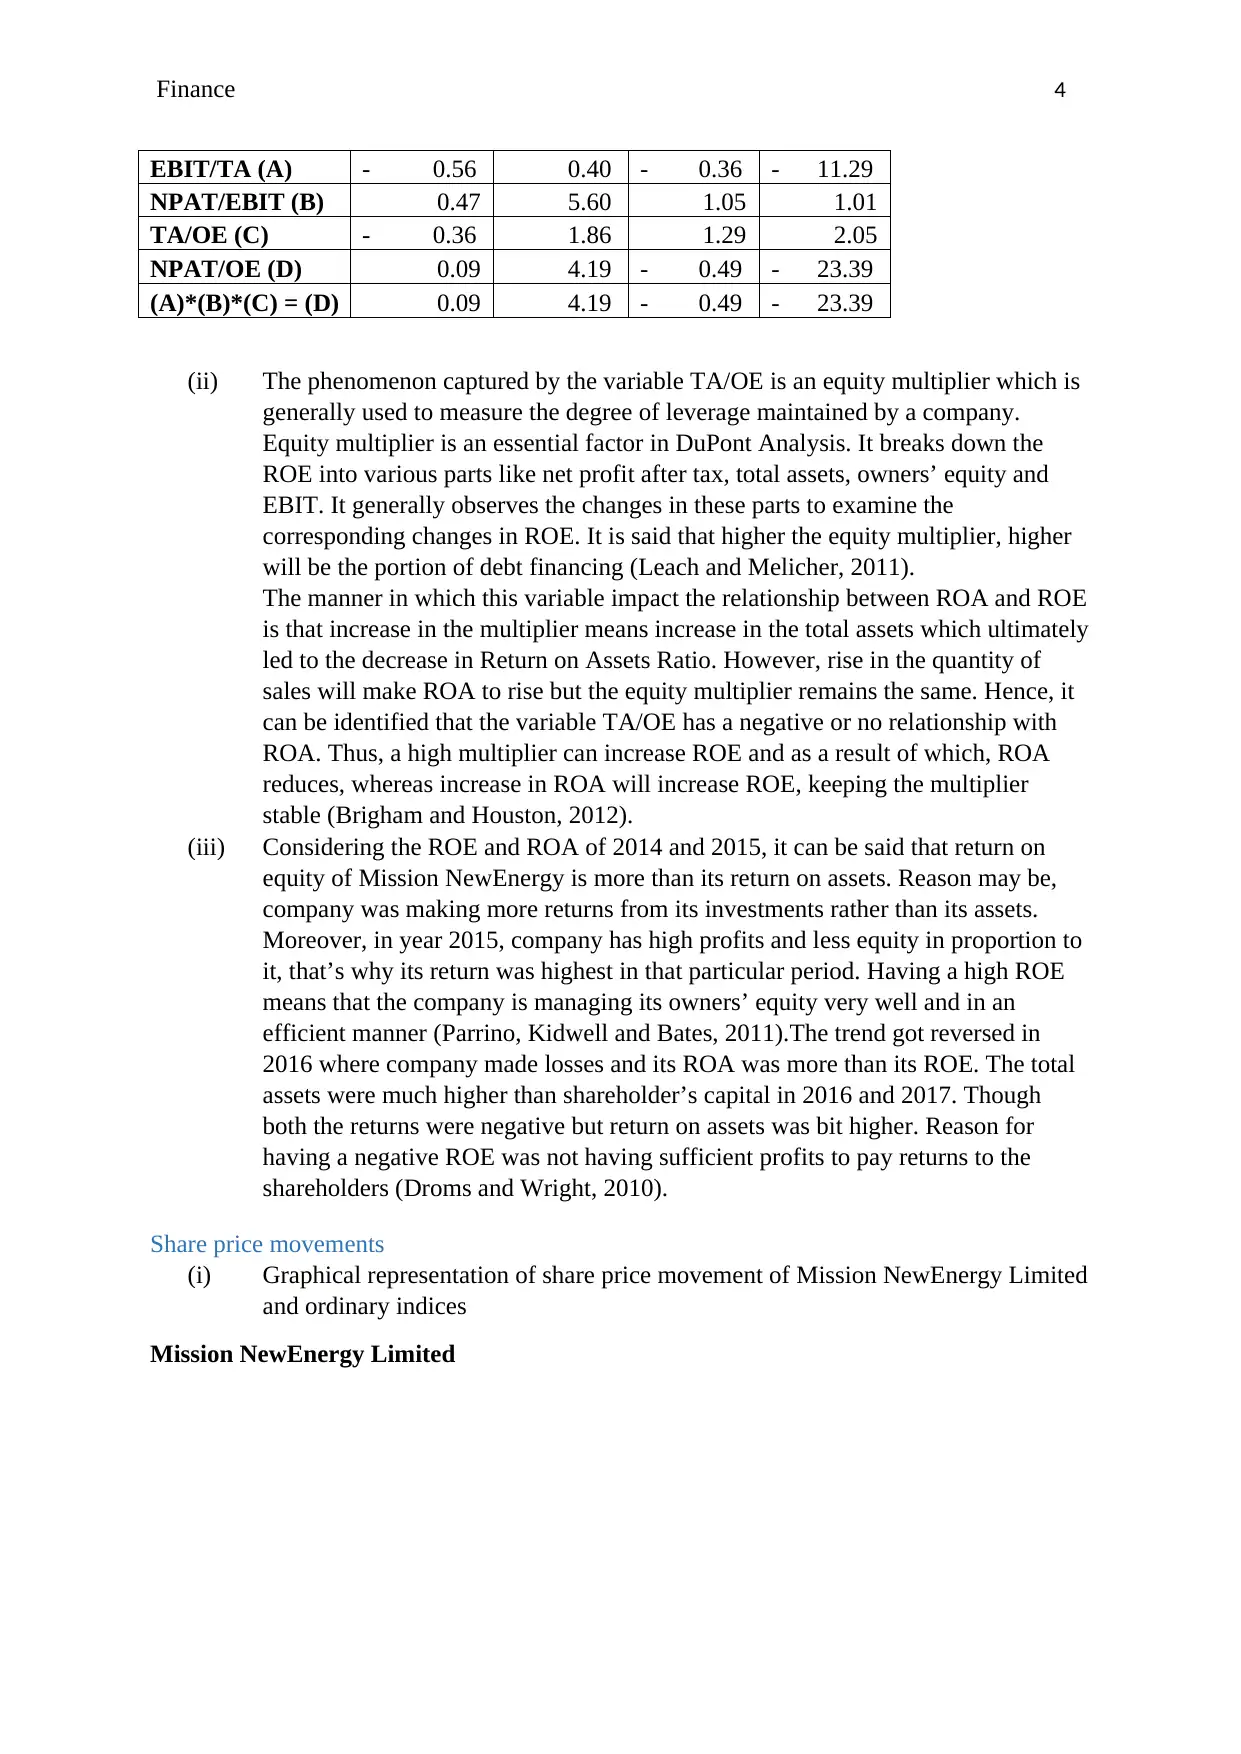
EBIT/TA (A) - 0.56 0.40 - 0.36 - 11.29
NPAT/EBIT (B) 0.47 5.60 1.05 1.01
TA/OE (C) - 0.36 1.86 1.29 2.05
NPAT/OE (D) 0.09 4.19 - 0.49 - 23.39
(A)*(B)*(C) = (D) 0.09 4.19 - 0.49 - 23.39
(ii) The phenomenon captured by the variable TA/OE is an equity multiplier which is
generally used to measure the degree of leverage maintained by a company.
Equity multiplier is an essential factor in DuPont Analysis. It breaks down the
ROE into various parts like net profit after tax, total assets, owners’ equity and
EBIT. It generally observes the changes in these parts to examine the
corresponding changes in ROE. It is said that higher the equity multiplier, higher
will be the portion of debt financing (Leach and Melicher, 2011).
The manner in which this variable impact the relationship between ROA and ROE
is that increase in the multiplier means increase in the total assets which ultimately
led to the decrease in Return on Assets Ratio. However, rise in the quantity of
sales will make ROA to rise but the equity multiplier remains the same. Hence, it
can be identified that the variable TA/OE has a negative or no relationship with
ROA. Thus, a high multiplier can increase ROE and as a result of which, ROA
reduces, whereas increase in ROA will increase ROE, keeping the multiplier
stable (Brigham and Houston, 2012).
(iii) Considering the ROE and ROA of 2014 and 2015, it can be said that return on
equity of Mission NewEnergy is more than its return on assets. Reason may be,
company was making more returns from its investments rather than its assets.
Moreover, in year 2015, company has high profits and less equity in proportion to
it, that’s why its return was highest in that particular period. Having a high ROE
means that the company is managing its owners’ equity very well and in an
efficient manner (Parrino, Kidwell and Bates, 2011).The trend got reversed in
2016 where company made losses and its ROA was more than its ROE. The total
assets were much higher than shareholder’s capital in 2016 and 2017. Though
both the returns were negative but return on assets was bit higher. Reason for
having a negative ROE was not having sufficient profits to pay returns to the
shareholders (Droms and Wright, 2010).
Share price movements
(i) Graphical representation of share price movement of Mission NewEnergy Limited
and ordinary indices
Mission NewEnergy Limited
Finance 5
2/1/2015
4/1/2015
6/1/2015
8/1/2015
10/1/2015
12/1/2015
2/1/2016
4/1/2016
6/1/2016
8/1/2016
10/1/2016
12/1/2016
0
0.02
0.04
0.06
0.08
0.1
0.12
0.14
Mission NewEnergy Limited
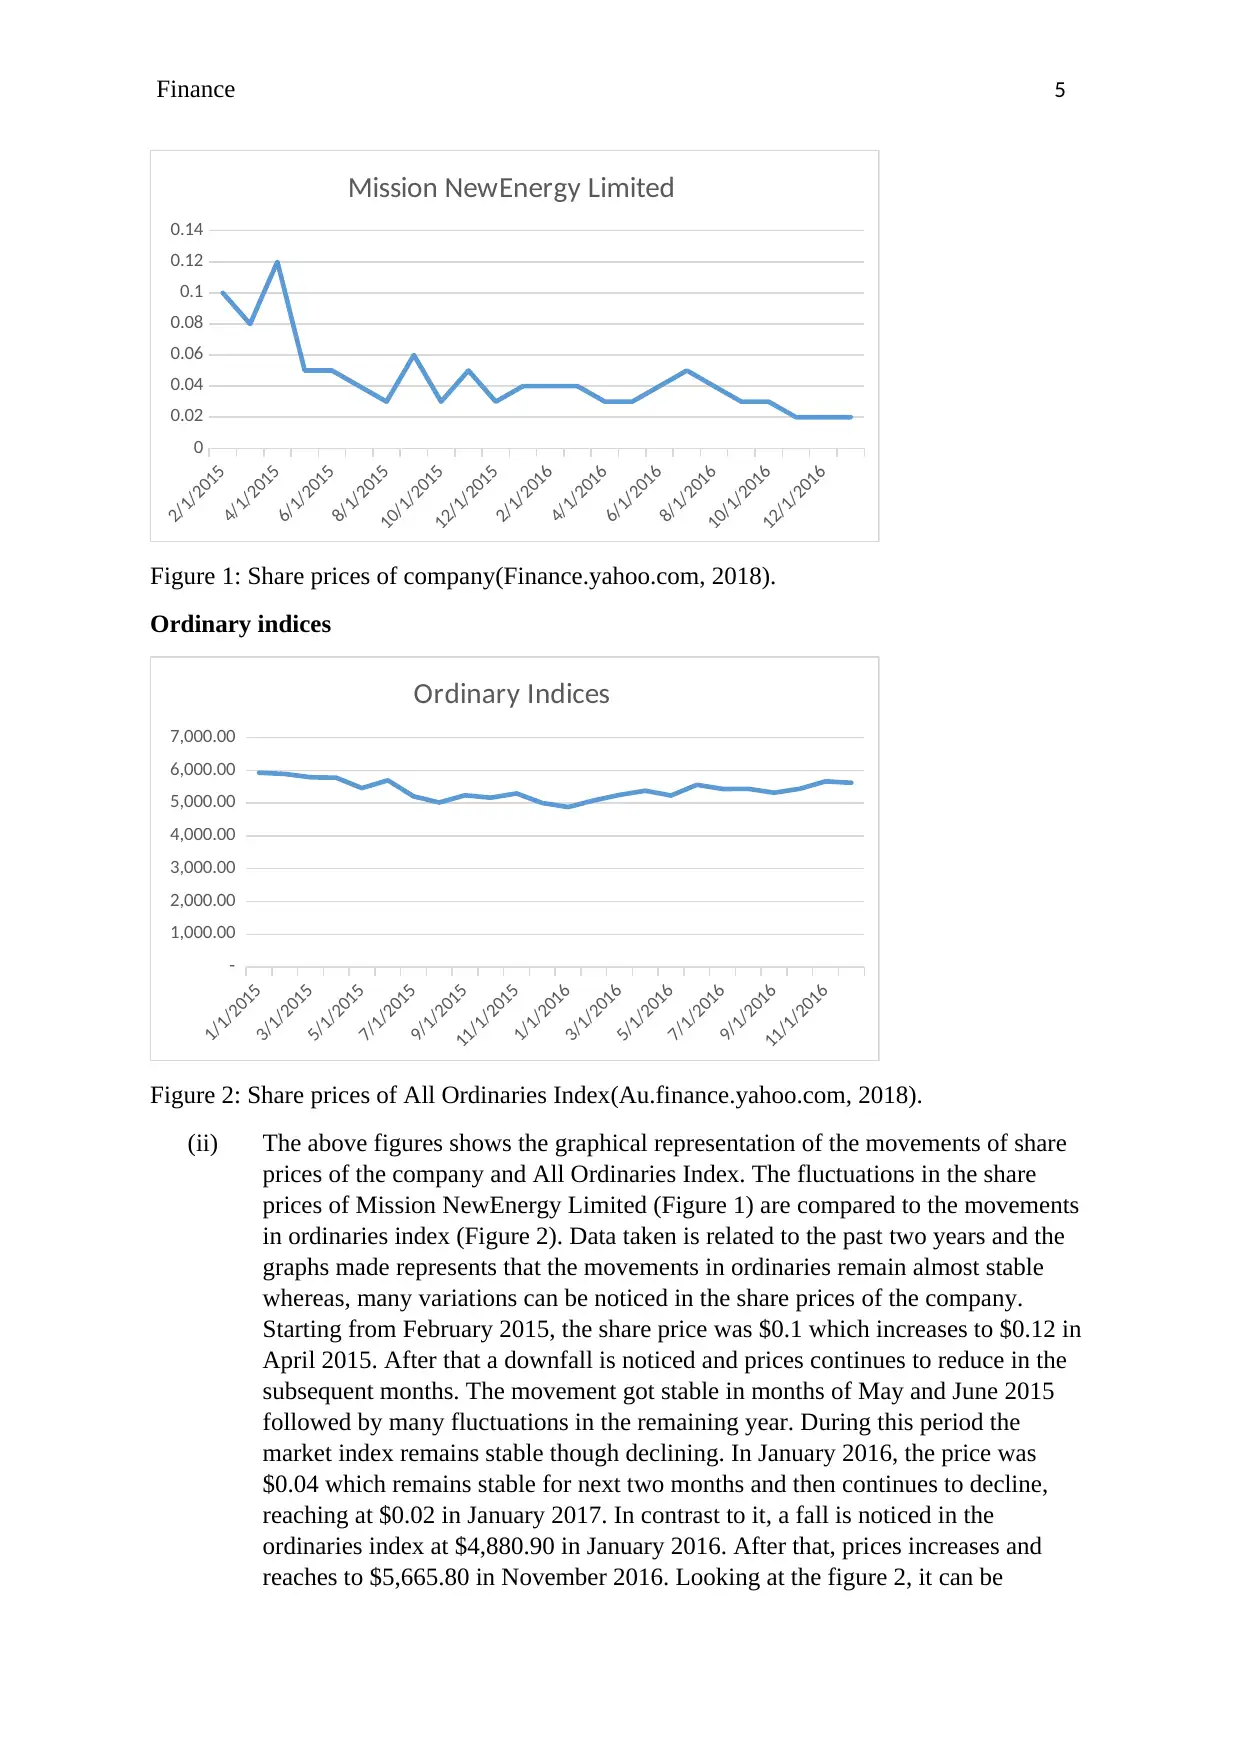
Figure 1: Share prices of company(Finance.yahoo.com, 2018).
Ordinary indices
1/1/2015
3/1/2015
5/1/2015
7/1/2015
9/1/2015
11/1/2015
1/1/2016
3/1/2016
5/1/2016
7/1/2016
9/1/2016
11/1/2016
-
1,000.00
2,000.00
3,000.00
4,000.00
5,000.00
6,000.00
7,000.00
Ordinary Indices
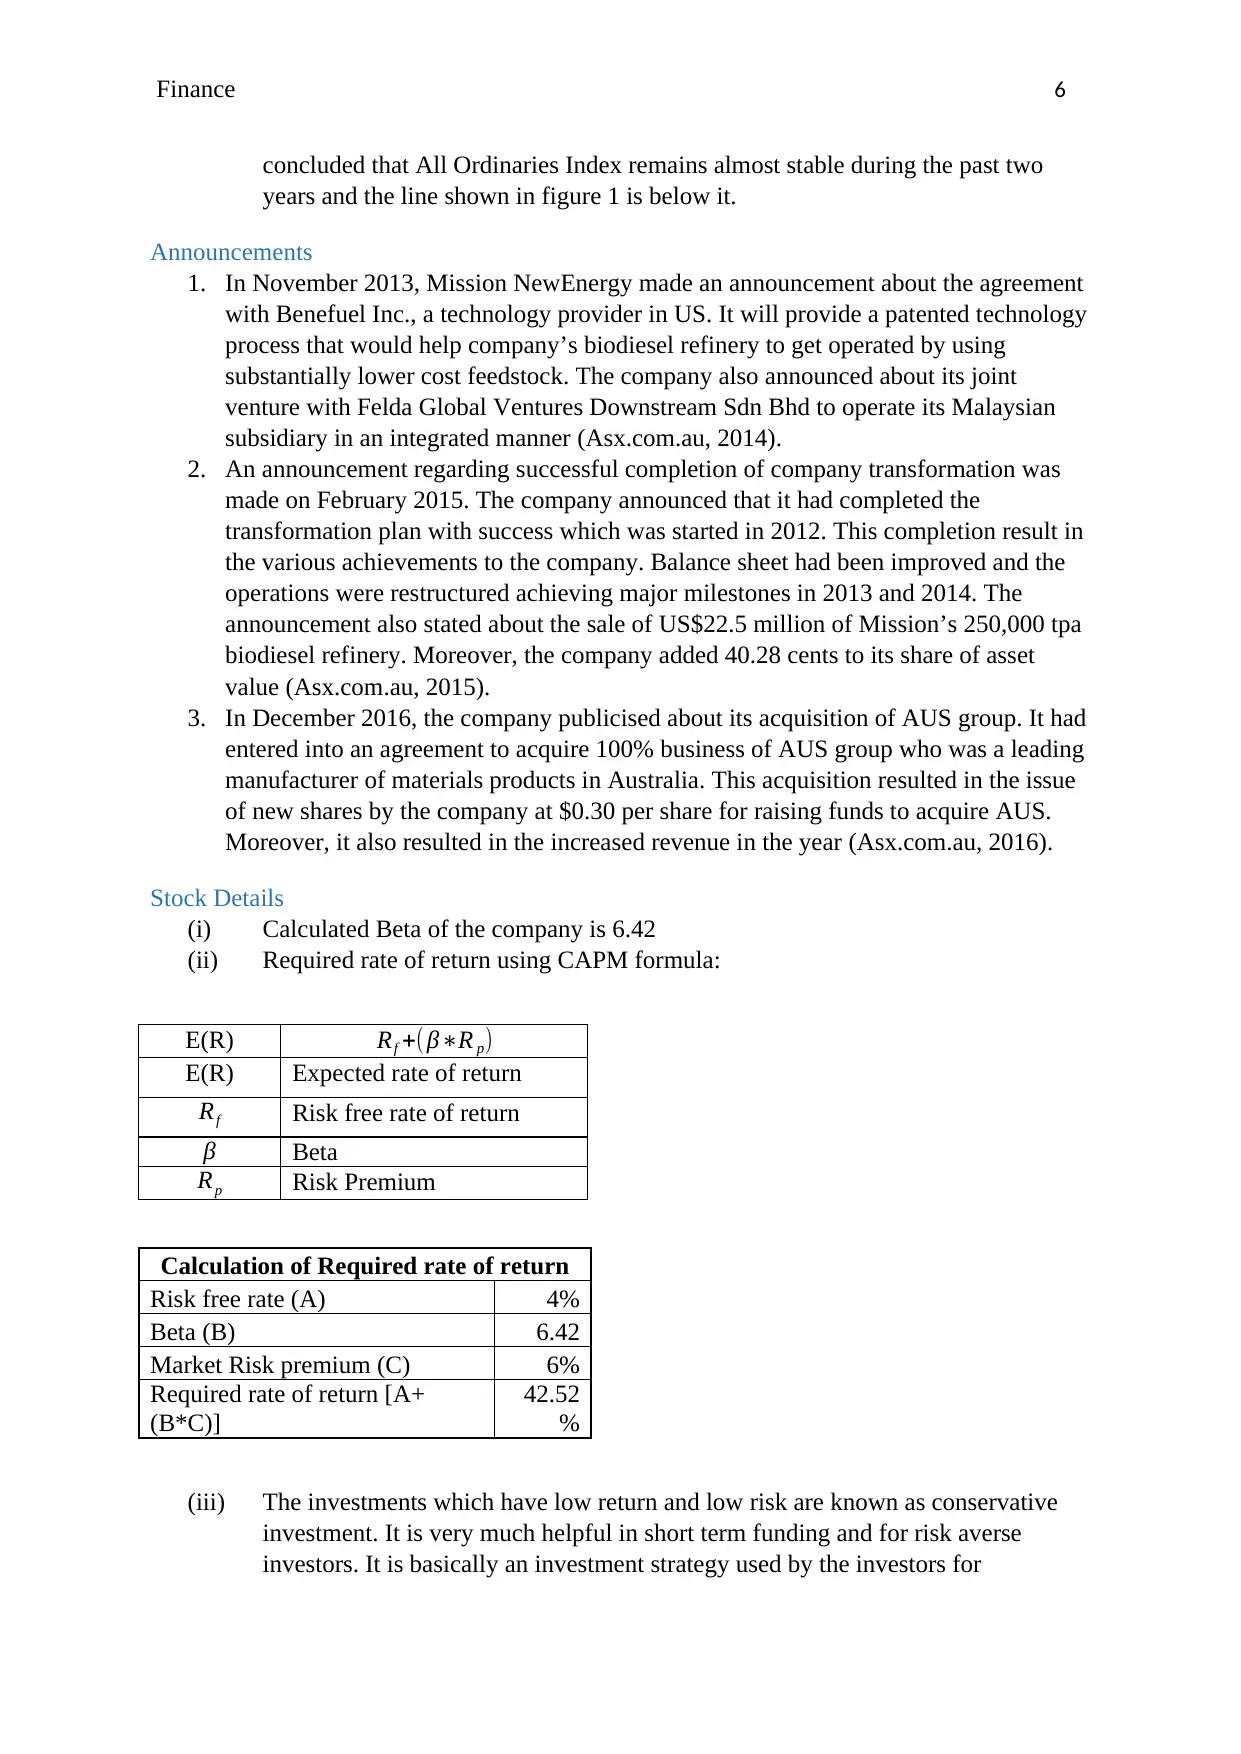
Figure 2: Share prices of All Ordinaries Index(Au.finance.yahoo.com, 2018).
(ii) The above figures shows the graphical representation of the movements of share
prices of the company and All Ordinaries Index. The fluctuations in the share
prices of Mission NewEnergy Limited (Figure 1) are compared to the movements
in ordinaries index (Figure 2). Data taken is related to the past two years and the
graphs made represents that the movements in ordinaries remain almost stable
whereas, many variations can be noticed in the share prices of the company.
Starting from February 2015, the share price was $0.1 which increases to $0.12 in
April 2015. After that a downfall is noticed and prices continues to reduce in the
subsequent months. The movement got stable in months of May and June 2015
followed by many fluctuations in the remaining year. During this period the
market index remains stable though declining. In January 2016, the price was
$0.04 which remains stable for next two months and then continues to decline,
reaching at $0.02 in January 2017. In contrast to it, a fall is noticed in the
ordinaries index at $4,880.90 in January 2016. After that, prices increases and
reaches to $5,665.80 in November 2016. Looking at the figure 2, it can be
2/1/2015
4/1/2015
6/1/2015
8/1/2015
10/1/2015
12/1/2015
2/1/2016
4/1/2016
6/1/2016
8/1/2016
10/1/2016
12/1/2016
0
0.02
0.04
0.06
0.08
0.1
0.12
0.14
Mission NewEnergy Limited
Figure 1: Share prices of company(Finance.yahoo.com, 2018).
Ordinary indices
1/1/2015
3/1/2015
5/1/2015
7/1/2015
9/1/2015
11/1/2015
1/1/2016
3/1/2016
5/1/2016
7/1/2016
9/1/2016
11/1/2016
-
1,000.00
2,000.00
3,000.00
4,000.00
5,000.00
6,000.00
7,000.00
Ordinary Indices
Figure 2: Share prices of All Ordinaries Index(Au.finance.yahoo.com, 2018).
(ii) The above figures shows the graphical representation of the movements of share
prices of the company and All Ordinaries Index. The fluctuations in the share
prices of Mission NewEnergy Limited (Figure 1) are compared to the movements
in ordinaries index (Figure 2). Data taken is related to the past two years and the
graphs made represents that the movements in ordinaries remain almost stable
whereas, many variations can be noticed in the share prices of the company.
Starting from February 2015, the share price was $0.1 which increases to $0.12 in
April 2015. After that a downfall is noticed and prices continues to reduce in the
subsequent months. The movement got stable in months of May and June 2015
followed by many fluctuations in the remaining year. During this period the
market index remains stable though declining. In January 2016, the price was
$0.04 which remains stable for next two months and then continues to decline,
reaching at $0.02 in January 2017. In contrast to it, a fall is noticed in the
ordinaries index at $4,880.90 in January 2016. After that, prices increases and
reaches to $5,665.80 in November 2016. Looking at the figure 2, it can be
⊘ This is a preview!⊘
Do you want full access?
Subscribe today to unlock all pages.
Trusted by 1+ million students worldwide
Finance 6
concluded that All Ordinaries Index remains almost stable during the past two
years and the line shown in figure 1 is below it.
Announcements
1. In November 2013, Mission NewEnergy made an announcement about the agreement
with Benefuel Inc., a technology provider in US. It will provide a patented technology
process that would help company’s biodiesel refinery to get operated by using
substantially lower cost feedstock. The company also announced about its joint
venture with Felda Global Ventures Downstream Sdn Bhd to operate its Malaysian
subsidiary in an integrated manner (Asx.com.au, 2014).
2. An announcement regarding successful completion of company transformation was
made on February 2015. The company announced that it had completed the
transformation plan with success which was started in 2012. This completion result in
the various achievements to the company. Balance sheet had been improved and the
operations were restructured achieving major milestones in 2013 and 2014. The
announcement also stated about the sale of US$22.5 million of Mission’s 250,000 tpa
biodiesel refinery. Moreover, the company added 40.28 cents to its share of asset
value (Asx.com.au, 2015).
3. In December 2016, the company publicised about its acquisition of AUS group. It had
entered into an agreement to acquire 100% business of AUS group who was a leading
manufacturer of materials products in Australia. This acquisition resulted in the issue
of new shares by the company at $0.30 per share for raising funds to acquire AUS.
Moreover, it also resulted in the increased revenue in the year (Asx.com.au, 2016).
Stock Details
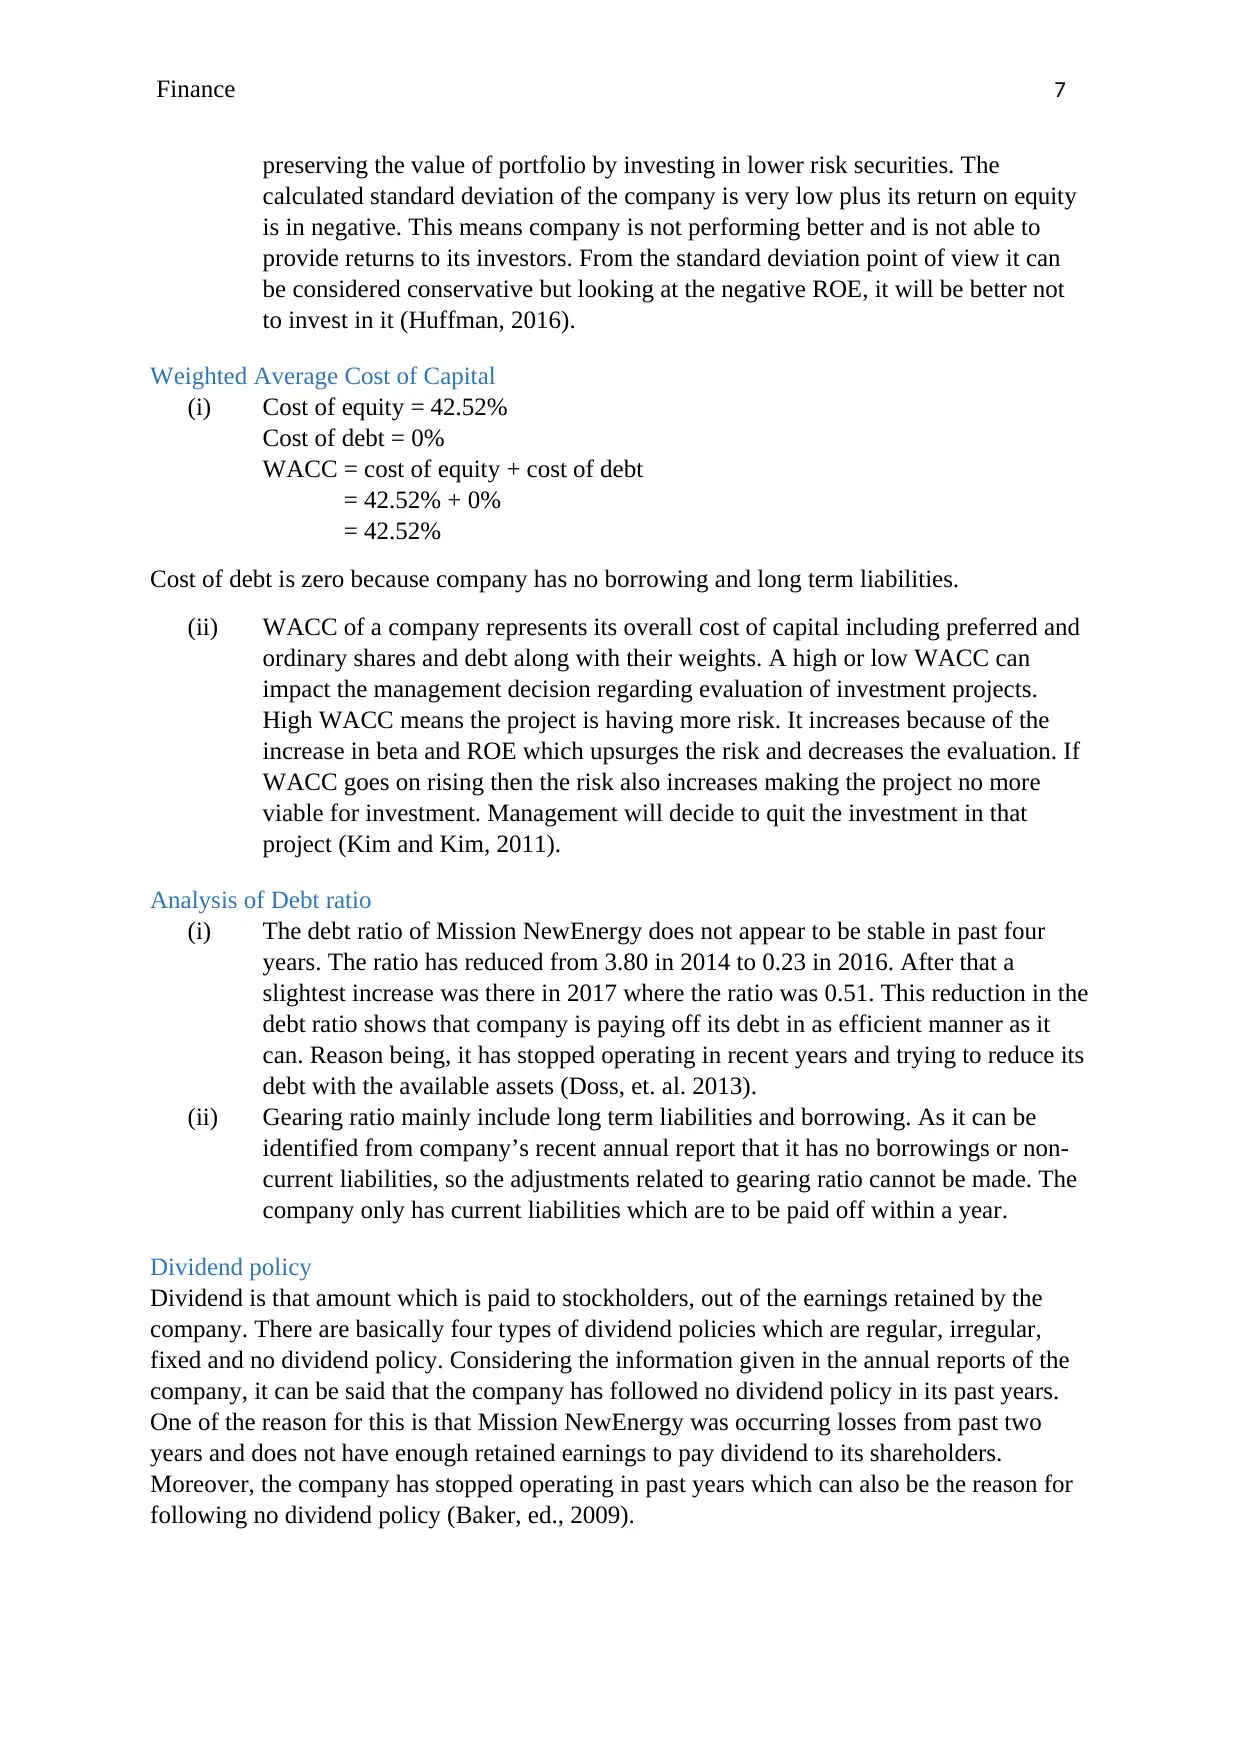
(i) Calculated Beta of the company is 6.42
(ii) Required rate of return using CAPM formula:
E(R) Rf +( β∗R p)
E(R) Expected rate of return
Rf Risk free rate of return
β Beta
Rp Risk Premium
Calculation of Required rate of return
Risk free rate (A) 4%
Beta (B) 6.42
Market Risk premium (C) 6%
Required rate of return [A+
(B*C)]
42.52
%
(iii) The investments which have low return and low risk are known as conservative
investment. It is very much helpful in short term funding and for risk averse
investors. It is basically an investment strategy used by the investors for
concluded that All Ordinaries Index remains almost stable during the past two
years and the line shown in figure 1 is below it.
Announcements
1. In November 2013, Mission NewEnergy made an announcement about the agreement
with Benefuel Inc., a technology provider in US. It will provide a patented technology
process that would help company’s biodiesel refinery to get operated by using
substantially lower cost feedstock. The company also announced about its joint
venture with Felda Global Ventures Downstream Sdn Bhd to operate its Malaysian
subsidiary in an integrated manner (Asx.com.au, 2014).
2. An announcement regarding successful completion of company transformation was
made on February 2015. The company announced that it had completed the
transformation plan with success which was started in 2012. This completion result in
the various achievements to the company. Balance sheet had been improved and the
operations were restructured achieving major milestones in 2013 and 2014. The
announcement also stated about the sale of US$22.5 million of Mission’s 250,000 tpa
biodiesel refinery. Moreover, the company added 40.28 cents to its share of asset
value (Asx.com.au, 2015).
3. In December 2016, the company publicised about its acquisition of AUS group. It had
entered into an agreement to acquire 100% business of AUS group who was a leading
manufacturer of materials products in Australia. This acquisition resulted in the issue
of new shares by the company at $0.30 per share for raising funds to acquire AUS.
Moreover, it also resulted in the increased revenue in the year (Asx.com.au, 2016).
Stock Details
(i) Calculated Beta of the company is 6.42
(ii) Required rate of return using CAPM formula:
E(R) Rf +( β∗R p)
E(R) Expected rate of return
Rf Risk free rate of return
β Beta
Rp Risk Premium
Calculation of Required rate of return
Risk free rate (A) 4%
Beta (B) 6.42
Market Risk premium (C) 6%
Required rate of return [A+
(B*C)]
42.52
%
(iii) The investments which have low return and low risk are known as conservative
investment. It is very much helpful in short term funding and for risk averse
investors. It is basically an investment strategy used by the investors for
Paraphrase This Document
Need a fresh take? Get an instant paraphrase of this document with our AI Paraphraser
Finance 7
preserving the value of portfolio by investing in lower risk securities. The
calculated standard deviation of the company is very low plus its return on equity
is in negative. This means company is not performing better and is not able to
provide returns to its investors. From the standard deviation point of view it can
be considered conservative but looking at the negative ROE, it will be better not
to invest in it (Huffman, 2016).
Weighted Average Cost of Capital
(i) Cost of equity = 42.52%
Cost of debt = 0%
WACC = cost of equity + cost of debt
= 42.52% + 0%
= 42.52%
Cost of debt is zero because company has no borrowing and long term liabilities.
(ii) WACC of a company represents its overall cost of capital including preferred and
ordinary shares and debt along with their weights. A high or low WACC can
impact the management decision regarding evaluation of investment projects.
High WACC means the project is having more risk. It increases because of the
increase in beta and ROE which upsurges the risk and decreases the evaluation. If
WACC goes on rising then the risk also increases making the project no more
viable for investment. Management will decide to quit the investment in that
project (Kim and Kim, 2011).
Analysis of Debt ratio
(i) The debt ratio of Mission NewEnergy does not appear to be stable in past four
years. The ratio has reduced from 3.80 in 2014 to 0.23 in 2016. After that a
slightest increase was there in 2017 where the ratio was 0.51. This reduction in the
debt ratio shows that company is paying off its debt in as efficient manner as it
can. Reason being, it has stopped operating in recent years and trying to reduce its
debt with the available assets (Doss, et. al. 2013).
(ii) Gearing ratio mainly include long term liabilities and borrowing. As it can be
identified from company’s recent annual report that it has no borrowings or non-
current liabilities, so the adjustments related to gearing ratio cannot be made. The
company only has current liabilities which are to be paid off within a year.
Dividend policy
Dividend is that amount which is paid to stockholders, out of the earnings retained by the
company. There are basically four types of dividend policies which are regular, irregular,
fixed and no dividend policy. Considering the information given in the annual reports of the
company, it can be said that the company has followed no dividend policy in its past years.
One of the reason for this is that Mission NewEnergy was occurring losses from past two
years and does not have enough retained earnings to pay dividend to its shareholders.
Moreover, the company has stopped operating in past years which can also be the reason for
following no dividend policy (Baker, ed., 2009).

Finance 8
Recommendation letter
From the above analysis, it can be concluded that this company should not be in the
investment portfolio. It has negative ROE, negative profit margin and follows a no dividend
policy. On the top of that, Mission NewEnergy Limited is at the stage of winding up, so it
will be better not to include this company in the portfolio.
⊘ This is a preview!⊘
Do you want full access?
Subscribe today to unlock all pages.
Trusted by 1+ million students worldwide
Finance 9
References
Asx.com.au. (2014). Mission signs plant purchase and joint venture agreement with world's
largest palm oil producer and US technology provider. [Online] Available at:
https://www.asx.com.au/asxpdf/20140901/pdf/42rxhxqr1h71cs.pdf [Accessed 23 Jan. 2018].
Asx.com.au. (2015). Successful completion of Company Transformation. [Online] Available
at: https://www.asx.com.au/asxpdf/20150219/pdf/42wpv27wvjtfh3.pdf [Accessed 23 Jan.
2018].
Asx.com.au. (2016). Mission to acquire 100% of the business operations of AUS group.
[Online] Available at: https://www.asx.com.au/asxpdf/20161205/pdf/43dhd4j5bjwj9h.pdf
[Accessed 23 Jan. 2018].
Au.finance.yahoo.com. (2018). ^AXJO Historical prices | S&P/ASX 200 Stock - Yahoo
Finance. [Online] Available at: https://au.finance.yahoo.com/quote/%5EAXJO/history?
period1=1421865000&period2=1485023400&interval=1mo&filter=history&frequency=1mo
[Accessed 23 Jan. 2018].
Baker, H.K. ed., 2009. Dividends and dividend policy (Vol. 1). John Wiley & Sons.
Brigham, E.F. and Houston, J.F., 2012. Fundamentals of financial management. Cengage
Learning.
Doss, D.A., Sumrall III, W.H., McElreath, D.H. and Jones, D.W., 2013. Economic and
financial analysis for criminal justice organizations. CRC Press.
Droms, W.G. and Wright, J.O., 2010. Finance and accounting for nonfinancial managers:
All the basics you need to know. Basic Books (AZ).
Finance.yahoo.com. (2018). MNELF Historical Prices | MISSION NEWENERGY Stock -
Yahoo Finance. [Online] Available at: https://finance.yahoo.com/quote/MNELF/history?
period1=1421865000&period2=1485023400&interval=1mo&filter=history&frequency=1mo
[Accessed 23 Jan. 2018].
Huffman, B., 2016. Assessing the Risk of Conservative Investments. Journal of Applied
Financial Research, 1, p.42.
Kim, K.A. and Kim, S.H., 2011. Global Corporate Finance: A Focused Approach.
Leach, J.C. and Melicher, R.W., 2011. Entrepreneurial finance. Cengage Learning.
Missionnewenergy.com. (2018). Home. [Online] Available at: http://missionnewenergy1-
web.sharepoint.com/Pages/default.aspx/ [Accessed 22 Jan. 2018].
Parrino, R., Kidwell, D. S. and Bates, T. 2011. Fundamentals of corporate finance. John
Wiley & Sons.
1 out of 10
Related Documents


Your All-in-One AI-Powered Toolkit for Academic Success.
+13062052269
info@desklib.com
Available 24*7 on WhatsApp / Email
![[object Object]](/_next/static/media/star-bottom.7253800d.svg)
Unlock your academic potential
Copyright © 2020–2026 A2Z Services. All Rights Reserved. Developed and managed by ZUCOL.