Comprehensive Financial Analysis Report: Wesfarmers vs. Woolworths
VerifiedAdded on 2020/07/23
|16
|4537
|39
Report
AI Summary
This company analysis report meticulously examines the financial performance of two major Australian companies, Wesfarmers and Woolworths Group. The report begins with an overview of each company, including their core businesses, historical backgrounds, and key developments. It then delves into a detailed analysis of their financial statements, including income statements, balance sheets, and cash flow statements for the years 2016 and 2017. The analysis includes a comparison of sales, cost of sales, gross profit, operating expenses, and net income, along with a discussion of key financial ratios such as return on assets, return on equity, and return on invested capital. The report also incorporates a SWOT analysis to assess the companies' strengths, weaknesses, opportunities, and threats. Finally, the report provides investment recommendations based on the financial analysis and overall performance assessment of both companies, culminating in a concise conclusion summarizing the key findings.
COMPANY ANALYSIS
REPORT
REPORT
Paraphrase This Document
Need a fresh take? Get an instant paraphrase of this document with our AI Paraphraser
Table of Contents
INTRODUCTION...........................................................................................................................1
OBJECTIVES..................................................................................................................................1
OVERVIEW OF ORGANISATIONS.............................................................................................1
Wesfarmers.................................................................................................................................1
WOOLWORTHS GROUP.........................................................................................................2
ANALYSIS OF FINANCIAL STATEMENTS..............................................................................4
ANALYSIS OF BALANCE SHEET..............................................................................................6
ANALYSIS OF CASH FLOWS.....................................................................................................8
RATIO ANALYSIS ......................................................................................................................10
SWOT ANALYSIS ......................................................................................................................11
RECOMMENDATION.................................................................................................................12
CONCLUSION..............................................................................................................................12
REFERENCES..............................................................................................................................13
INTRODUCTION
This report is prepared to analysis annual reports in of two organisations in order to
determine financial performance. Analysis of financial statements are done subject to explain
key financial indicators and aspects which are helpful in maintaining healthy and optimum
financial health of organisation and reduce the risk factors. A structured format is followed to
elaborate the concept. A company analysis report contains the aspects and measures which assist
financial growth of organisation in systematic manner.
OBJECTIVES
Aim of this report is to analyse the annual report of two Australian Listed organisations.
Drives of performance, risk and values, an overall investment recommendation and companies
are defined in this context. Educational objectives of this project are to enhance knowledge and
skills in understanding financial statements and evaluating data in excel to determine what
informations and details are addressed subject to performance and risk and values of
organisations and firms.
OVERVIEW OF ORGANISATIONS
Wesfarmers
Core business
Wesfarmers deals in supermarkets, hotels, liquor and convince stores for office suppliers
departmental stores and an industrials division with business in chemicals, fertilisers and energy
and industrial and safety products and coal. Wesfarner is one of the Australia's largest private
sector shareholder and employee organisation which has employee strength of approx 550,000.
History
This is a diversified organisation which was established in 1914 as western 'Australian
farmers' cooperative. Deane Hammond was the first chairman of the organisation. It was
established due to demand of the rural workers union for finer pay and less hours. Basically
organisation was formed to enhance and develop living standards of rural workers and farmers.
Empowering rural farmers and workers for their rights were main objectives of this Wesfarmers.
In 27 June 1914 the organisation get registered and started working with farmers. Soon
association started working with various companies under the Western Australian Farmer Act
and began trading form two small rooms at 13 Howard Street, Perth. It moved its new head
office just after establishment of three years at 569 Wellington street, Central Perth.
1
⊘ This is a preview!⊘
Do you want full access?
Subscribe today to unlock all pages.
Trusted by 1+ million students worldwide
Journey
As per growth perspective organisation grown up tremendously. In 1924 it launched first
commercial radio station subject to improve lives and livelihood to western farmers. In 1927 it
expand organisation with super phosphate Cuming Smith and Mt Lyell Farmers Fertiliser. In
1950 it acquired GASCYNE trading which introduced air conditioned trailers for better
condition. It expansion in to collection of art collection in 1977 and launched a takeover bid for
CSBP. In 1984 Wesfarmer becomes a public listed company. It acquired 50% shares of Gresham
partners. It acquired 100% of CSBP in 1986. there are two major steps was taken by organisation
in terms of business expansion plans. It take over Western Colliers which was a mine industry
with a new commission and contract.
In 1993 it acquired Dalgety farmers which was 147 years old corporation with $78
million. The major work of Wasfarmers stared after this merger. It started in capital management
and securities from acquisition of Lumley insurance. Company expanded its insurance business
further in 2006, with the take over of New Zealand insurance broker Crombie Lockwood and
OAMPS LTD with the $700 million. OAMPS was the largest public listed insurance broker. It
acquired Cole group in 2007 investing $19.3 billion. This was the time of global financial crisis
and Cole's shareholders withdrawal investments from organisation.
It introduced first reconciliation action plan in 2009 and $4.6 billion equity. In 2013
capital return subject to improve insurance business. It sold insurance underwriter business in
Australia and New Zealand to insurance Australia group. Sale was completed in June 2014.
Performance of organisation
Operating performance organisation is also in adequate manner such as return on assets
for the year 2017 is 7.10%. return on equity is calculated as 12.25% and return on invested
capital as 8.48%. return on capital invested decreased from last year which was recorded as 9.25
% overall effect fall upon organisation as .77% change in equal growth.
WOOLWORTHS GROUP
Core business
this organisation is one of the largest online supermarket business chain. Which deals in
multiple customer products and segments. It mostly deals in vegetables, fruit, meat, packaged
foods etc. it sells magazines, household products, DVDs and healthy and beauty products. At
present organisation is dealing 1000 stores across Australia. It also supplies pet and baby and
2
Paraphrase This Document
Need a fresh take? Get an instant paraphrase of this document with our AI Paraphraser
stationary procures too. It has multinational brand image across the world in respect of providing
fresh foods and customer products. Its loyalty scheme contains the number of incentives for
acquiring products. One of it's subsidiary provides reasonable petroleum products at Caltex
Woolworths petrol stations.
History
Organisation was funded on 5 December, 1924. it opened its business segment in
Sydney's Imperial Arcade in the basement. Woolworths opened its second store in 1927 at queen
street in Brisbane in rare conditions. It opened first store in New Zealand in 1930, at that time
organisation had 16 stores across new South Wales, Queensland and western Australia. In 1937
it introduced its brand image through media channels. This also indicates towards enhancing
sustainable growth of organisation. In 1939 it launched staff assurance scheme by giving the
team security in their retirement. Till 1940 organisation became able to develop its own
warehouse and space for better advancement and growth. Its first ware house was established in
1929 but the size was store was not enough to store products.
Its core business started form the year 1957 when it put steps towards food industry. It
launched first food store in Sydney's Dee why in 1957. grocery range was limited but included
fresh vegetables. It major food items are packaged fresh meat sold out of refrigerated cabinets.
Till 1959 Woolworth able to inaugurate 300th store in Wentworthville NSW. In 1960
organisation become first Australia's first nationwide retailer. Company achieved its mission to
deliver quality and value to every state and territory in the country.
Market condition and economic diverse
This is one of the largest retail sector in Australia. Tesco PLC, Wesfarmers Ltd., Seven &
I holdings Co. Ltd and the Kroher Co is most near competitors of organisation. Market cap of
woolworths group Ltd was recorded as 26877 and 38625 for seven and I holding co. Ltd. Tesco
has also nearest peer which was recorded as 32478. it has largest supermarket chain which is
involved in distributing customer satisfactory products and services. It used to trade as Safeway
and in all Victorian locations. It has also has private label brands such as Woolworths home
brand , Woolworths select, woolworths gold, Woolworths fresh and macro wholefoods market.
Performance of Woolworth group
Growth rate of last three year was recorded as -2.98% net income growth was calculated
as -14.48%. Return on assets was calculated as 6.61% and return on equity was recorded as
3
17.04%. overall return on assets% is calculated as 6.16% return on equity is calculated as
15.30% and return on invested capital is recorded as 13.14%.
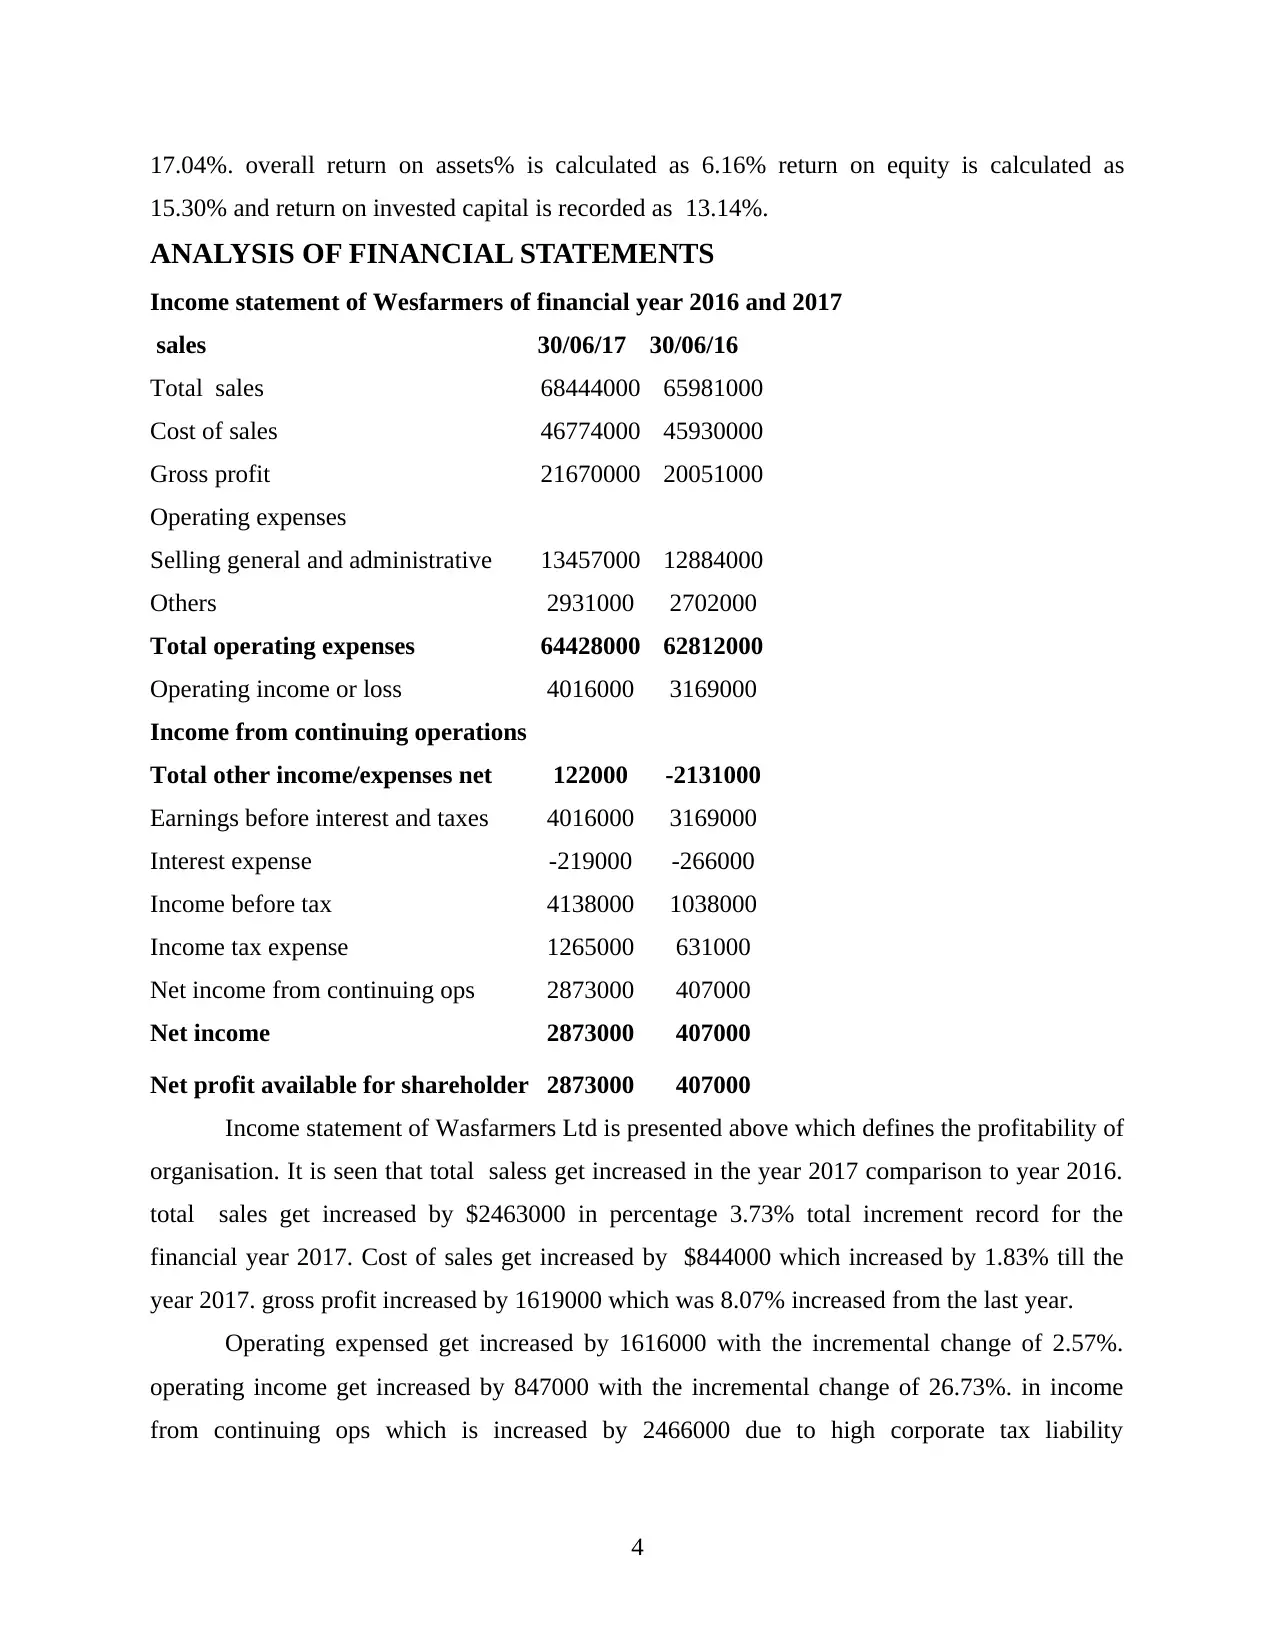
ANALYSIS OF FINANCIAL STATEMENTS
Income statement of Wesfarmers of financial year 2016 and 2017
sales 30/06/17 30/06/16
Total sales 68444000 65981000
Cost of sales 46774000 45930000
Gross profit 21670000 20051000
Operating expenses
Selling general and administrative 13457000 12884000
Others 2931000 2702000
Total operating expenses 64428000 62812000
Operating income or loss 4016000 3169000
Income from continuing operations
Total other income/expenses net 122000 -2131000
Earnings before interest and taxes 4016000 3169000
Interest expense -219000 -266000
Income before tax 4138000 1038000
Income tax expense 1265000 631000
Net income from continuing ops 2873000 407000
Net income 2873000 407000
Net profit available for shareholder 2873000 407000
Income statement of Wasfarmers Ltd is presented above which defines the profitability of
organisation. It is seen that total saless get increased in the year 2017 comparison to year 2016.
total sales get increased by $2463000 in percentage 3.73% total increment record for the
financial year 2017. Cost of sales get increased by $844000 which increased by 1.83% till the
year 2017. gross profit increased by 1619000 which was 8.07% increased from the last year.
Operating expensed get increased by 1616000 with the incremental change of 2.57%.
operating income get increased by 847000 with the incremental change of 26.73%. in income
from continuing ops which is increased by 2466000 due to high corporate tax liability
4
15.30% and return on invested capital is recorded as 13.14%.
ANALYSIS OF FINANCIAL STATEMENTS
Income statement of Wesfarmers of financial year 2016 and 2017
sales 30/06/17 30/06/16
Total sales 68444000 65981000
Cost of sales 46774000 45930000
Gross profit 21670000 20051000
Operating expenses
Selling general and administrative 13457000 12884000
Others 2931000 2702000
Total operating expenses 64428000 62812000
Operating income or loss 4016000 3169000
Income from continuing operations
Total other income/expenses net 122000 -2131000
Earnings before interest and taxes 4016000 3169000
Interest expense -219000 -266000
Income before tax 4138000 1038000
Income tax expense 1265000 631000
Net income from continuing ops 2873000 407000
Net income 2873000 407000
Net profit available for shareholder 2873000 407000
Income statement of Wasfarmers Ltd is presented above which defines the profitability of
organisation. It is seen that total saless get increased in the year 2017 comparison to year 2016.
total sales get increased by $2463000 in percentage 3.73% total increment record for the
financial year 2017. Cost of sales get increased by $844000 which increased by 1.83% till the
year 2017. gross profit increased by 1619000 which was 8.07% increased from the last year.
Operating expensed get increased by 1616000 with the incremental change of 2.57%.
operating income get increased by 847000 with the incremental change of 26.73%. in income
from continuing ops which is increased by 2466000 due to high corporate tax liability
4
⊘ This is a preview!⊘
Do you want full access?
Subscribe today to unlock all pages.
Trusted by 1+ million students worldwide
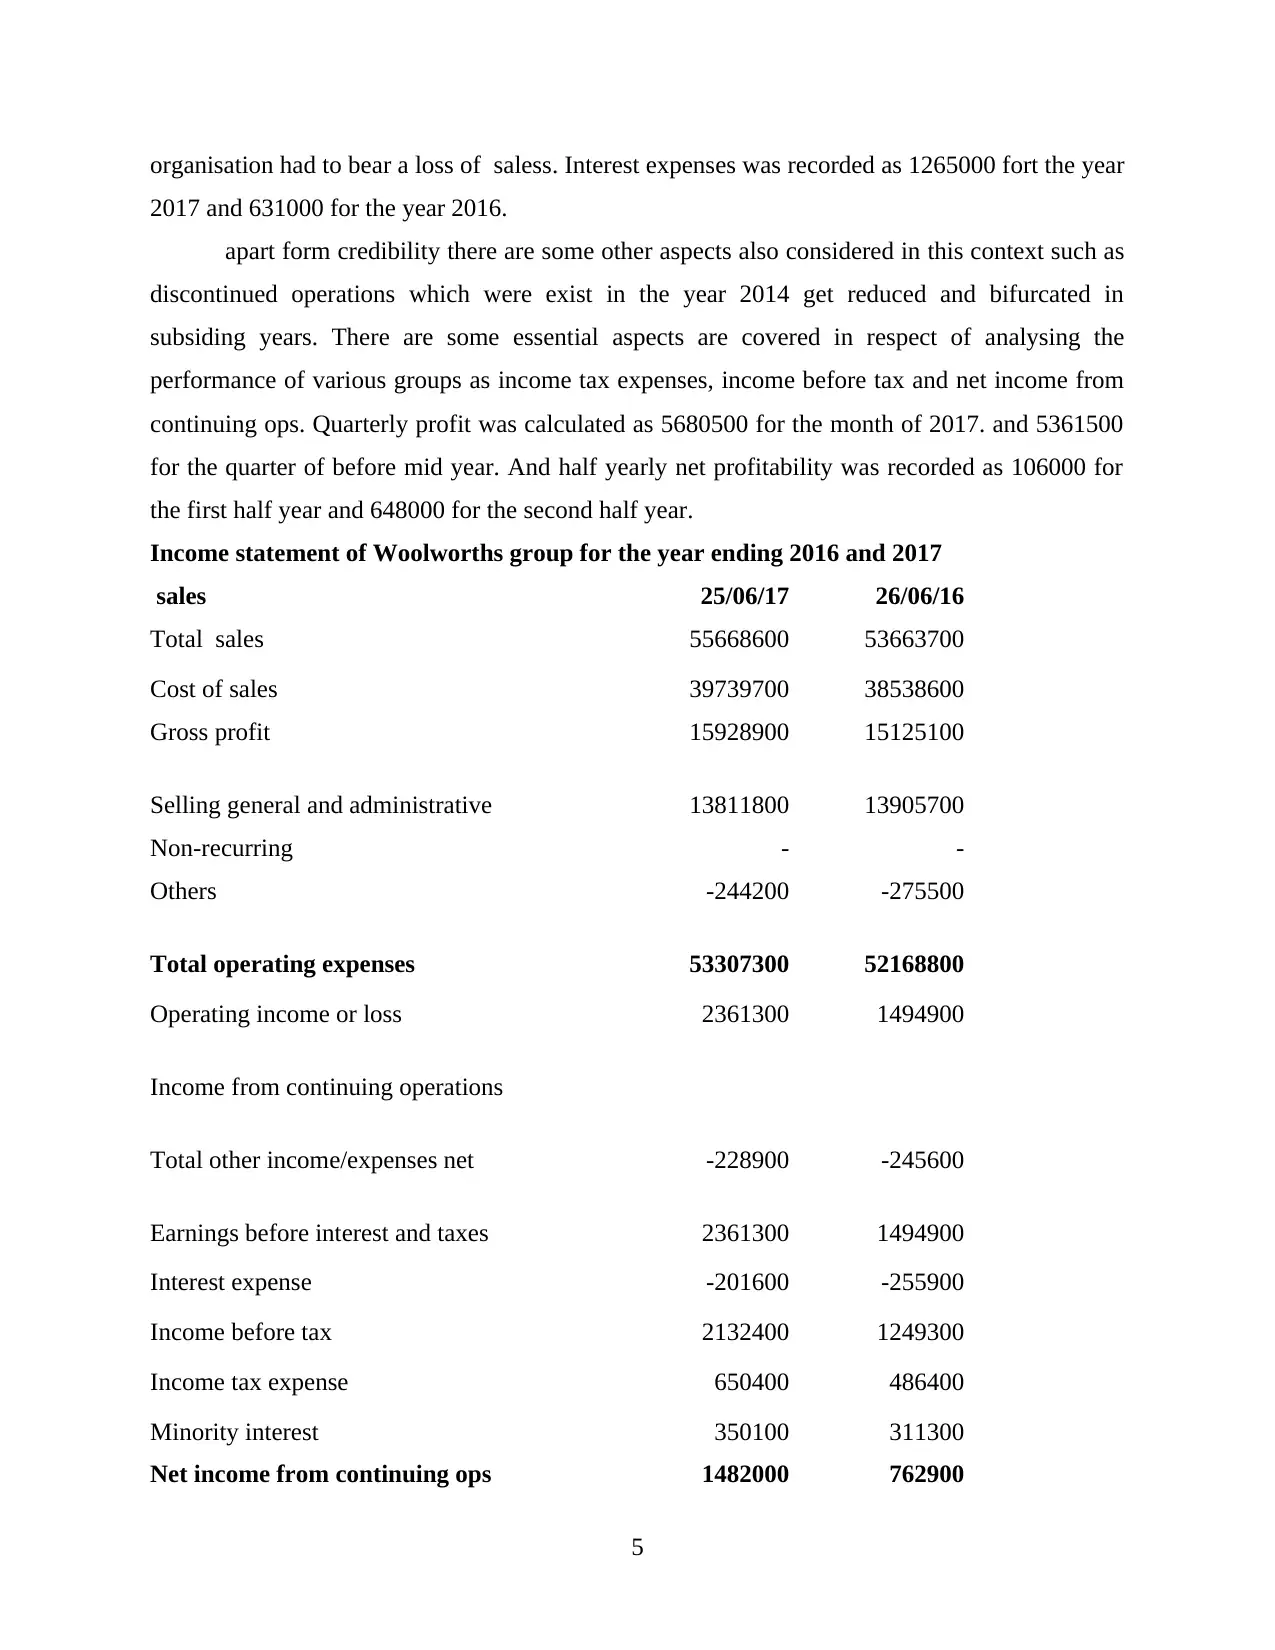
organisation had to bear a loss of saless. Interest expenses was recorded as 1265000 fort the year
2017 and 631000 for the year 2016.
apart form credibility there are some other aspects also considered in this context such as
discontinued operations which were exist in the year 2014 get reduced and bifurcated in
subsiding years. There are some essential aspects are covered in respect of analysing the
performance of various groups as income tax expenses, income before tax and net income from
continuing ops. Quarterly profit was calculated as 5680500 for the month of 2017. and 5361500
for the quarter of before mid year. And half yearly net profitability was recorded as 106000 for
the first half year and 648000 for the second half year.
Income statement of Woolworths group for the year ending 2016 and 2017
sales 25/06/17 26/06/16
Total sales 55668600 53663700
Cost of sales 39739700 38538600
Gross profit 15928900 15125100
Selling general and administrative 13811800 13905700
Non-recurring - -
Others -244200 -275500
Total operating expenses 53307300 52168800
Operating income or loss 2361300 1494900
Income from continuing operations
Total other income/expenses net -228900 -245600
Earnings before interest and taxes 2361300 1494900
Interest expense -201600 -255900
Income before tax 2132400 1249300
Income tax expense 650400 486400
Minority interest 350100 311300
Net income from continuing ops 1482000 762900
5
Paraphrase This Document
Need a fresh take? Get an instant paraphrase of this document with our AI Paraphraser
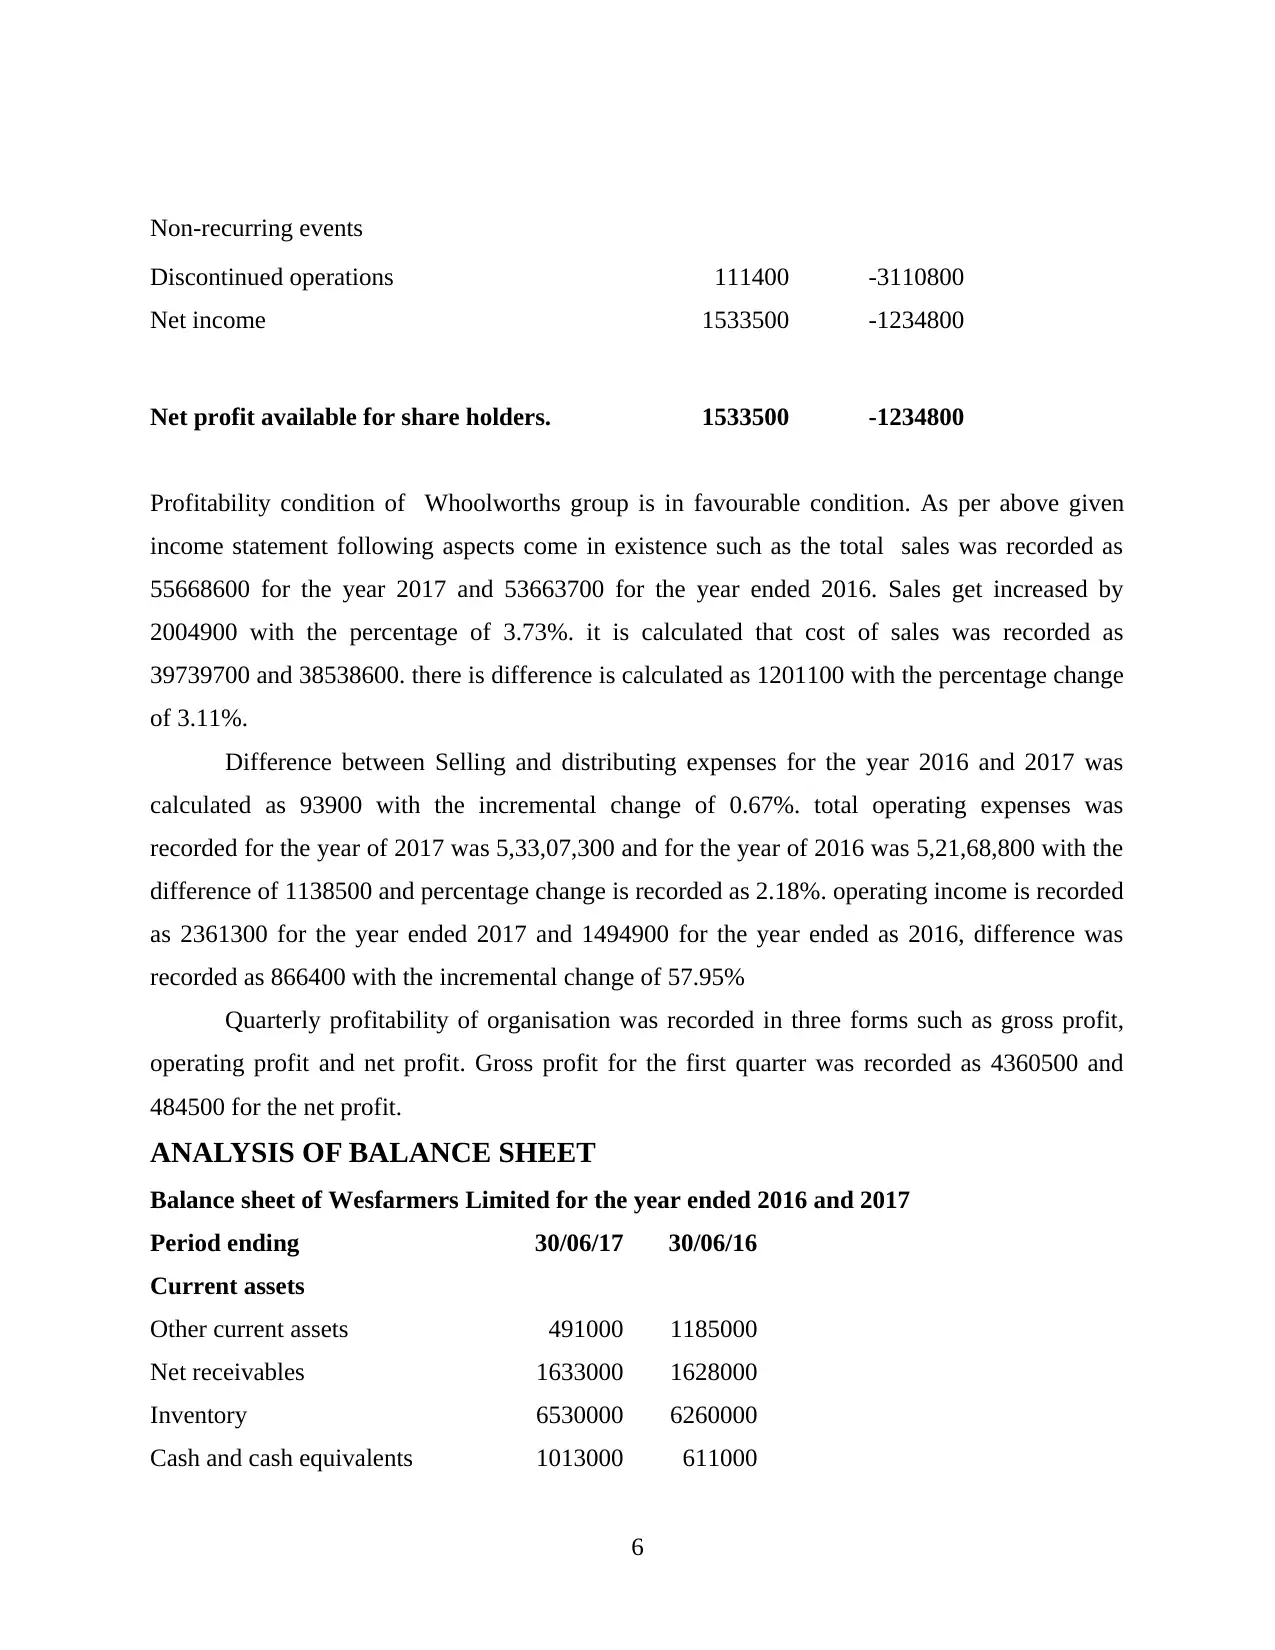
Non-recurring events
Discontinued operations 111400 -3110800
Net income 1533500 -1234800
Net profit available for share holders. 1533500 -1234800
Profitability condition of Whoolworths group is in favourable condition. As per above given
income statement following aspects come in existence such as the total sales was recorded as
55668600 for the year 2017 and 53663700 for the year ended 2016. Sales get increased by
2004900 with the percentage of 3.73%. it is calculated that cost of sales was recorded as
39739700 and 38538600. there is difference is calculated as 1201100 with the percentage change
of 3.11%.
Difference between Selling and distributing expenses for the year 2016 and 2017 was
calculated as 93900 with the incremental change of 0.67%. total operating expenses was
recorded for the year of 2017 was 5,33,07,300 and for the year of 2016 was 5,21,68,800 with the
difference of 1138500 and percentage change is recorded as 2.18%. operating income is recorded
as 2361300 for the year ended 2017 and 1494900 for the year ended as 2016, difference was
recorded as 866400 with the incremental change of 57.95%
Quarterly profitability of organisation was recorded in three forms such as gross profit,
operating profit and net profit. Gross profit for the first quarter was recorded as 4360500 and
484500 for the net profit.
ANALYSIS OF BALANCE SHEET
Balance sheet of Wesfarmers Limited for the year ended 2016 and 2017
Period ending 30/06/17 30/06/16
Current assets
Other current assets 491000 1185000
Net receivables 1633000 1628000
Inventory 6530000 6260000
Cash and cash equivalents 1013000 611000
6
Total current assets 9667000 9684000
Property plant and equipment 9440000 9612000
Other assets 1369000 1809000
Long-term investments 703000 605000
Intangible assets 4576000 4625000
Goodwill 14360000 14448000
Deferred long-term asset charges 971000 1042000
Total assets 40115000 40783000
Current liabilities
Accounts payable 6615000 6491000
Other current liabilities 1028000 845000
Short/current long-term debt 5413000 7303000
Total current liabilities 10417000 10424000
Long-term debt 4066000 5671000
Other liabilities 1691000 1739000
Total liabilities 16174000 17834000
Stockholders' equity
Treasury stock 164000 138000
Retained earnings 1509000 874000
Other stockholder equity 164000 138000
Common stock 22268000 21937000
Total stockholder equity 23941000 22949000
Net tangible assets 5005000 3876000
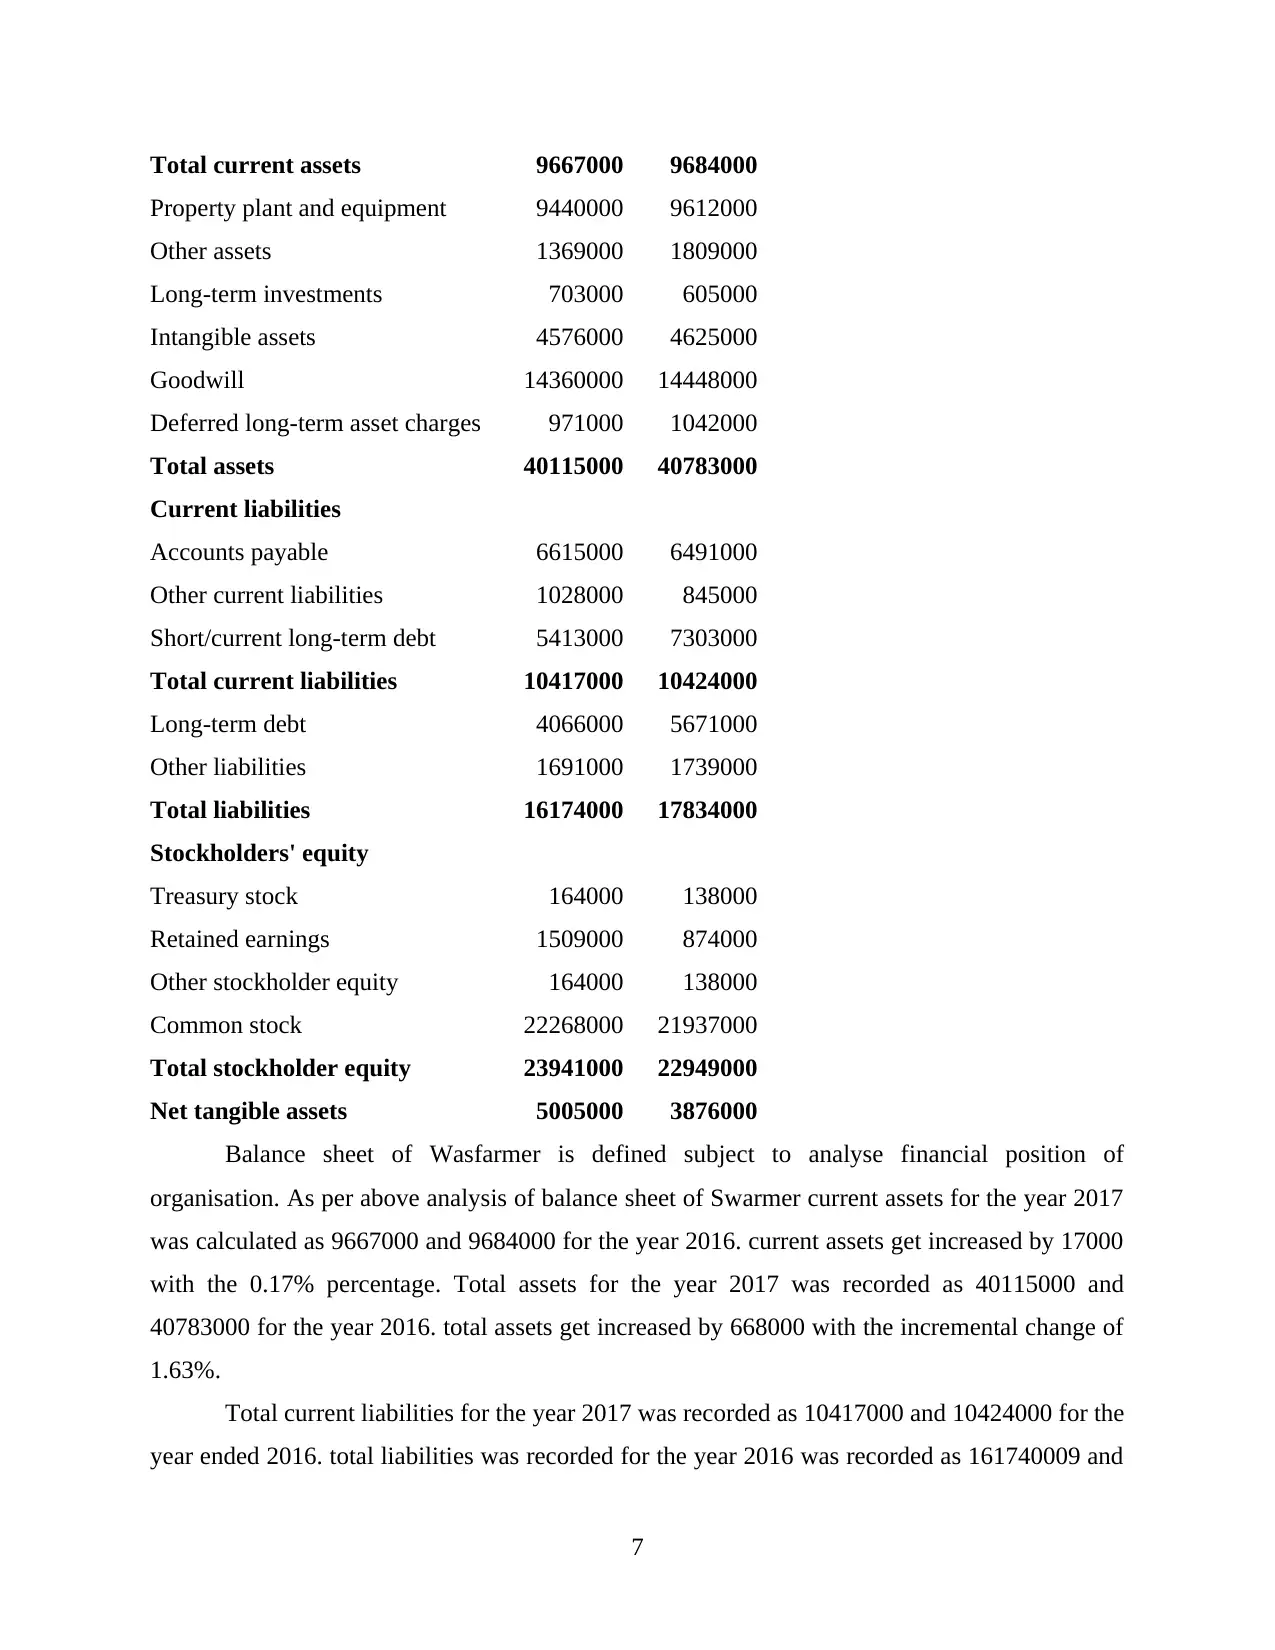
Balance sheet of Wasfarmer is defined subject to analyse financial position of
organisation. As per above analysis of balance sheet of Swarmer current assets for the year 2017
was calculated as 9667000 and 9684000 for the year 2016. current assets get increased by 17000
with the 0.17% percentage. Total assets for the year 2017 was recorded as 40115000 and
40783000 for the year 2016. total assets get increased by 668000 with the incremental change of
1.63%.
Total current liabilities for the year 2017 was recorded as 10417000 and 10424000 for the
year ended 2016. total liabilities was recorded for the year 2016 was recorded as 161740009 and
7
Property plant and equipment 9440000 9612000
Other assets 1369000 1809000
Long-term investments 703000 605000
Intangible assets 4576000 4625000
Goodwill 14360000 14448000
Deferred long-term asset charges 971000 1042000
Total assets 40115000 40783000
Current liabilities
Accounts payable 6615000 6491000
Other current liabilities 1028000 845000
Short/current long-term debt 5413000 7303000
Total current liabilities 10417000 10424000
Long-term debt 4066000 5671000
Other liabilities 1691000 1739000
Total liabilities 16174000 17834000
Stockholders' equity
Treasury stock 164000 138000
Retained earnings 1509000 874000
Other stockholder equity 164000 138000
Common stock 22268000 21937000
Total stockholder equity 23941000 22949000
Net tangible assets 5005000 3876000
Balance sheet of Wasfarmer is defined subject to analyse financial position of
organisation. As per above analysis of balance sheet of Swarmer current assets for the year 2017
was calculated as 9667000 and 9684000 for the year 2016. current assets get increased by 17000
with the 0.17% percentage. Total assets for the year 2017 was recorded as 40115000 and
40783000 for the year 2016. total assets get increased by 668000 with the incremental change of
1.63%.
Total current liabilities for the year 2017 was recorded as 10417000 and 10424000 for the
year ended 2016. total liabilities was recorded for the year 2016 was recorded as 161740009 and
7
⊘ This is a preview!⊘
Do you want full access?
Subscribe today to unlock all pages.
Trusted by 1+ million students worldwide
17834000 for the year ended 2017. stockholder's equity was recorded as 23941000 for the year
2016 and 22949000 for the year 2016. net tangible assets were recorded as 5005000 for the year
2017 and 3876000 for the year ended 2013. overall changes are seen towards incremental change
in respect of tangible and intangible assets.
Balance sheet of Woolworths groups for the year ended 2016 and 2017
Period ending 25/06/17 26/06/16
Current assets
Other current assets 1259700 1156500
Net receivables 410500 433500
Inventory 4080400 4558500
Cash and cash equivalents 909400 948100
Total current assets 6994200 7427000
Property plant and equipment 8437500 8262800
Other assets 833100 1113300
Long-term investments 118200 108500
Intangible assets 2316400 2341000
Goodwill 4216400 4249600
Deferred long-term asset charges 372300 497700
Total assets 22915800 23502200
Current liabilities
Short/current long-term debt 3030500 4361600
Other current liabilities 1168800 1511800
Accounts payable 5068200 4809100
Total current liabilities 8824200 8992700
Other liabilities 1438500 1856700
Minority interest 350100 311300
Long-term debt 2774700 3868000
Total liabilities 13039700 14720300
Stockholders' equity
Treasury stock 252300 246700
Retained earnings 3554700 2876900
8
Paraphrase This Document
Need a fresh take? Get an instant paraphrase of this document with our AI Paraphraser
Other stockholder equity 252300 246700
Common stock 5719000 5347000
Total stockholder equity 9526000 8470600
Net tangible assets 2993200 1880000
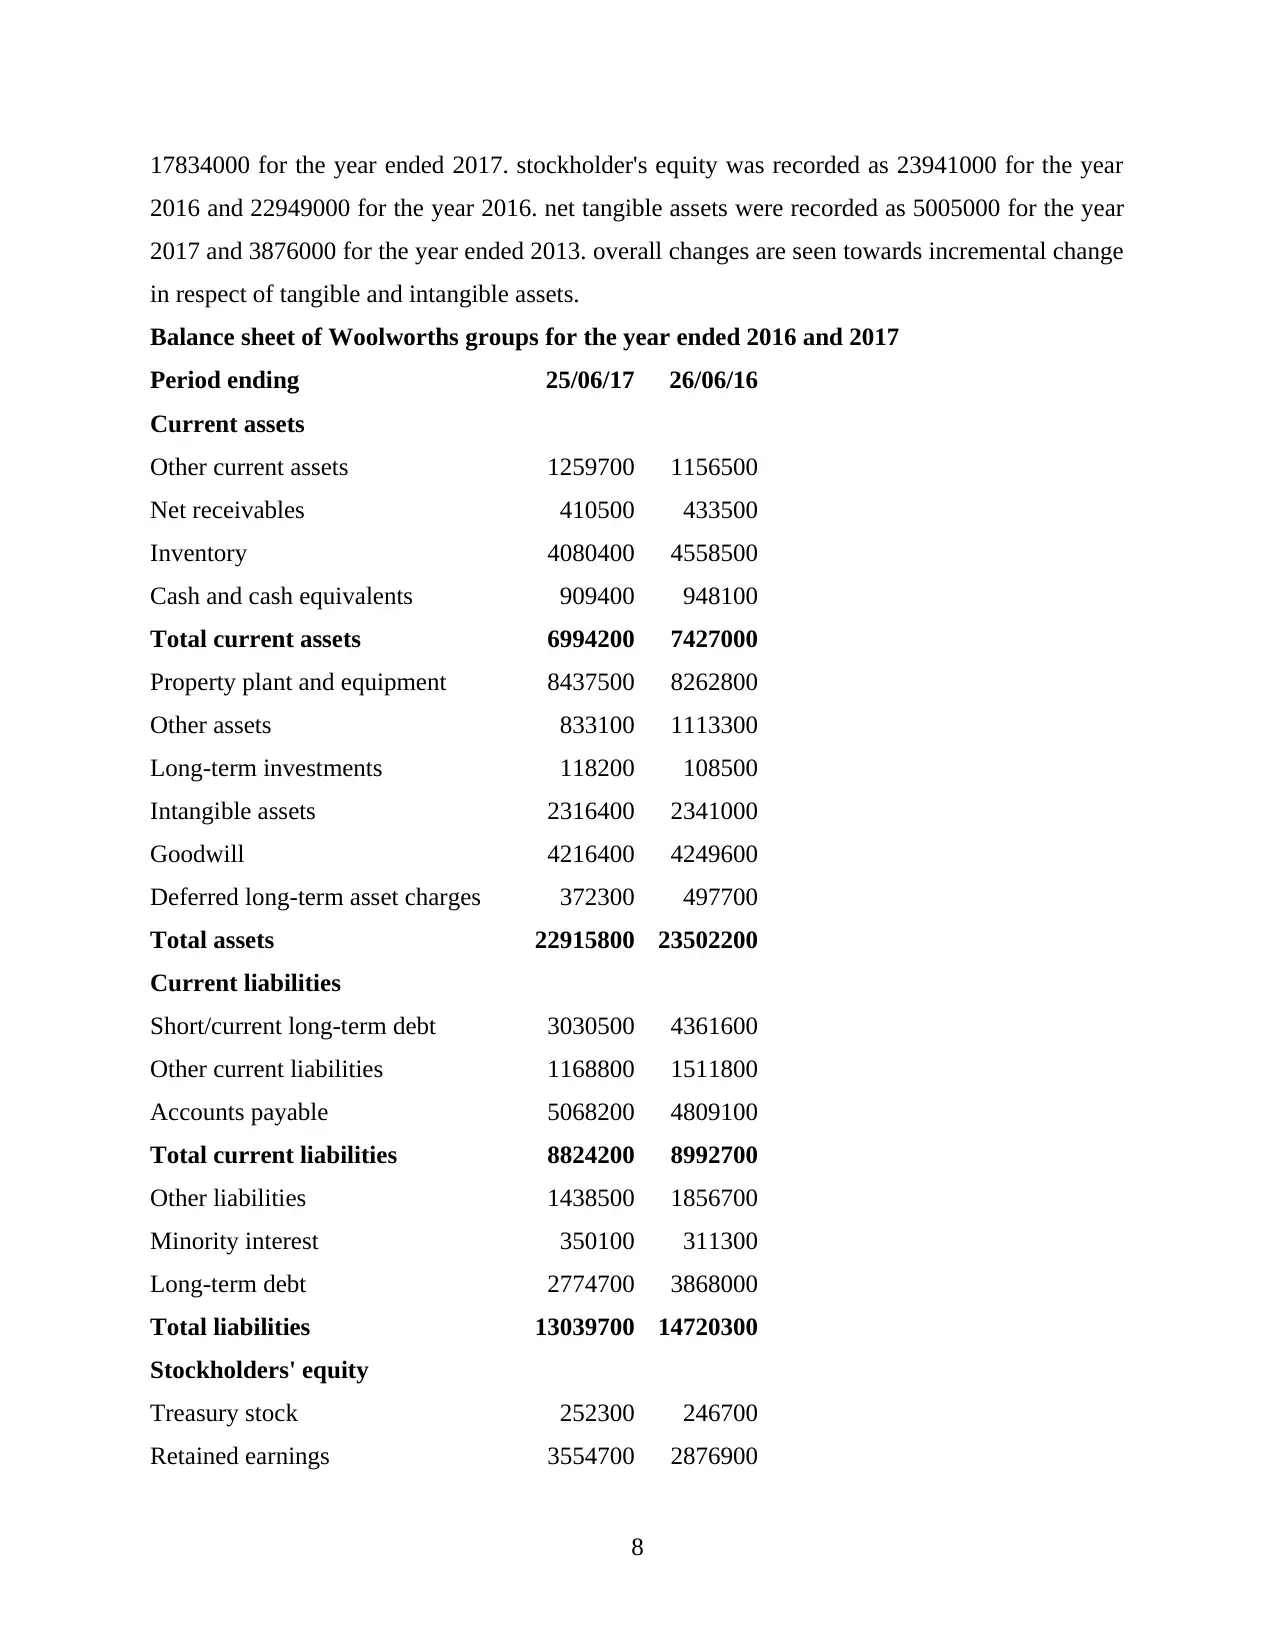
Financial position of Woolworths groups shows following results in terms of
sustainability. As per balance sheet figures of 2017 and 2016 was recorded in three terms such as
current assets, total assets, current liabilities and total liabilities and stock holders equity. Current
assets for the year 2017 was recorded as $6964200 and $7427000 for the year 2016. current
assets get decreased in the year 2017 by 462800 with the incremental change of 6.23%. total
assets were recorded for the year 2017 was 22915800 and 23502200 for the year 2016,
difference with 586400 and 2.50% incremental changes.
Current liabilities for the year ended 2017 was calculated as $8824200 and $8992700 for
the year 2016. current liabilities get decreased by $168500 in 2017 due to repayment of short
term debts and payment to creditors. Total liabilities was recorded as 13039700 for the year
2016 and 14720300 for the year 2016, percentage difference was calculated as 11.41%. stock
holder's equity was recorded as 9526000 for the year 2017 and 8470600 for the year ended 2016.
this change in stock holders's equity as 11.079%.
ANALYSIS OF CASH FLOWS
Cash flow statement of Wesfarners of financial year 2016 and 2017
Period ending 30/06/17 30/06/16
Net income 2873000 407000
Operating activities, cash flow provided by or used in
Depreciation 1126000 1175000
Changes in other operating activities -104000 29000
Changes in liabilities 204000 -88000
Changes in inventory -296000 -444000
Changes in accounts receivable 87000 17000
Adjustments to net income -106000 2153000
Total cash flow from operating activities 4226000 3365000
Investment activities, cash flow provided by or used in
9
Common stock 5719000 5347000
Total stockholder equity 9526000 8470600
Net tangible assets 2993200 1880000
Financial position of Woolworths groups shows following results in terms of
sustainability. As per balance sheet figures of 2017 and 2016 was recorded in three terms such as
current assets, total assets, current liabilities and total liabilities and stock holders equity. Current
assets for the year 2017 was recorded as $6964200 and $7427000 for the year 2016. current
assets get decreased in the year 2017 by 462800 with the incremental change of 6.23%. total
assets were recorded for the year 2017 was 22915800 and 23502200 for the year 2016,
difference with 586400 and 2.50% incremental changes.
Current liabilities for the year ended 2017 was calculated as $8824200 and $8992700 for
the year 2016. current liabilities get decreased by $168500 in 2017 due to repayment of short
term debts and payment to creditors. Total liabilities was recorded as 13039700 for the year
2016 and 14720300 for the year 2016, percentage difference was calculated as 11.41%. stock
holder's equity was recorded as 9526000 for the year 2017 and 8470600 for the year ended 2016.
this change in stock holders's equity as 11.079%.
ANALYSIS OF CASH FLOWS
Cash flow statement of Wesfarners of financial year 2016 and 2017
Period ending 30/06/17 30/06/16
Net income 2873000 407000
Operating activities, cash flow provided by or used in
Depreciation 1126000 1175000
Changes in other operating activities -104000 29000
Changes in liabilities 204000 -88000
Changes in inventory -296000 -444000
Changes in accounts receivable 87000 17000
Adjustments to net income -106000 2153000
Total cash flow from operating activities 4226000 3365000
Investment activities, cash flow provided by or used in
9
Capital expenditure -1559000 -1794000
Investments -2000 -2000
Other cash flow from investment activities - -
Total cash flow from investment activities -53000 -2132000
Financing activities, cash flow provided by or used in
Sale purchase of stock 1000 1000
Net borrowings -1774000 936000
Dividends paid -1998000 -2270000
Total cash flow from financing activities -3771000 -1333000
Change in cash and cash equivalents 402000 -100000
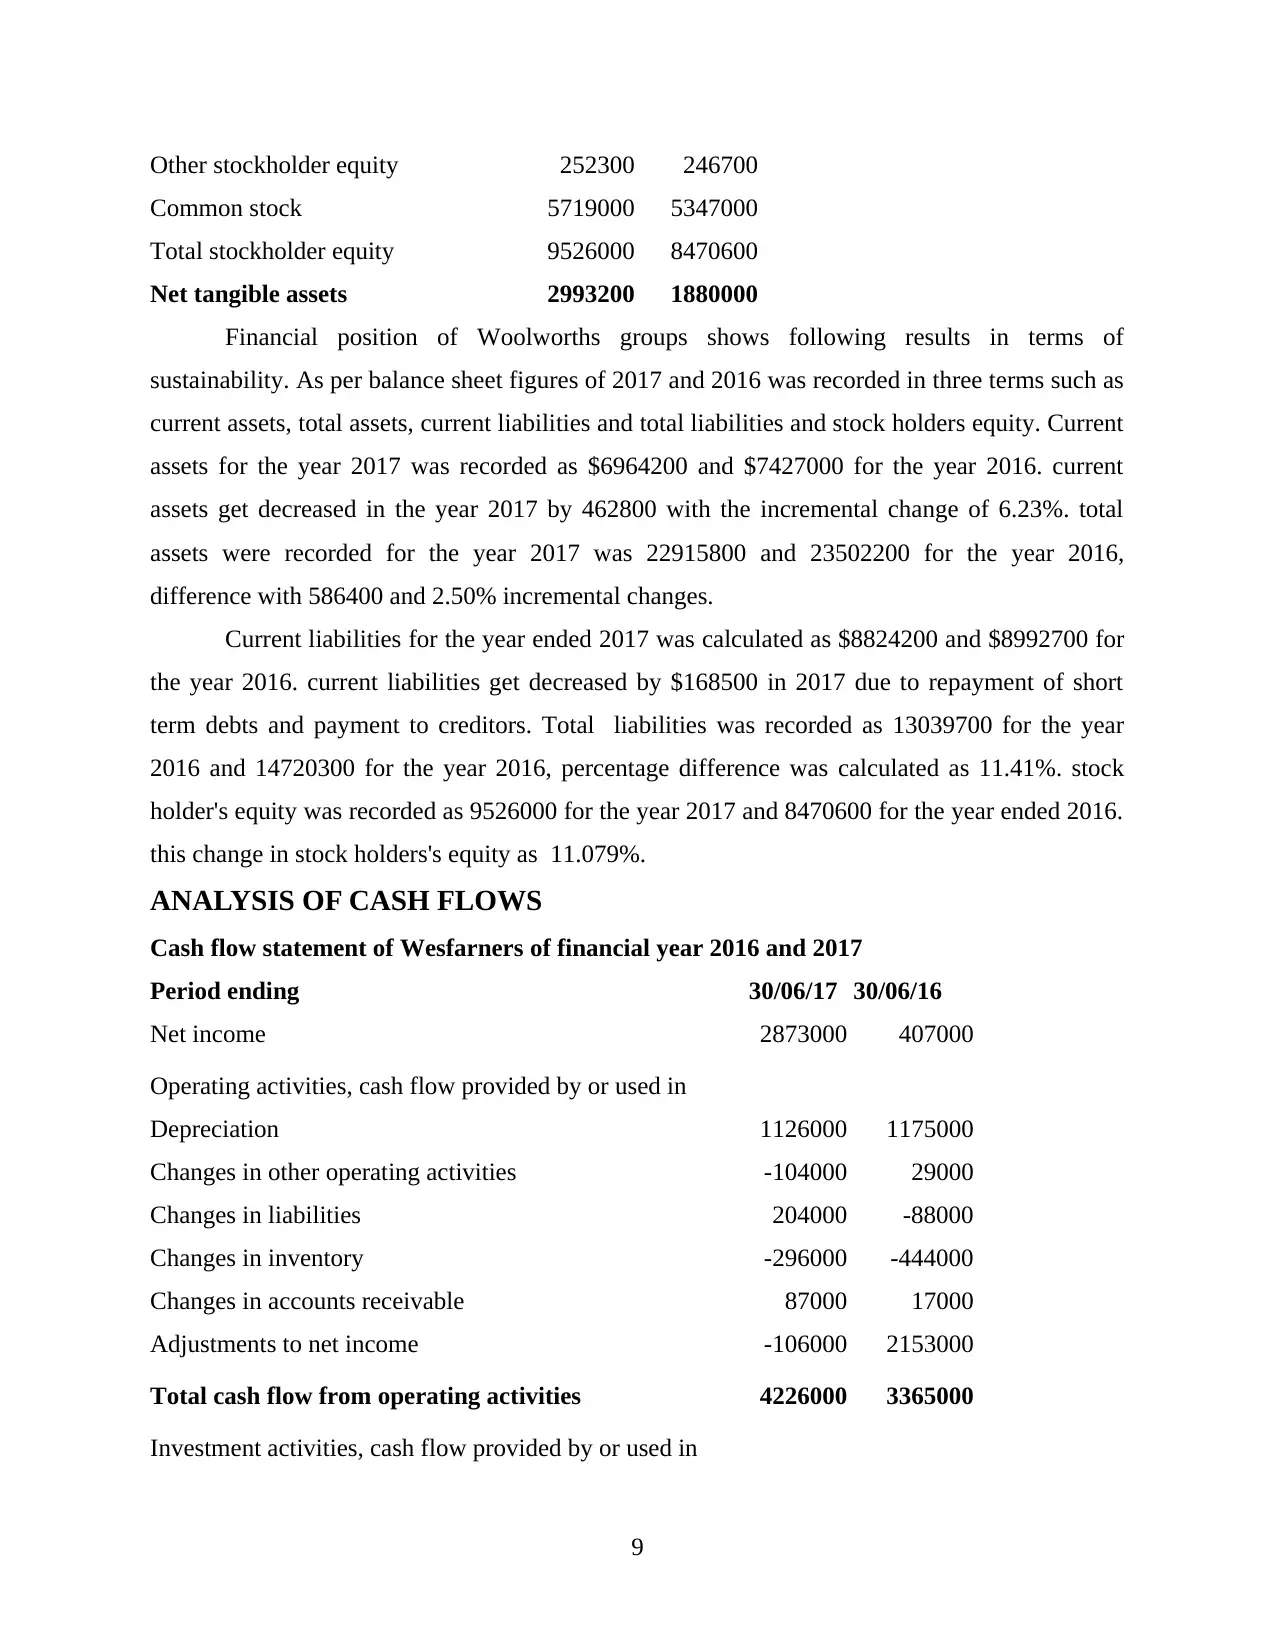
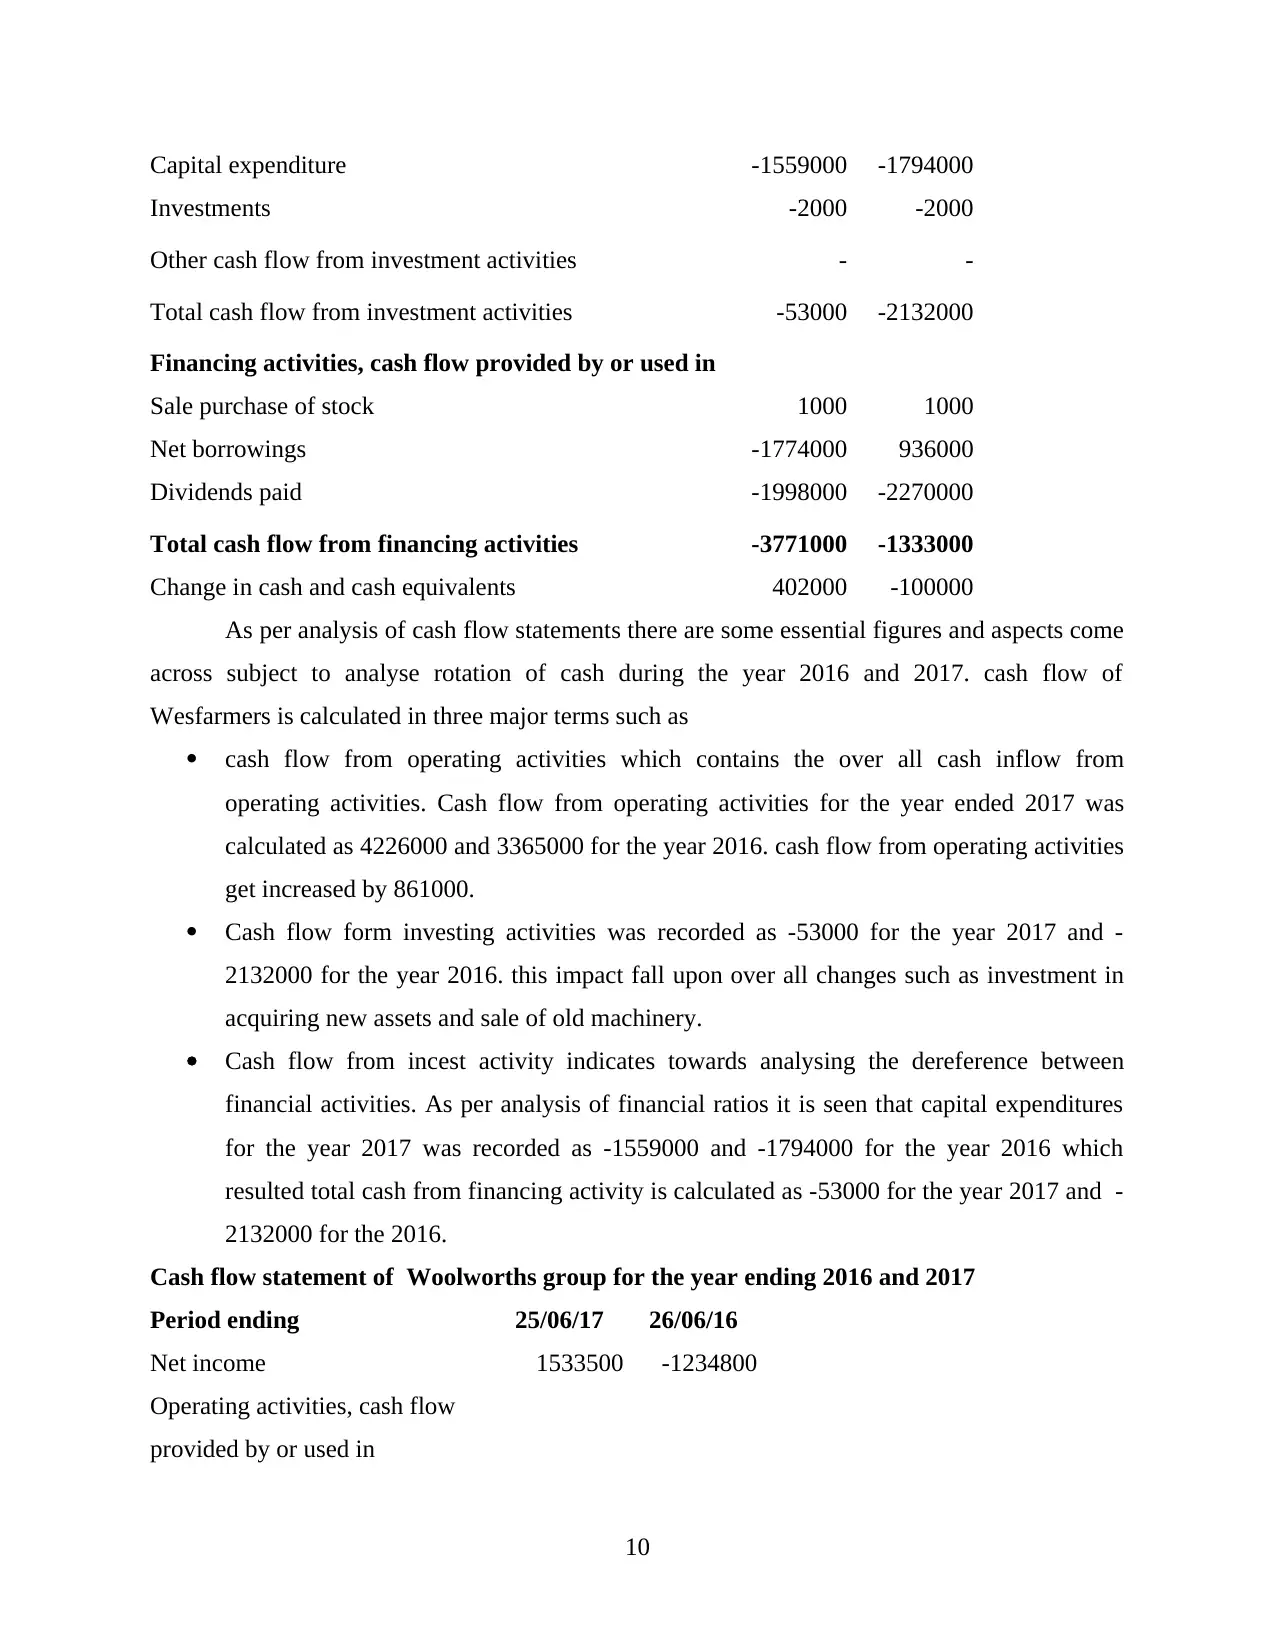
As per analysis of cash flow statements there are some essential figures and aspects come
across subject to analyse rotation of cash during the year 2016 and 2017. cash flow of
Wesfarmers is calculated in three major terms such as
cash flow from operating activities which contains the over all cash inflow from
operating activities. Cash flow from operating activities for the year ended 2017 was
calculated as 4226000 and 3365000 for the year 2016. cash flow from operating activities
get increased by 861000.
Cash flow form investing activities was recorded as -53000 for the year 2017 and -
2132000 for the year 2016. this impact fall upon over all changes such as investment in
acquiring new assets and sale of old machinery.
Cash flow from incest activity indicates towards analysing the dereference between
financial activities. As per analysis of financial ratios it is seen that capital expenditures
for the year 2017 was recorded as -1559000 and -1794000 for the year 2016 which
resulted total cash from financing activity is calculated as -53000 for the year 2017 and -
2132000 for the 2016.
Cash flow statement of Woolworths group for the year ending 2016 and 2017
Period ending 25/06/17 26/06/16
Net income 1533500 -1234800
Operating activities, cash flow
provided by or used in
10
Investments -2000 -2000
Other cash flow from investment activities - -
Total cash flow from investment activities -53000 -2132000
Financing activities, cash flow provided by or used in
Sale purchase of stock 1000 1000
Net borrowings -1774000 936000
Dividends paid -1998000 -2270000
Total cash flow from financing activities -3771000 -1333000
Change in cash and cash equivalents 402000 -100000
As per analysis of cash flow statements there are some essential figures and aspects come
across subject to analyse rotation of cash during the year 2016 and 2017. cash flow of
Wesfarmers is calculated in three major terms such as
cash flow from operating activities which contains the over all cash inflow from
operating activities. Cash flow from operating activities for the year ended 2017 was
calculated as 4226000 and 3365000 for the year 2016. cash flow from operating activities
get increased by 861000.
Cash flow form investing activities was recorded as -53000 for the year 2017 and -
2132000 for the year 2016. this impact fall upon over all changes such as investment in
acquiring new assets and sale of old machinery.
Cash flow from incest activity indicates towards analysing the dereference between
financial activities. As per analysis of financial ratios it is seen that capital expenditures
for the year 2017 was recorded as -1559000 and -1794000 for the year 2016 which
resulted total cash from financing activity is calculated as -53000 for the year 2017 and -
2132000 for the 2016.
Cash flow statement of Woolworths group for the year ending 2016 and 2017
Period ending 25/06/17 26/06/16
Net income 1533500 -1234800
Operating activities, cash flow
provided by or used in
10
⊘ This is a preview!⊘
Do you want full access?
Subscribe today to unlock all pages.
Trusted by 1+ million students worldwide
1 out of 16
Related Documents


Your All-in-One AI-Powered Toolkit for Academic Success.
+13062052269
info@desklib.com
Available 24*7 on WhatsApp / Email
![[object Object]](/_next/static/media/star-bottom.7253800d.svg)
Unlock your academic potential
Copyright © 2020–2026 A2Z Services. All Rights Reserved. Developed and managed by ZUCOL.