Financial Performance Analysis: Accounting and Finance Report

Verified

Added on  2022/12/23

|12
|1682
|23
Report
AI Summary
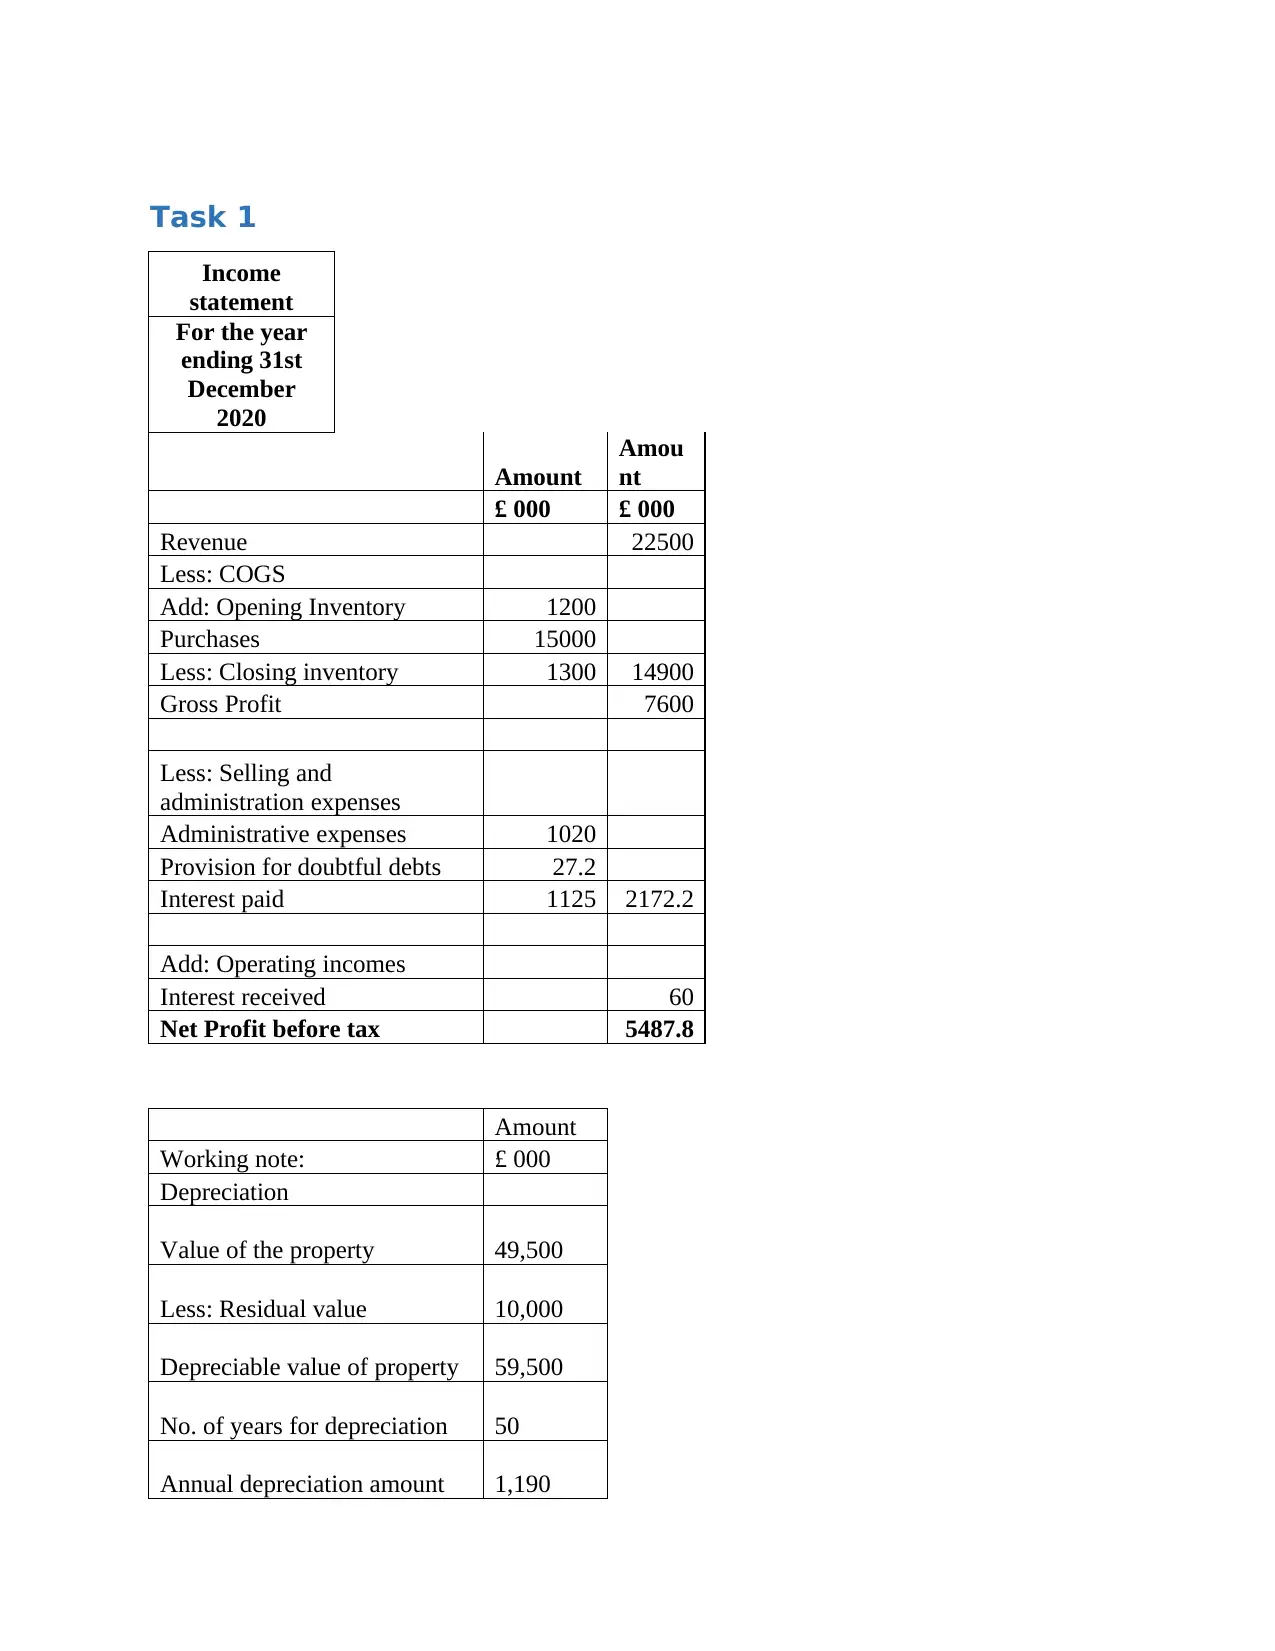
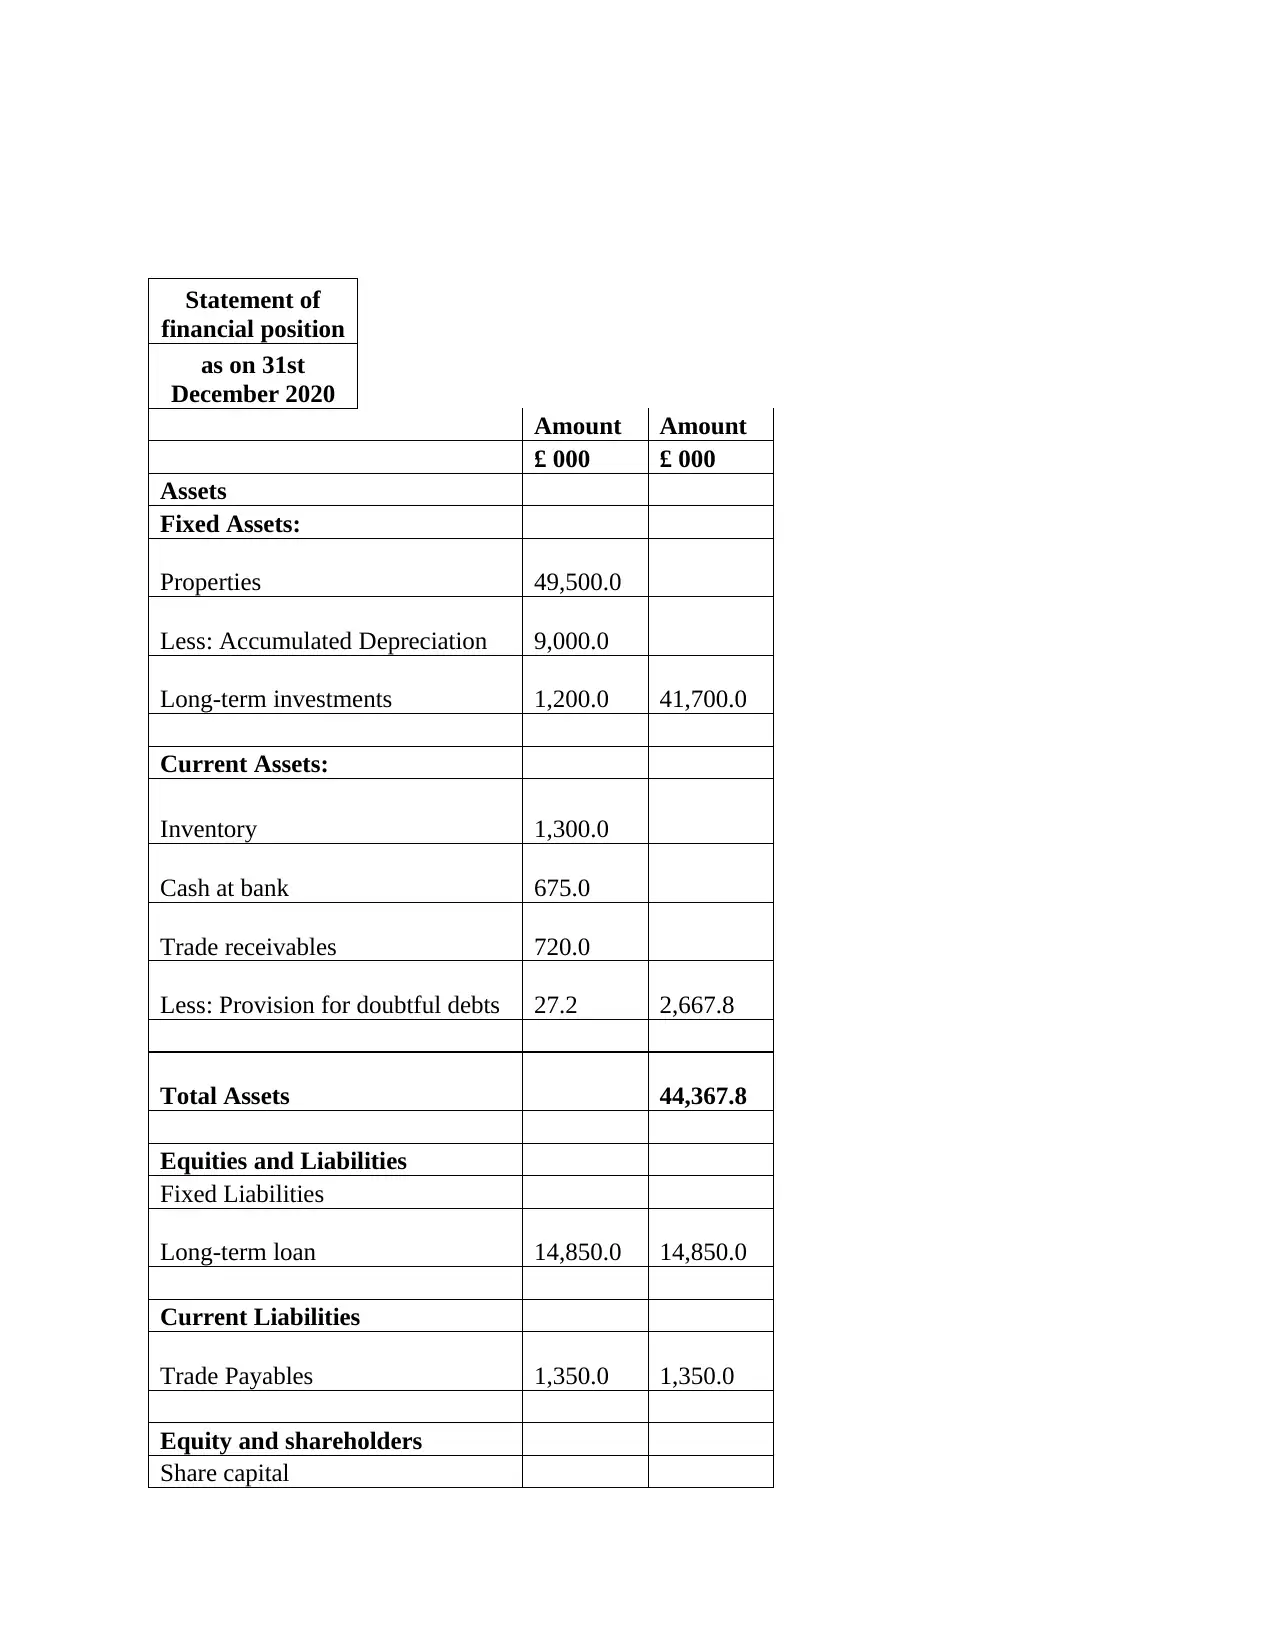
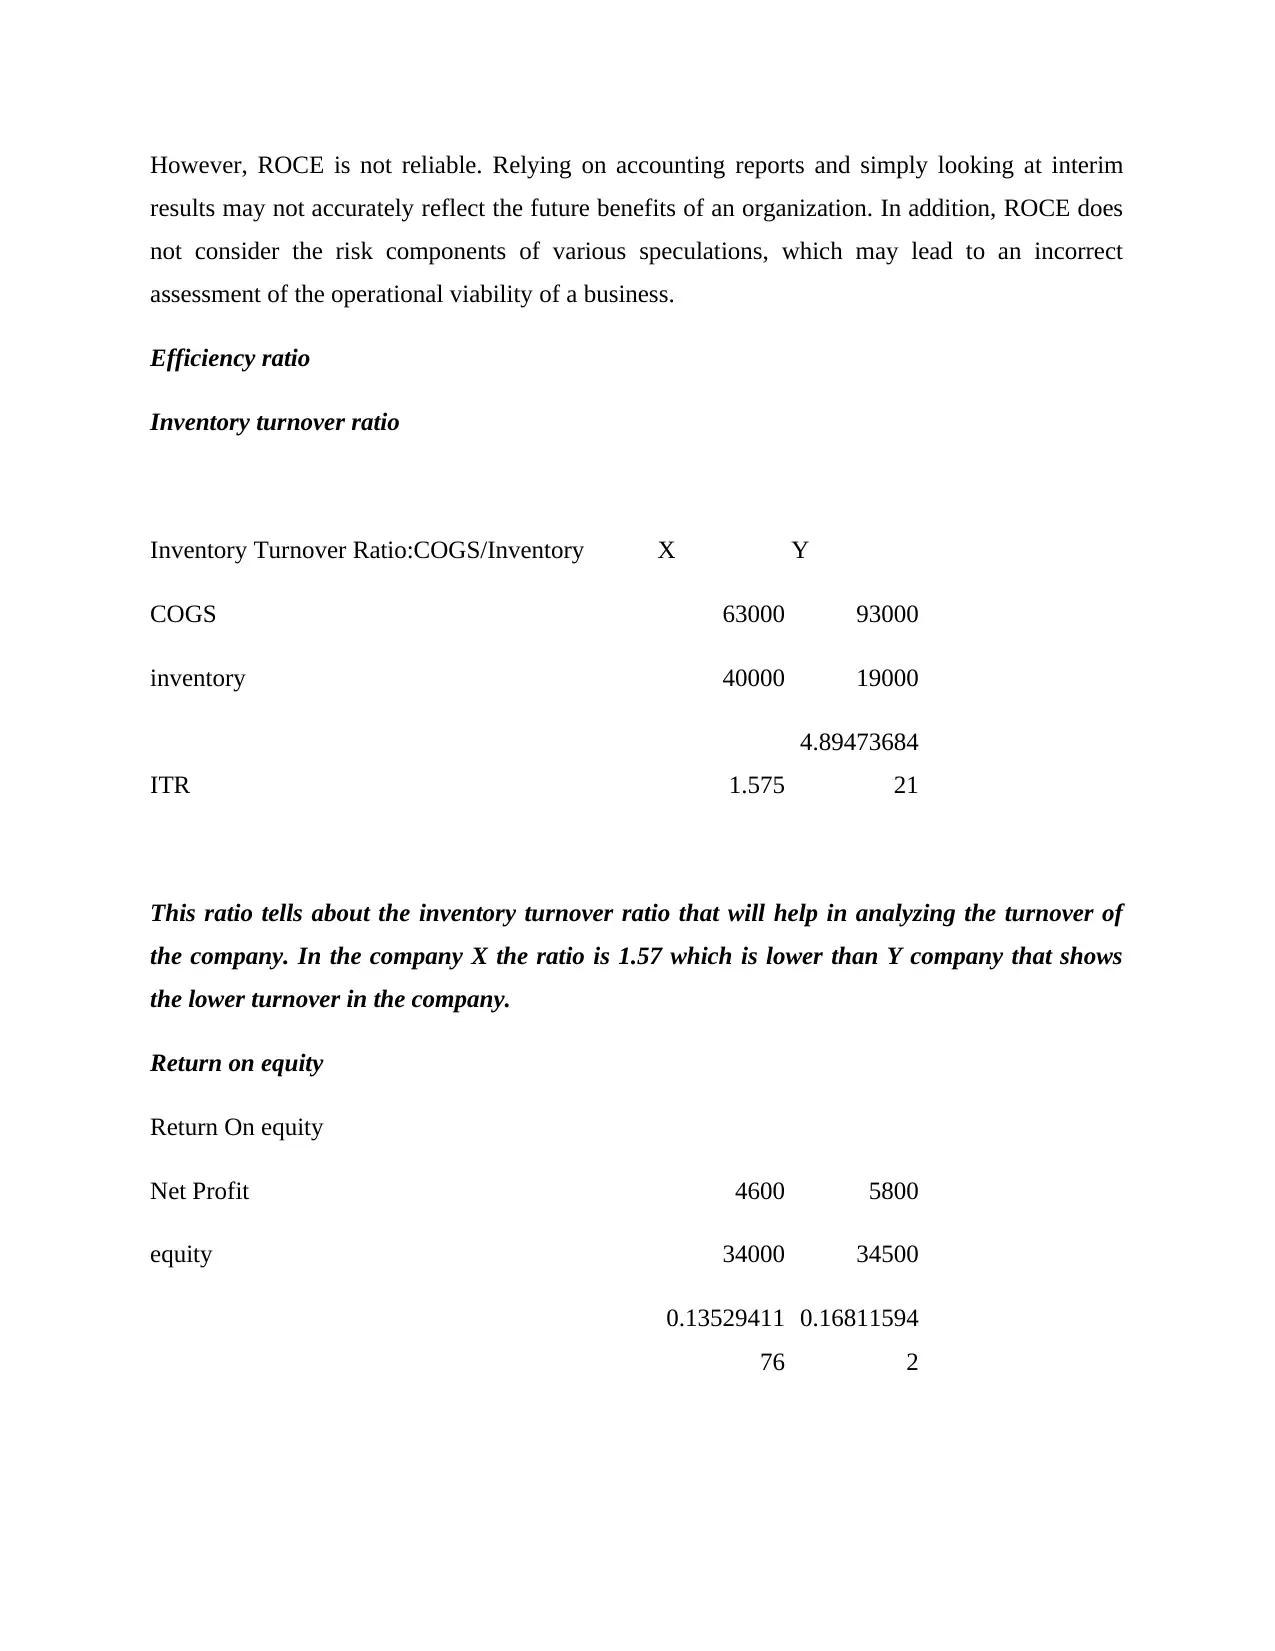
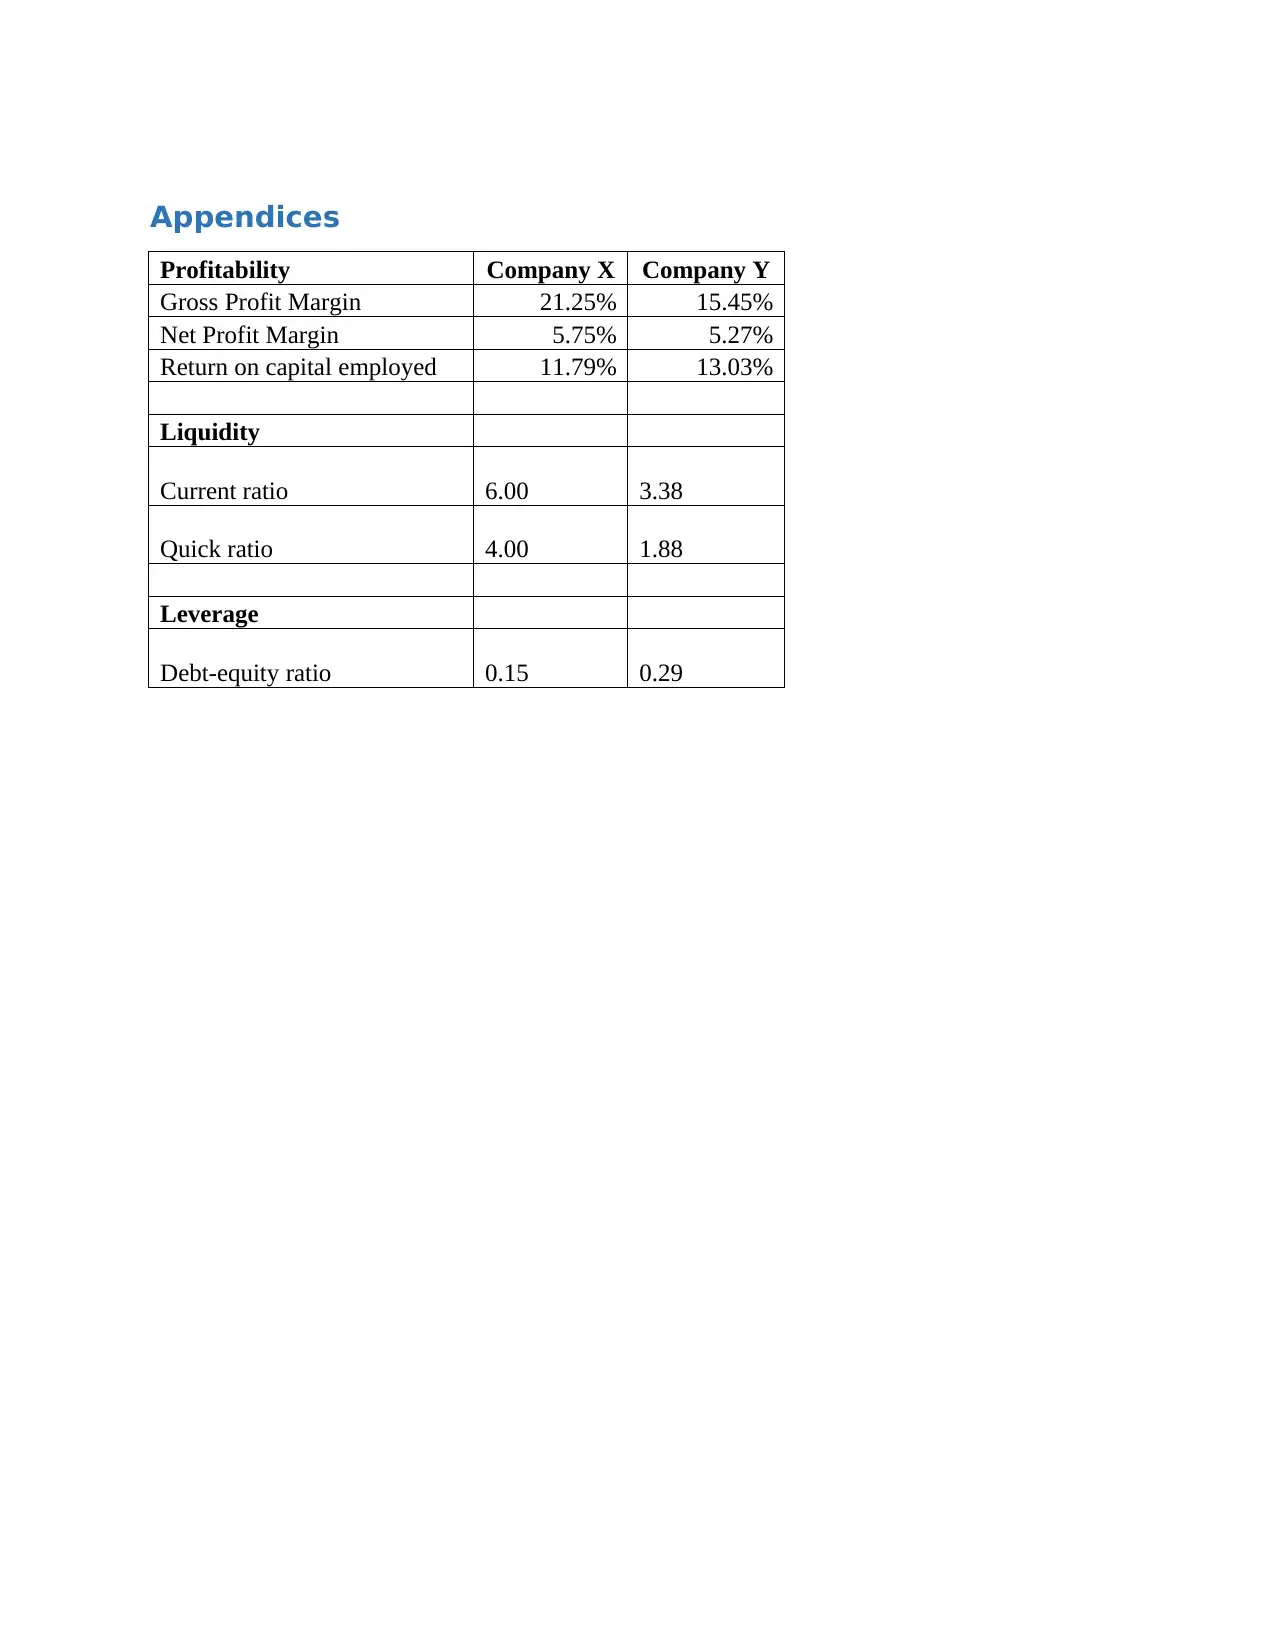
This report provides a comprehensive analysis of financial statements and ratio analysis. It begins with an income statement and a statement of financial position, followed by an in-depth examination of various financial ratios. The report covers profitability ratios such as gross profit margin and net profit margin, efficiency ratios including inventory turnover, and return on capital employed (ROCE). The analysis compares the financial performance of two companies (X and Y), highlighting their strengths and weaknesses based on the calculated ratios. The report also includes recommendations for improvement and discusses the advantages and disadvantages of using different financial ratios. The appendices provide a summary of key ratios for both companies, facilitating a clear comparison of their financial performance.
Document Page
Introduction to Accounting & Finance
tabler-icon-diamond-filled.svg

Paraphrase This Document

Need a fresh take? Get an instant paraphrase of this document with our AI Paraphraser
Document Page
Table of Contents
Task 1...............................................................................................................................................3
Task 2...............................................................................................................................................5
References......................................................................................................................................10
Appendices.....................................................................................................................................11
Document Page
Task 1
Income
statement
For the year
ending 31st
December
2020
Amount
Amou
nt
£ 000 £ 000
Revenue 22500
Less: COGS
Add: Opening Inventory 1200
Purchases 15000
Less: Closing inventory 1300 14900
Gross Profit 7600
Less: Selling and
administration expenses
Administrative expenses 1020
Provision for doubtful debts 27.2
Interest paid 1125 2172.2
Add: Operating incomes
Interest received 60
Net Profit before tax 5487.8
Amount
Working note: £ 000
Depreciation
Value of the property 49,500
Less: Residual value 10,000
Depreciable value of property 59,500
No. of years for depreciation 50
Annual depreciation amount 1,190
Document Page
Statement of
financial position
as on 31st
December 2020
Amount Amount
£ 000 £ 000
Assets
Fixed Assets:
Properties 49,500.0
Less: Accumulated Depreciation 9,000.0
Long-term investments 1,200.0 41,700.0
Current Assets:
Inventory 1,300.0
Cash at bank 675.0
Trade receivables 720.0
Less: Provision for doubtful debts 27.2 2,667.8
Total Assets 44,367.8
Equities and Liabilities
Fixed Liabilities
Long-term loan 14,850.0 14,850.0
Current Liabilities
Trade Payables 1,350.0 1,350.0
Equity and shareholders
Share capital
tabler-icon-diamond-filled.svg

Paraphrase This Document

Need a fresh take? Get an instant paraphrase of this document with our AI Paraphraser
Document Page
12,600.0
Retained profits b/f 10,080.0
Retained profits c/f 5,487.8 28,167.8
Total Liabilities 44,367.8
Task 2
Ratio analysis can be identified as the way to find out the cash allowances used to show the
growth of an organization's cash performance that uses not many of allowances such as cash,
profit, handling, liability, liability, capacity and allowance inclusion and very few of these
allowances return value, normal share, bribe allowance, profit payment allowance, duty
allowance value, etc.
Profitability Ratios
1. Gross Profit margin
Profitability ratio
Gross profit ratio: GP/sales*100 X Y
Gross profit 17000 17000
Net sales 80000 110000
GP Ratio 0.21 0.15
Gross profit margin is a portion of money that administrators use to evaluate the effectiveness of
the creation cycle for something sold by the organization or for more than one item. A company
may be able to supply and sell one thing better than another. The total revenue for each item can
be determined as long as the company can separate the immediate costs of creating each item
Document Page
from the others. The cost of goods sold on a payroll call for a group represents the immediate
costs of creating their products.
The performance analyses of both X and Y Company reveals that gross profit margin of
Company X is 21.25% and Company Y has 15.45%; thus Company X has perform well as
compared with Company Y.
Recommendation:
Company Y requires either focusing on increase product price or reducing cost of goods sold to
improve gross profit margin.
Advantages:
1. Simple and credible indication: it is not difficult to identify and show cost productivity,
financial strength of the organization, periodic verification of the organization's direct costs and
so on
2. Basis: Set as a basis for estimating other benefit ratios: net gain or occupational benefit, gain
before cost, and gain after loss.
3. Price control: As a rule, organizations adjust the cost to get the maximum benefit.
Disadvantages:
1. It does not accurately reflect the operational capability of an organization as it excludes
indirect costs such as compensation, rent, energy and advertising costs and so on.
2. Total gross revenue is not generally an appropriate criterion for departmental reviews as there
are changes in cost collection and benefit guarantee between companies.
3. Estimate the company’s profit only and omit a number of factors, for example, an increase in
creation costs to find a supplier or a reduction in the cost of the offer to build a piece of the pan
and so on.
2. Net Profit Margin:
Document Page
Net Profit ratio; NP/Net sales*100 X Y
Net Profit 4600 5800
Net sales 80000 110000
Net profit ratio 5.75
5.27272727
27
Net profit allowance (also known as "net income" or "net profit margin ratio") is a cash
allowance used to determine the level of profit an organization makes from income. Estimate the
amount of net income a group receives per dollar of earned income. Total gross income equal to
net profit (also known as full compensation) is divided by total income, reported as the rate.
Company X’s Net profit margin (5.75%) is higher than Company Y’s Net profit Margin (5.27%).
Recommendation: To improve this ratio, Company Y again requires focusing on improving its
gross profit margin.
Advantages
The disadvantage of using this ration is that the administration can control the use of resources
and beyond. Why is the use of resources important? Strong and productive use of resources
directly affects profitability. With the potential utilization of resources, an organization has a
positive impact by providing and selling more units at a similar declining cost in setting pay.
Disadvantages
Organizations from different sectors could not measure based on total net income. For example,
IBM Corporation's total revenue is not equal to Starbucks Corporation. A decline in income may
not be particularly alarming. The group may need to expand their pie by reducing costs and
removing margins. The nature of the organization's approach should also be considered.
tabler-icon-diamond-filled.svg

Paraphrase This Document

Need a fresh take? Get an instant paraphrase of this document with our AI Paraphraser
Document Page
3. Return on Capital Employed
X Y
Earning before tax 6000 7500
Capital emplyesd 35000 24500
Return on capitall employed
0.17142857
14
0.30612244
9
Return on capital employed as a percentage of accounting is applied to cash, valuation and
accounting. It is a valuable measure against the overall productivity of organizations after
considering the amount of capital used. A high and stable ROCE can identify an excellent
organization, as it demonstrates that a company is using its resources. The ROCE is reasonably
different between firms and regions and has changed over the long run, but the average range for
the general market is around 10%.
The ROCE of Company X is 0.17, while Company Y has 0.36 returns on capital employed. The
comparison reveals that Company Y holds stronger position in terms of ROCE despite of having
lower profit margin. The reason is less capital employed applied by Company Y, and less
company is earning higher.
Advantages
ROCE is a reasonable way to oppose the display of organizations in areas of capital risk, such as
the telecommunications industry. This is because it looks at different duties and responsibilities
just like productivity, which gives a clearer understanding of financial performance. Many
lenders consider long-range ROCE to be an important indicator of a company’s display and, as a
rule, a stable and growing ROCE is much more desirable than an invisible ROCE that has been
failing change dramatically for a long time.
Disadvantages
Document Page
However, ROCE is not reliable. Relying on accounting reports and simply looking at interim
results may not accurately reflect the future benefits of an organization. In addition, ROCE does
not consider the risk components of various speculations, which may lead to an incorrect
assessment of the operational viability of a business.
Efficiency ratio
Inventory turnover ratio
Inventory Turnover Ratio:COGS/Inventory X Y
COGS 63000 93000
inventory 40000 19000
ITR 1.575
4.89473684
21
This ratio tells about the inventory turnover ratio that will help in analyzing the turnover of
the company. In the company X the ratio is 1.57 which is lower than Y company that shows
the lower turnover in the company.
Return on equity
Return On equity
Net Profit 4600 5800
equity 34000 34500
0.13529411
76
0.16811594
2
Document Page
This ratio tells about the efficiency of the company that will help in analysing the return on
equity. In the conpany X, return on equity is 0.13 and company Y is 0.16 which is shows lower
efficiency in terms to provide return to its shareholder.
tabler-icon-diamond-filled.svg

Paraphrase This Document

Need a fresh take? Get an instant paraphrase of this document with our AI Paraphraser
Document Page
References
Boyas, E. and Teeter, R., 2017. Teaching Financial Ratio Analysis using XBRL.
In Developments in Business Simulation and Experiential Learning: Proceedings of the Annual
ABSEL conference (Vol. 44).
Guo, L. and Wang, Z., 2019. Ratio analysis of J Sainsbury plc financial performance between
2015 and 2018 in comparison with Tesco and Morrisons. American Journal of Industrial and
Business Management, 9(2), pp.325-341.
Kim, J. and Im, C., 2017. Study on corporate social responsibility (CSR): Focus on tax
avoidance and financial ratio analysis. Sustainability, 9(10), p.1710.
Purba, J.H.V. and Septian, M.R., 2019. Analysis of Short Term Financial Performance: A Case
Study of an Energy Service Provider. Journal of Accounting Research, Organization and
Economics, 2(2), pp.113-122.
Setiawan, H. and Amboningtyas, D., 2018. Financial Ratio Analysis for Predicting Financial
Distress Conditions (Study on Telecommunication Companies Listed In Indonesia Stock
Exchange Period 2010-2016). Journal of Management, 4(4).
Srinivasan, P., 2018. A Study on Financial Ratio Analysis of Vellore Cooperative Sugar Mills at
Ammundi, Vellore. International Journal of Scientific Research in Multidisciplinary
Studies, 4(6), pp.1-18.
Document Page
Appendices
Profitability Company X Company Y
Gross Profit Margin 21.25% 15.45%
Net Profit Margin 5.75% 5.27%
Return on capital employed 11.79% 13.03%
Liquidity
Current ratio 6.00 3.38
Quick ratio 4.00 1.88
Leverage
Debt-equity ratio 0.15 0.29
chevron_up_icon
1 out of 12
circle_padding
hide_on_mobile
zoom_out_icon
[object Object]