Financial Analysis of Daimler and Tesla: A Performance Evaluation
VerifiedAdded on 2023/01/12
|26
|7329
|63
Report
AI Summary
This report presents a comprehensive financial analysis of Daimler and Tesla, two prominent companies in the automotive industry. The analysis encompasses various financial metrics including gross profit margin, net profit margin, current ratio, quick ratio, debt-to-equity ratio, and asset turnover ratio. These ratios are calculated and compared for the years 2015-2018 to evaluate the financial performance and efficiency of both companies. The report also includes horizontal analysis of the income statement and balance sheet to assess the trends in revenues, net profits, assets, liabilities, and equity. Additionally, a cash flow analysis is performed to evaluate the liquidity and solvency positions of Daimler and Tesla. The findings highlight the strengths and weaknesses of each company, providing insights into their financial health and future prospects. The report aims to offer a comparative perspective on the financial performance of Daimler and Tesla, offering a valuable resource for understanding their financial strategies and outcomes.

Financial Analysis
Management &
Enterprise
Management &
Enterprise
Paraphrase This Document
Need a fresh take? Get an instant paraphrase of this document with our AI Paraphraser
Contents
INTRODUCTION...........................................................................................................................4
TASK...............................................................................................................................................4
Overview of corporations:......................................................................................................4
Evaluation of performance of corporations: Daimler and Tesla:...........................................5
Cash flow analysis:...............................................................................................................10
CONCLUSION..............................................................................................................................12
REFERENCES..............................................................................................................................14
APPENDIX....................................................................................................................................15

⊘ This is a preview!⊘
Do you want full access?
Subscribe today to unlock all pages.
Trusted by 1+ million students worldwide
INTRODUCTION
Financial analysis is vital component of all company practices, as it offers actionable
observations into performance and future prospects of the enterprise. A broad range of methods
can be used to determine the financial sustainability of an entity including most prominent
horizontal analysis, vertical analysis including ratio analysis approaches. Many analytical
approaches include the accounts, internally or externally reviews, and inquiries of the business.
Financial analysis refers to systematic evaluation of a company in order to evaluate its
performance, obligations, assets and prospects for future profits (Bragg, 2012). This study
evaluates the performance of corporations Tesla and Daimler. It includes systematic ratio
analysis, vertical-analysis and horizontal analysis of both companies. Further it consists of
thorough analysis of cash-position of both corporations and comparison of actual performances
both companies.
TASK
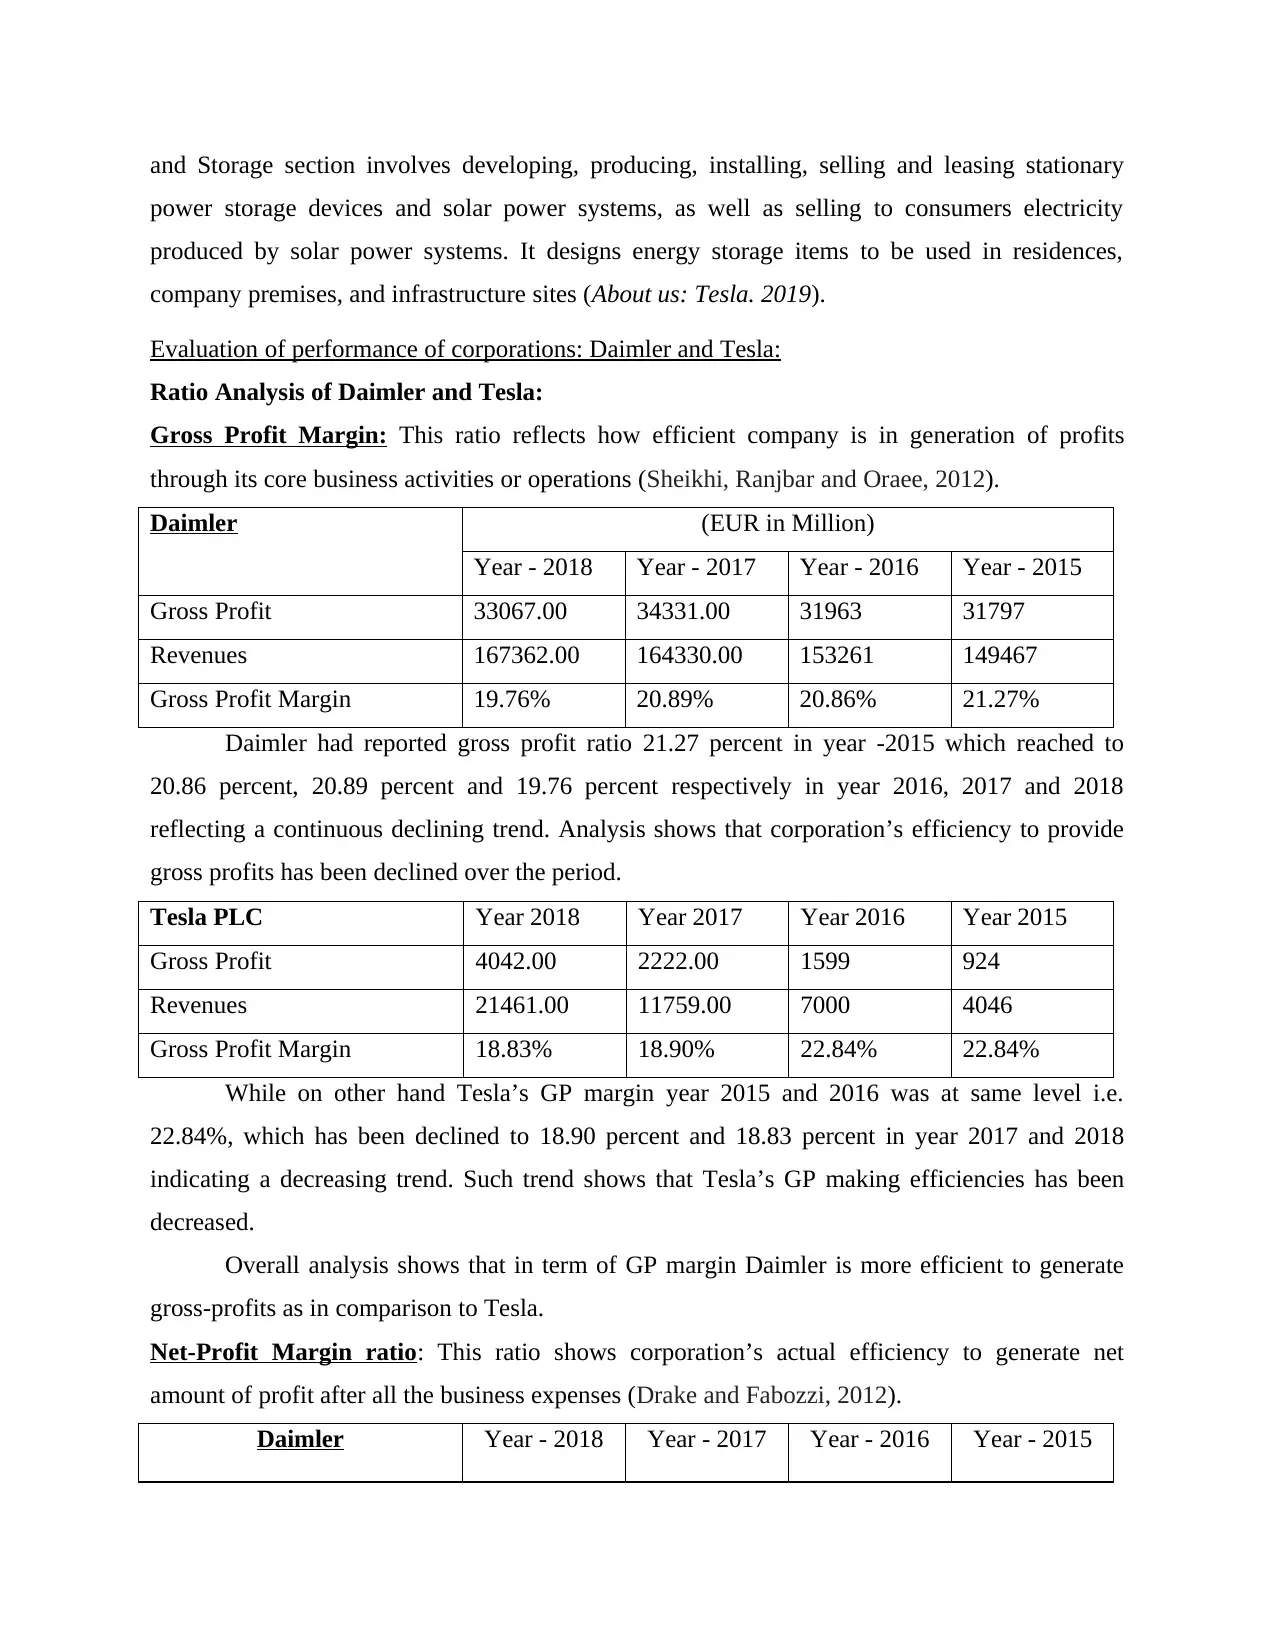
Overview of corporations:
Daimler: Daimler AG (Daimler) is leading engineering and automotive firm. Daimler AG is
widely known as Mercedes, is Germany's multinational automobile company with its
headquarters in Stuttgart, Baden-Württemberg, Germany. Benz & Cie as well as Daimler
Motoren Gesellschaft combined in 1926 to establish Daimler-Benz. After purchasing the
American automotive maker Chrysler Corporation in year 1998, the enterprise was changed to
DaimlerChrysler, and in year 2007 it was reborn as Daimler following Chrysler's divestment.
The Corporation is engaged in productions, manufacture and distribution of auto-mobiles
specially luxury cars, trucks & vans in Germany. The divisions of Daimler are Mercedes-Benz
Vehicles, Daimler Busses, Daimler Trucks, Mercedes-Benz Vans, and several related financial
Services. The organization has manufacturing facilities in about 20 nations, and more than 8,500
distribution centres across the globe (Daimler at a Glance. 2019).
Tesla: Corporation is involved in designing, producing, manufacturing and selling fully-electric
cars, producing energy including storage systems. This also offers service centres for the car,
supercharging station and self-driving capabilities. The corporation operates across following
segments: vehicle production, storage and energy production. The section Automotive covers the
design, production, manufacturing and selling of electric auto-mobiles. The Energy production
Financial analysis is vital component of all company practices, as it offers actionable
observations into performance and future prospects of the enterprise. A broad range of methods
can be used to determine the financial sustainability of an entity including most prominent
horizontal analysis, vertical analysis including ratio analysis approaches. Many analytical
approaches include the accounts, internally or externally reviews, and inquiries of the business.
Financial analysis refers to systematic evaluation of a company in order to evaluate its
performance, obligations, assets and prospects for future profits (Bragg, 2012). This study
evaluates the performance of corporations Tesla and Daimler. It includes systematic ratio
analysis, vertical-analysis and horizontal analysis of both companies. Further it consists of
thorough analysis of cash-position of both corporations and comparison of actual performances
both companies.
TASK
Overview of corporations:
Daimler: Daimler AG (Daimler) is leading engineering and automotive firm. Daimler AG is
widely known as Mercedes, is Germany's multinational automobile company with its
headquarters in Stuttgart, Baden-Württemberg, Germany. Benz & Cie as well as Daimler
Motoren Gesellschaft combined in 1926 to establish Daimler-Benz. After purchasing the
American automotive maker Chrysler Corporation in year 1998, the enterprise was changed to
DaimlerChrysler, and in year 2007 it was reborn as Daimler following Chrysler's divestment.
The Corporation is engaged in productions, manufacture and distribution of auto-mobiles
specially luxury cars, trucks & vans in Germany. The divisions of Daimler are Mercedes-Benz
Vehicles, Daimler Busses, Daimler Trucks, Mercedes-Benz Vans, and several related financial
Services. The organization has manufacturing facilities in about 20 nations, and more than 8,500
distribution centres across the globe (Daimler at a Glance. 2019).
Tesla: Corporation is involved in designing, producing, manufacturing and selling fully-electric
cars, producing energy including storage systems. This also offers service centres for the car,
supercharging station and self-driving capabilities. The corporation operates across following
segments: vehicle production, storage and energy production. The section Automotive covers the
design, production, manufacturing and selling of electric auto-mobiles. The Energy production
Paraphrase This Document
Need a fresh take? Get an instant paraphrase of this document with our AI Paraphraser
and Storage section involves developing, producing, installing, selling and leasing stationary
power storage devices and solar power systems, as well as selling to consumers electricity
produced by solar power systems. It designs energy storage items to be used in residences,
company premises, and infrastructure sites (About us: Tesla. 2019).
Evaluation of performance of corporations: Daimler and Tesla:
Ratio Analysis of Daimler and Tesla:
Gross Profit Margin: This ratio reflects how efficient company is in generation of profits
through its core business activities or operations (Sheikhi, Ranjbar and Oraee, 2012).
Daimler (EUR in Million)
Year - 2018 Year - 2017 Year - 2016 Year - 2015
Gross Profit 33067.00 34331.00 31963 31797
Revenues 167362.00 164330.00 153261 149467
Gross Profit Margin 19.76% 20.89% 20.86% 21.27%
Daimler had reported gross profit ratio 21.27 percent in year -2015 which reached to
20.86 percent, 20.89 percent and 19.76 percent respectively in year 2016, 2017 and 2018
reflecting a continuous declining trend. Analysis shows that corporation’s efficiency to provide
gross profits has been declined over the period.
Tesla PLC Year 2018 Year 2017 Year 2016 Year 2015
Gross Profit 4042.00 2222.00 1599 924
Revenues 21461.00 11759.00 7000 4046
Gross Profit Margin 18.83% 18.90% 22.84% 22.84%
While on other hand Tesla’s GP margin year 2015 and 2016 was at same level i.e.
22.84%, which has been declined to 18.90 percent and 18.83 percent in year 2017 and 2018
indicating a decreasing trend. Such trend shows that Tesla’s GP making efficiencies has been
decreased.
Overall analysis shows that in term of GP margin Daimler is more efficient to generate
gross-profits as in comparison to Tesla.
Net-Profit Margin ratio: This ratio shows corporation’s actual efficiency to generate net
amount of profit after all the business expenses (Drake and Fabozzi, 2012).
Daimler Year - 2018 Year - 2017 Year - 2016 Year - 2015
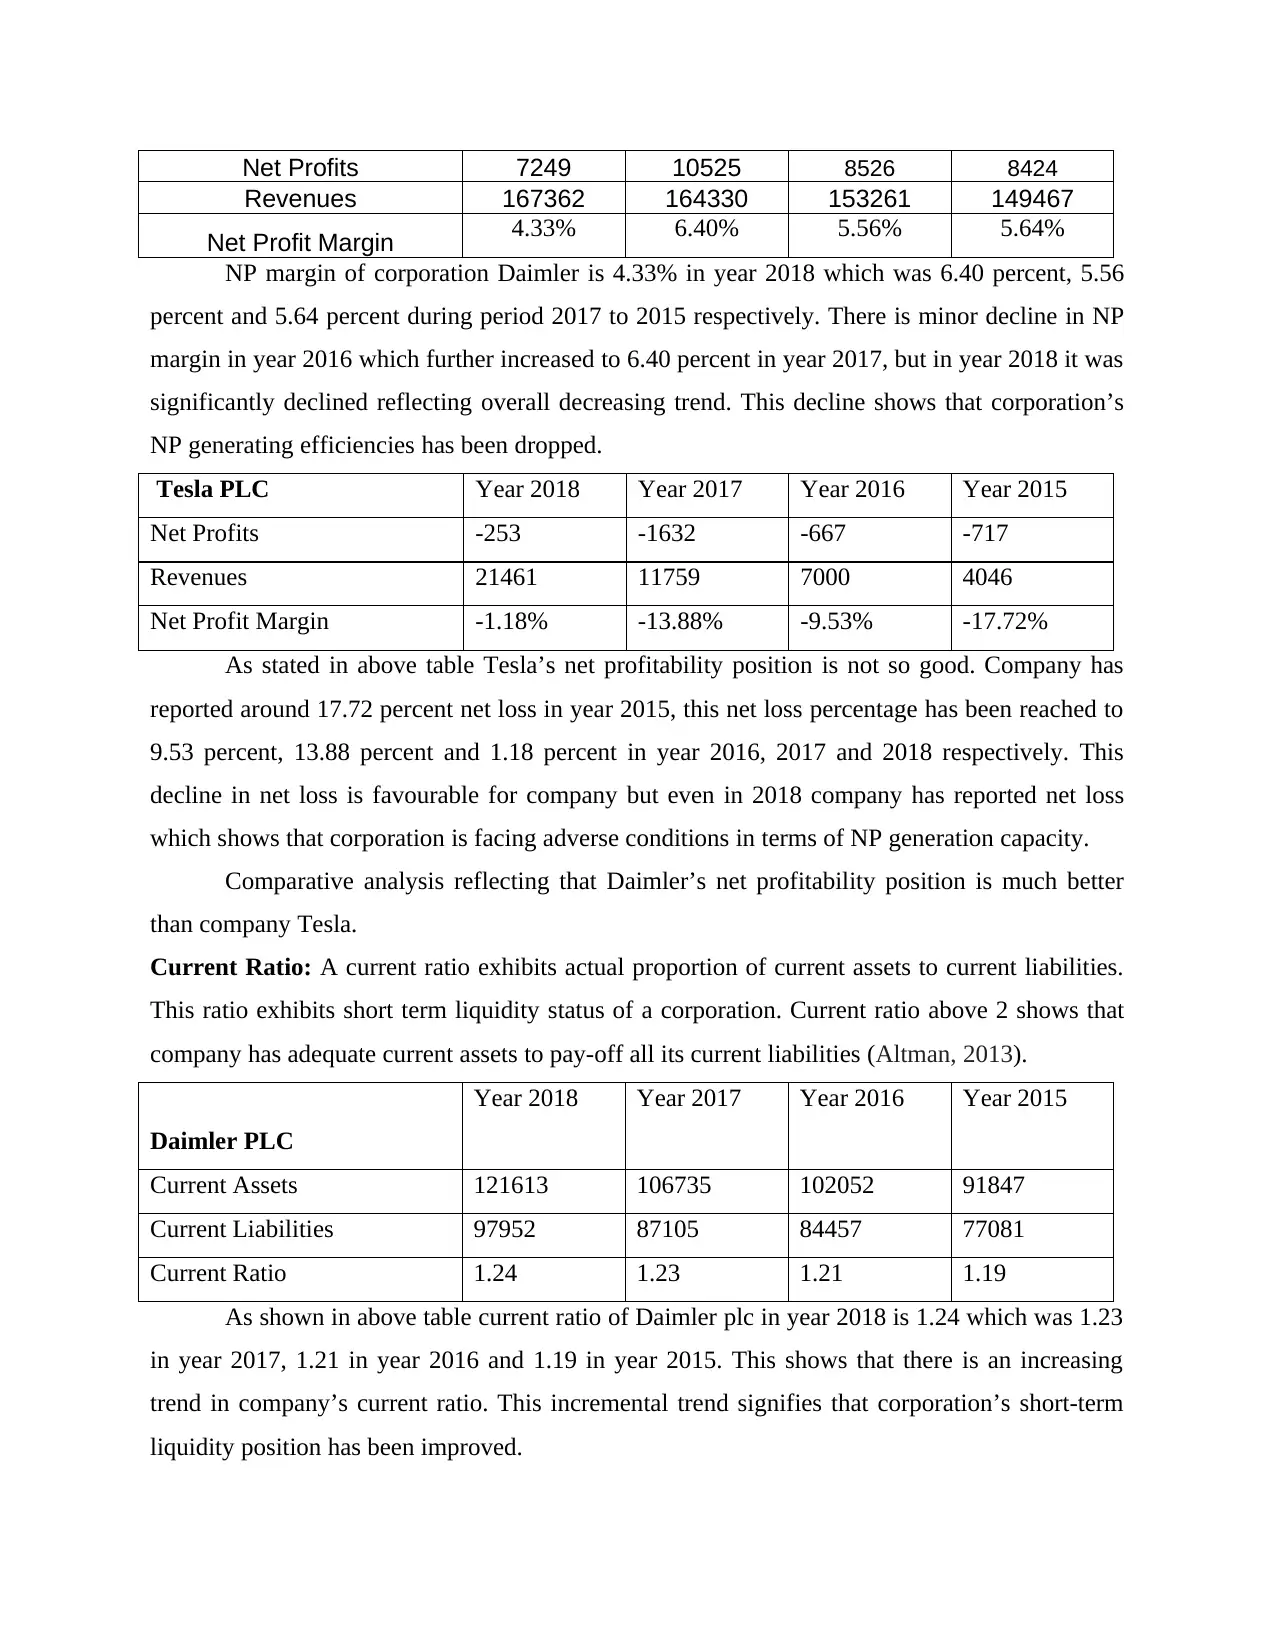
Net Profits 7249 10525 8526 8424
Revenues 167362 164330 153261 149467
Net Profit Margin 4.33% 6.40% 5.56% 5.64%
NP margin of corporation Daimler is 4.33% in year 2018 which was 6.40 percent, 5.56
percent and 5.64 percent during period 2017 to 2015 respectively. There is minor decline in NP
margin in year 2016 which further increased to 6.40 percent in year 2017, but in year 2018 it was
significantly declined reflecting overall decreasing trend. This decline shows that corporation’s
NP generating efficiencies has been dropped.
Tesla PLC Year 2018 Year 2017 Year 2016 Year 2015
Net Profits -253 -1632 -667 -717
Revenues 21461 11759 7000 4046
Net Profit Margin -1.18% -13.88% -9.53% -17.72%
As stated in above table Tesla’s net profitability position is not so good. Company has
reported around 17.72 percent net loss in year 2015, this net loss percentage has been reached to
9.53 percent, 13.88 percent and 1.18 percent in year 2016, 2017 and 2018 respectively. This
decline in net loss is favourable for company but even in 2018 company has reported net loss
which shows that corporation is facing adverse conditions in terms of NP generation capacity.
Comparative analysis reflecting that Daimler’s net profitability position is much better
than company Tesla.
Current Ratio: A current ratio exhibits actual proportion of current assets to current liabilities.
This ratio exhibits short term liquidity status of a corporation. Current ratio above 2 shows that
company has adequate current assets to pay-off all its current liabilities (Altman, 2013).
Daimler PLC
Year 2018 Year 2017 Year 2016 Year 2015
Current Assets 121613 106735 102052 91847
Current Liabilities 97952 87105 84457 77081
Current Ratio 1.24 1.23 1.21 1.19
As shown in above table current ratio of Daimler plc in year 2018 is 1.24 which was 1.23
in year 2017, 1.21 in year 2016 and 1.19 in year 2015. This shows that there is an increasing
trend in company’s current ratio. This incremental trend signifies that corporation’s short-term
liquidity position has been improved.
⊘ This is a preview!⊘
Do you want full access?
Subscribe today to unlock all pages.
Trusted by 1+ million students worldwide
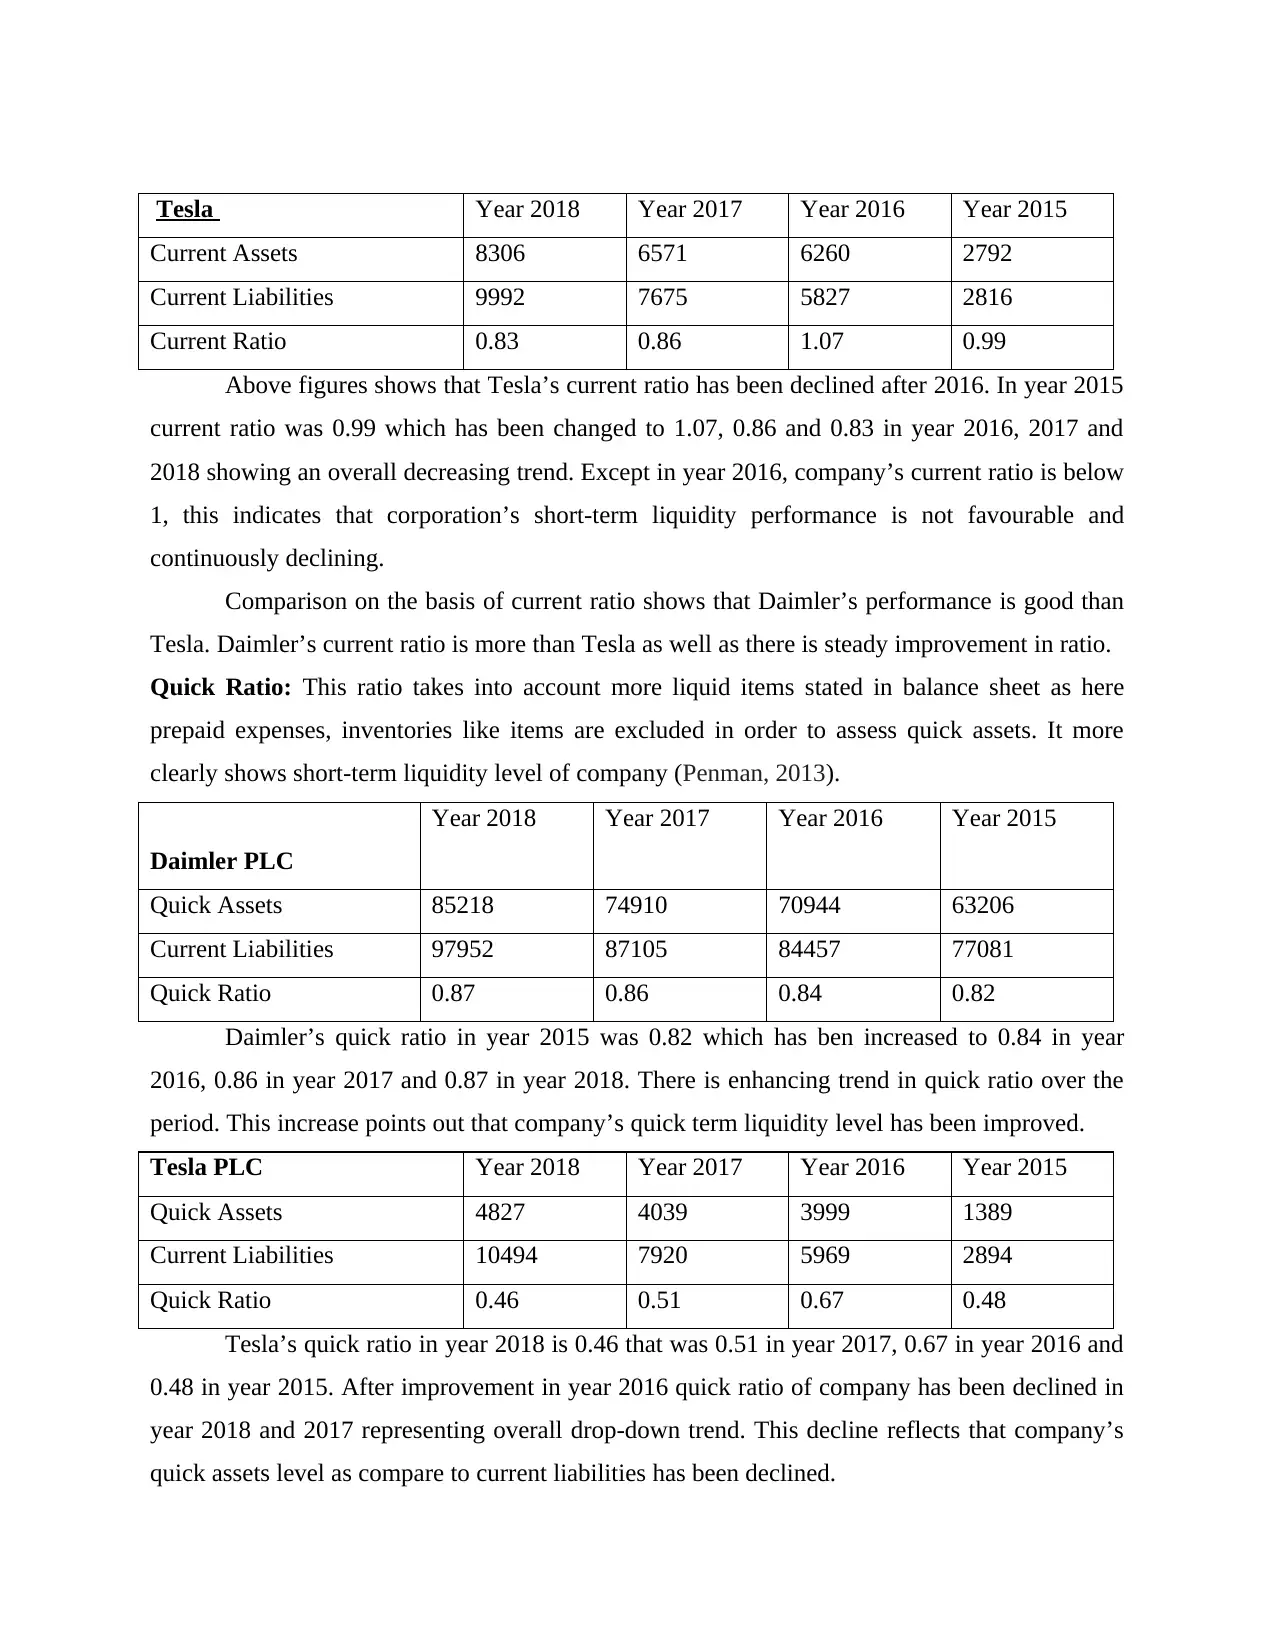
Tesla Year 2018 Year 2017 Year 2016 Year 2015
Current Assets 8306 6571 6260 2792
Current Liabilities 9992 7675 5827 2816
Current Ratio 0.83 0.86 1.07 0.99
Above figures shows that Tesla’s current ratio has been declined after 2016. In year 2015
current ratio was 0.99 which has been changed to 1.07, 0.86 and 0.83 in year 2016, 2017 and
2018 showing an overall decreasing trend. Except in year 2016, company’s current ratio is below
1, this indicates that corporation’s short-term liquidity performance is not favourable and
continuously declining.
Comparison on the basis of current ratio shows that Daimler’s performance is good than
Tesla. Daimler’s current ratio is more than Tesla as well as there is steady improvement in ratio.
Quick Ratio: This ratio takes into account more liquid items stated in balance sheet as here
prepaid expenses, inventories like items are excluded in order to assess quick assets. It more
clearly shows short-term liquidity level of company (Penman, 2013).
Daimler PLC
Year 2018 Year 2017 Year 2016 Year 2015
Quick Assets 85218 74910 70944 63206
Current Liabilities 97952 87105 84457 77081
Quick Ratio 0.87 0.86 0.84 0.82
Daimler’s quick ratio in year 2015 was 0.82 which has ben increased to 0.84 in year
2016, 0.86 in year 2017 and 0.87 in year 2018. There is enhancing trend in quick ratio over the
period. This increase points out that company’s quick term liquidity level has been improved.
Tesla PLC Year 2018 Year 2017 Year 2016 Year 2015
Quick Assets 4827 4039 3999 1389
Current Liabilities 10494 7920 5969 2894
Quick Ratio 0.46 0.51 0.67 0.48
Tesla’s quick ratio in year 2018 is 0.46 that was 0.51 in year 2017, 0.67 in year 2016 and
0.48 in year 2015. After improvement in year 2016 quick ratio of company has been declined in
year 2018 and 2017 representing overall drop-down trend. This decline reflects that company’s
quick assets level as compare to current liabilities has been declined.
Paraphrase This Document
Need a fresh take? Get an instant paraphrase of this document with our AI Paraphraser
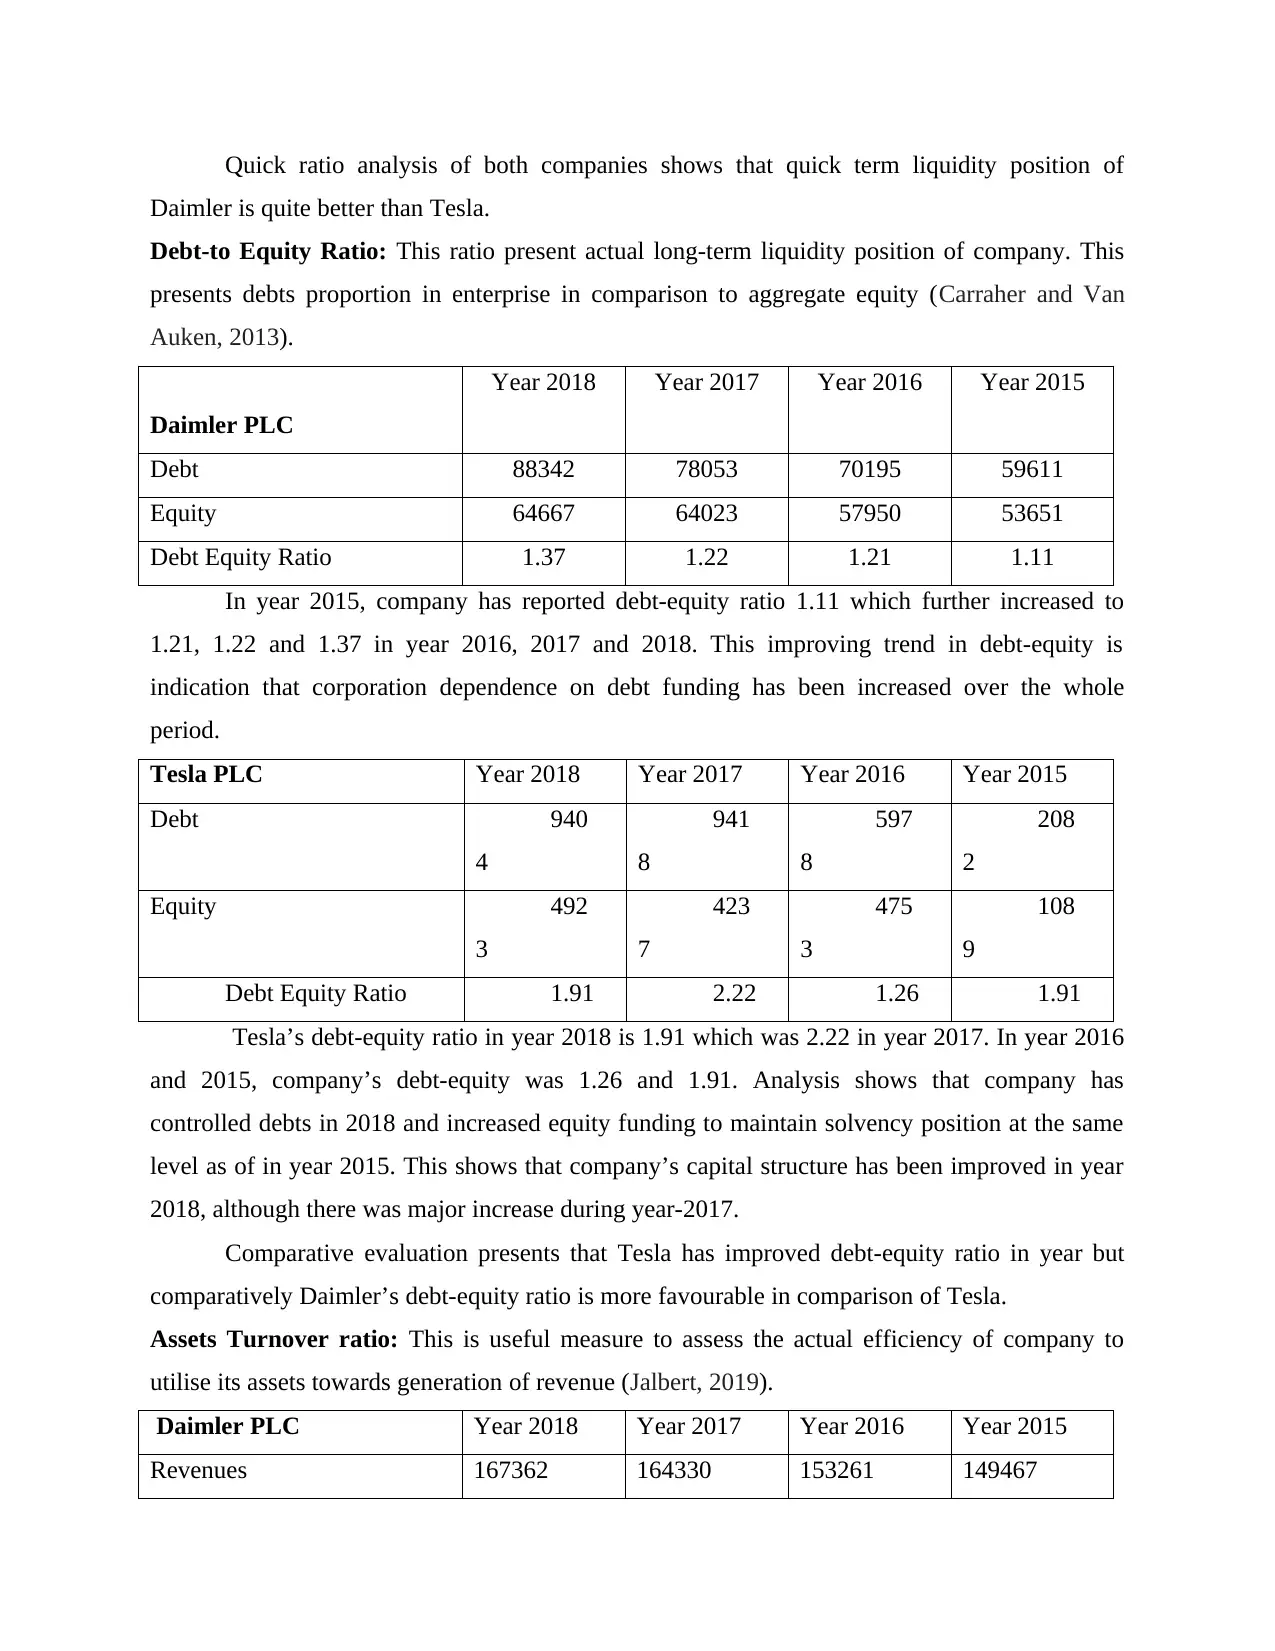
Quick ratio analysis of both companies shows that quick term liquidity position of
Daimler is quite better than Tesla.
Debt-to Equity Ratio: This ratio present actual long-term liquidity position of company. This
presents debts proportion in enterprise in comparison to aggregate equity (Carraher and Van
Auken, 2013).
Daimler PLC
Year 2018 Year 2017 Year 2016 Year 2015
Debt 88342 78053 70195 59611
Equity 64667 64023 57950 53651
Debt Equity Ratio 1.37 1.22 1.21 1.11
In year 2015, company has reported debt-equity ratio 1.11 which further increased to
1.21, 1.22 and 1.37 in year 2016, 2017 and 2018. This improving trend in debt-equity is
indication that corporation dependence on debt funding has been increased over the whole
period.
Tesla PLC Year 2018 Year 2017 Year 2016 Year 2015
Debt 940
4
941
8
597
8
208
2
Equity 492
3
423
7
475
3
108
9
Debt Equity Ratio 1.91 2.22 1.26 1.91
Tesla’s debt-equity ratio in year 2018 is 1.91 which was 2.22 in year 2017. In year 2016
and 2015, company’s debt-equity was 1.26 and 1.91. Analysis shows that company has
controlled debts in 2018 and increased equity funding to maintain solvency position at the same
level as of in year 2015. This shows that company’s capital structure has been improved in year
2018, although there was major increase during year-2017.
Comparative evaluation presents that Tesla has improved debt-equity ratio in year but
comparatively Daimler’s debt-equity ratio is more favourable in comparison of Tesla.
Assets Turnover ratio: This is useful measure to assess the actual efficiency of company to
utilise its assets towards generation of revenue (Jalbert, 2019).
Daimler PLC Year 2018 Year 2017 Year 2016 Year 2015
Revenues 167362 164330 153261 149467
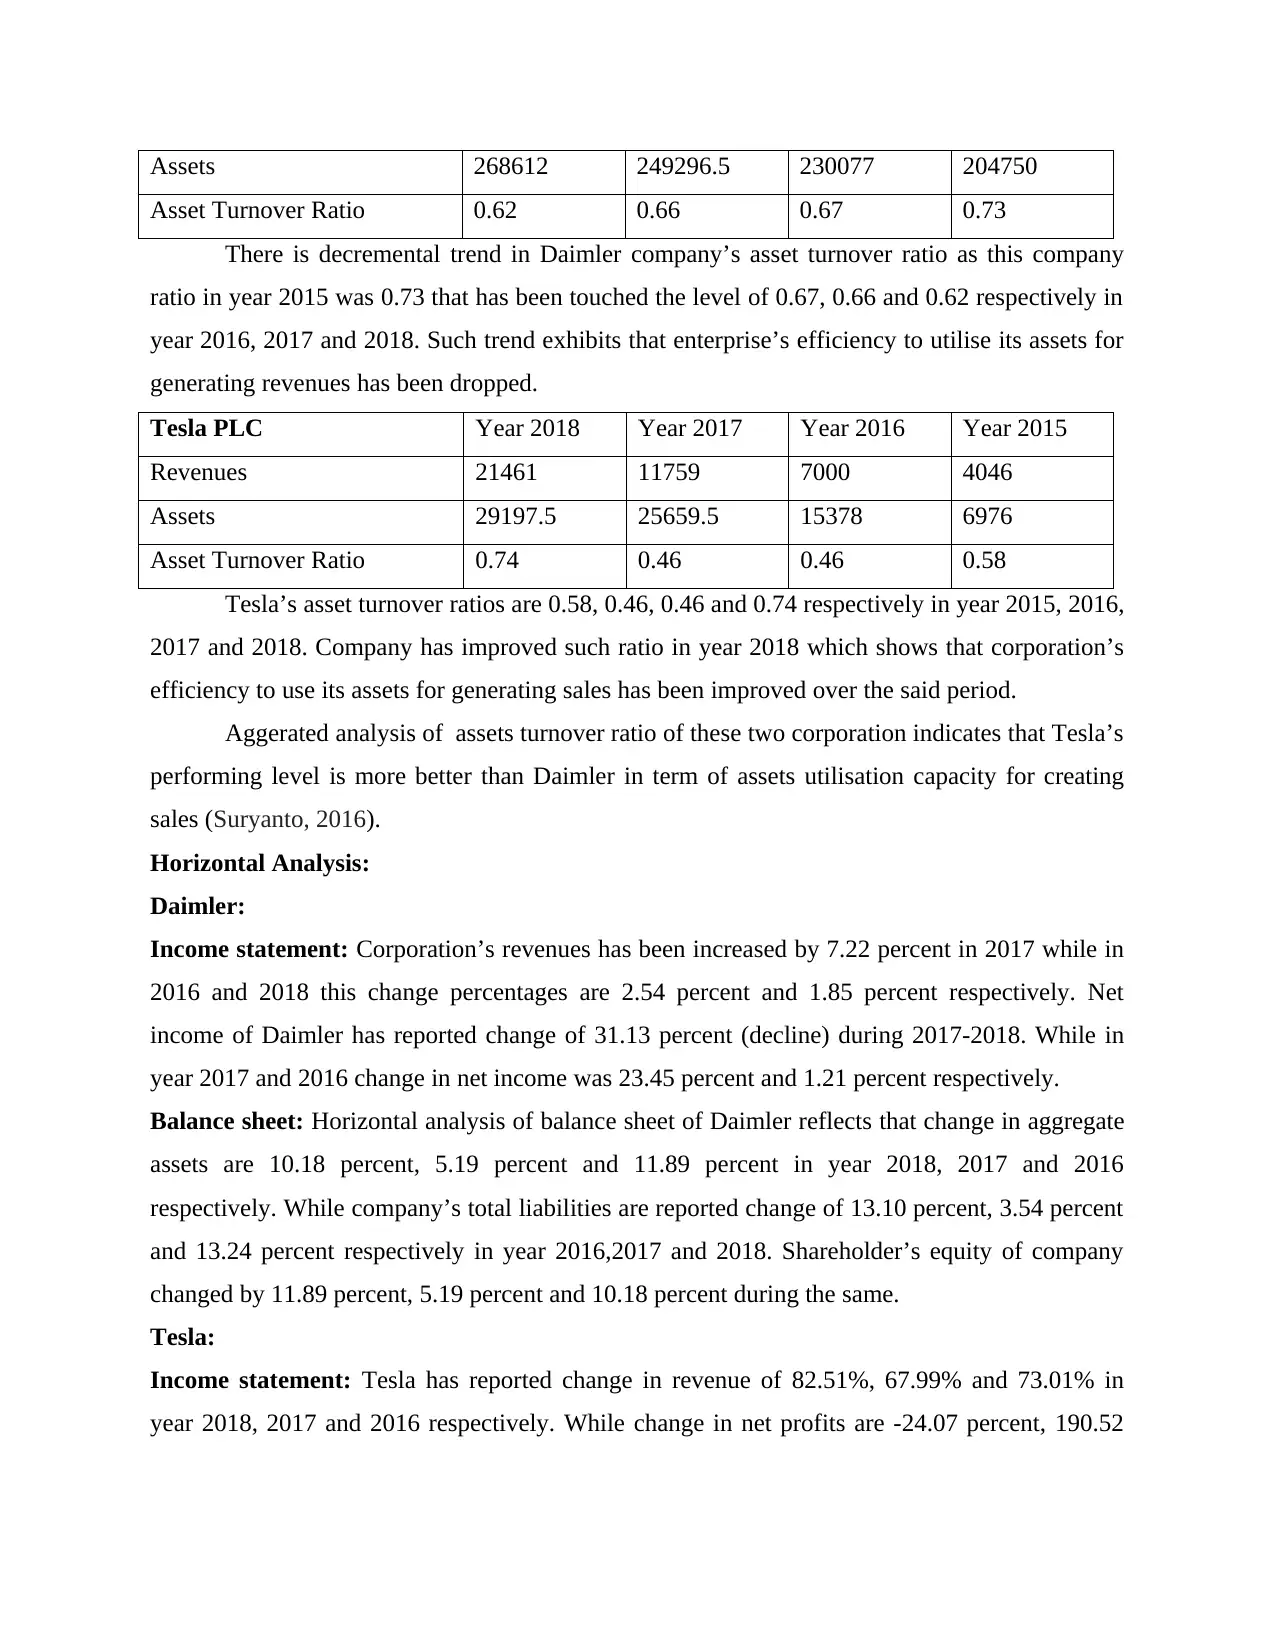
Assets 268612 249296.5 230077 204750
Asset Turnover Ratio 0.62 0.66 0.67 0.73
There is decremental trend in Daimler company’s asset turnover ratio as this company
ratio in year 2015 was 0.73 that has been touched the level of 0.67, 0.66 and 0.62 respectively in
year 2016, 2017 and 2018. Such trend exhibits that enterprise’s efficiency to utilise its assets for
generating revenues has been dropped.
Tesla PLC Year 2018 Year 2017 Year 2016 Year 2015
Revenues 21461 11759 7000 4046
Assets 29197.5 25659.5 15378 6976
Asset Turnover Ratio 0.74 0.46 0.46 0.58
Tesla’s asset turnover ratios are 0.58, 0.46, 0.46 and 0.74 respectively in year 2015, 2016,
2017 and 2018. Company has improved such ratio in year 2018 which shows that corporation’s
efficiency to use its assets for generating sales has been improved over the said period.
Aggerated analysis of assets turnover ratio of these two corporation indicates that Tesla’s
performing level is more better than Daimler in term of assets utilisation capacity for creating
sales (Suryanto, 2016).
Horizontal Analysis:
Daimler:
Income statement: Corporation’s revenues has been increased by 7.22 percent in 2017 while in
2016 and 2018 this change percentages are 2.54 percent and 1.85 percent respectively. Net
income of Daimler has reported change of 31.13 percent (decline) during 2017-2018. While in
year 2017 and 2016 change in net income was 23.45 percent and 1.21 percent respectively.
Balance sheet: Horizontal analysis of balance sheet of Daimler reflects that change in aggregate
assets are 10.18 percent, 5.19 percent and 11.89 percent in year 2018, 2017 and 2016
respectively. While company’s total liabilities are reported change of 13.10 percent, 3.54 percent
and 13.24 percent respectively in year 2016,2017 and 2018. Shareholder’s equity of company
changed by 11.89 percent, 5.19 percent and 10.18 percent during the same.
Tesla:
Income statement: Tesla has reported change in revenue of 82.51%, 67.99% and 73.01% in
year 2018, 2017 and 2016 respectively. While change in net profits are -24.07 percent, 190.52
⊘ This is a preview!⊘
Do you want full access?
Subscribe today to unlock all pages.
Trusted by 1+ million students worldwide
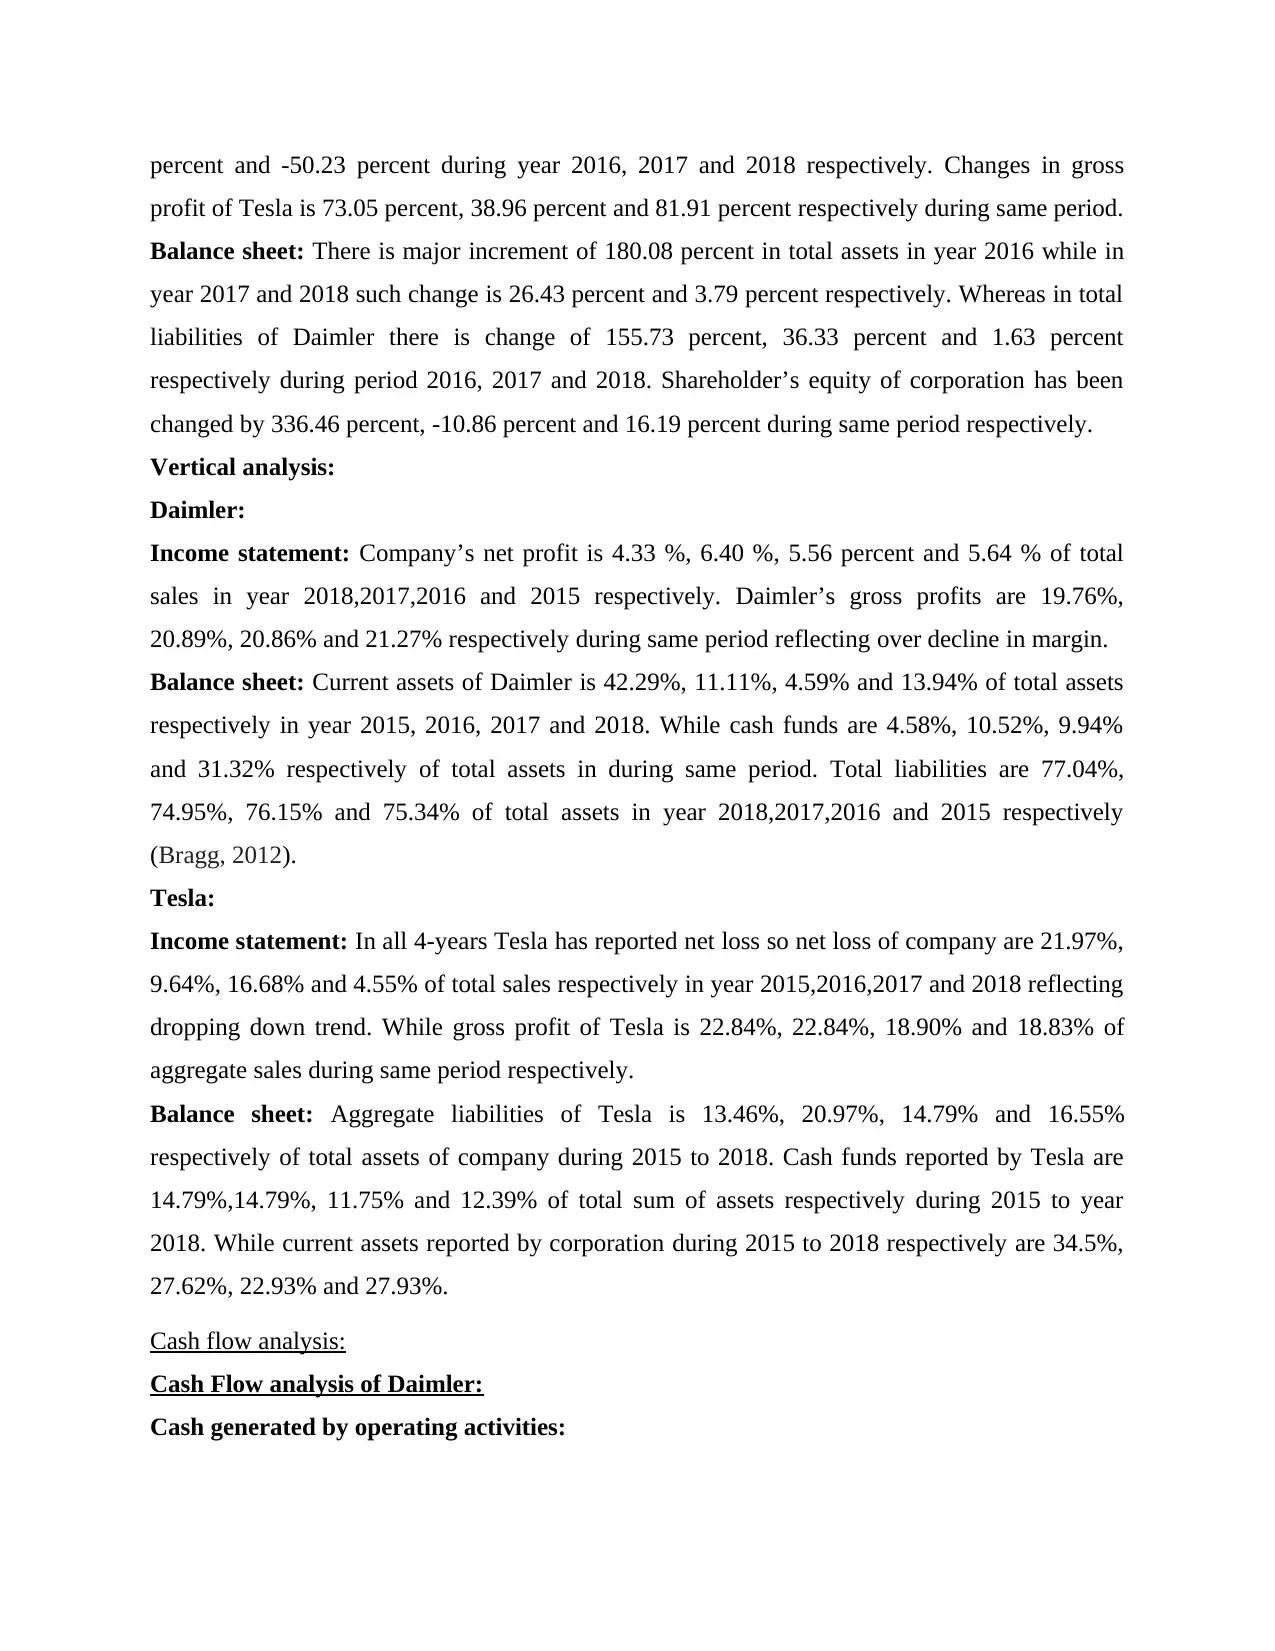
percent and -50.23 percent during year 2016, 2017 and 2018 respectively. Changes in gross
profit of Tesla is 73.05 percent, 38.96 percent and 81.91 percent respectively during same period.
Balance sheet: There is major increment of 180.08 percent in total assets in year 2016 while in
year 2017 and 2018 such change is 26.43 percent and 3.79 percent respectively. Whereas in total
liabilities of Daimler there is change of 155.73 percent, 36.33 percent and 1.63 percent
respectively during period 2016, 2017 and 2018. Shareholder’s equity of corporation has been
changed by 336.46 percent, -10.86 percent and 16.19 percent during same period respectively.
Vertical analysis:
Daimler:
Income statement: Company’s net profit is 4.33 %, 6.40 %, 5.56 percent and 5.64 % of total
sales in year 2018,2017,2016 and 2015 respectively. Daimler’s gross profits are 19.76%,
20.89%, 20.86% and 21.27% respectively during same period reflecting over decline in margin.
Balance sheet: Current assets of Daimler is 42.29%, 11.11%, 4.59% and 13.94% of total assets
respectively in year 2015, 2016, 2017 and 2018. While cash funds are 4.58%, 10.52%, 9.94%
and 31.32% respectively of total assets in during same period. Total liabilities are 77.04%,
74.95%, 76.15% and 75.34% of total assets in year 2018,2017,2016 and 2015 respectively
(Bragg, 2012).
Tesla:
Income statement: In all 4-years Tesla has reported net loss so net loss of company are 21.97%,
9.64%, 16.68% and 4.55% of total sales respectively in year 2015,2016,2017 and 2018 reflecting
dropping down trend. While gross profit of Tesla is 22.84%, 22.84%, 18.90% and 18.83% of
aggregate sales during same period respectively.
Balance sheet: Aggregate liabilities of Tesla is 13.46%, 20.97%, 14.79% and 16.55%
respectively of total assets of company during 2015 to 2018. Cash funds reported by Tesla are
14.79%,14.79%, 11.75% and 12.39% of total sum of assets respectively during 2015 to year
2018. While current assets reported by corporation during 2015 to 2018 respectively are 34.5%,
27.62%, 22.93% and 27.93%.
Cash flow analysis:
Cash Flow analysis of Daimler:
Cash generated by operating activities:
Paraphrase This Document
Need a fresh take? Get an instant paraphrase of this document with our AI Paraphraser
In year 2016 and company cash flows from operating-tasks was EUR 3711 and EUR 222 million
reflecting an increasing trend. However, there was a major decline in year 2017. Cash utilized for
/ received by business operations resulted in a cash inflows of € 343 million in year 2018 which
was 1652 (outflow) in 2017. The favourable trend was mainly due to around € 3.0 billion capital
outflow through extraordinary allocation to German pension funds in intervening year. It has
complemented by positive results from sales-financing and leasing market. However, cash
utilized for / received by business operations represents reduced income taxes charged, and a
larger cash inflow attributable to dividends issued by Beijing-Benz Automotive Ltd. which in
year.
Cash-flows from investing activities:
Cash used for construction activities was EUR 9921million year 2018 that was EUR 9518
million in year 2017. The improvement relative to the previous year was largely due to additional
spending in land, plants & equipment. Because of previous year's purchase of a stake in LSH
Auto International Limited (LSHAI), the opposing results originated from reduced cash out-
flows towards investing in shareholding. Cash utilized for investment activities was EUR 9518
million in 2017 which was EUR 14666 million and EUR 9722 million and in year 2016 and
2015. The improvement relative to the previous-years was largely due to reduced cash outflows
towards shareholding investments. Effect on reporting time was purchase of a stake in LSHAI.
The purchase of 100 per cent of Athlon Car-Lease International B.V. shares in previous-year
period and the arbitration of Athlon's funding commitments lead to outflows. Positive results in
liquidity performance arose from sales or disposals of stocks (Feng, McVay and Skaife, 2015).
Cash Flows from Financing activities: Cash from investing operations amounted to EUR
13226 million in year 2018 and in 2017 it was EUR 13129 million. The small rise was largely
triggered by greater net cash inflows through funding obligations in the form of refinancing,
leasing, sales-financing sector and use of favourable conditions in foreign money as well as
foreign capital markets. Oppositional results were result of increase in dividend distributions to
Daimler AG's shareholders. In year 2015 and 2016 cash-flows was 9631 million and 12009
respectively indicating rising trend. Overall increase during 4 year is due to debt issued and
cashflows from refinancing and leasing business.
From above all three key activities net cash flow change in company was 3781 million,
1091 million, 1045 million and 269 million respectively in year 2018 to 2015 respectively
reflecting an incremental trend in net-cash flow. The analysis shows that there is improvement in
overall cash liquidly position of corporation.
Cash-flow analysis of Tesla:
Cash flow from operating activities: Company has reported cash received through operating
activities amounting USD 2098 million in year 2018 while during 2015 to 2017 company
reported out flows amounting USD 525 million, USD 124 million and USD 61 million
respectively. Significant increase and positive cash flow in 2018 is due to decline in net-loss and
improvement in working capital position of company. After 2015, company controlled the cash
out flow and currently company has achieved positive figure.
Cash flow from investing operations: Tesla has reported cash used in investment operations
amounting 2337 million, 4419 million, 1416 million and 1674 million respectively in year 2018,
2017, 2016 and 2015. Major reason of outflow is investment made by company towards
property, plants and equipment as well as purchase of fixed assets.
Cash flow from financing operations: Tesla company has reported cash generated through
financing activities are 1524 million, 3744 million, 4415 million and 574 million respectively
during 2015 to 2018. During company generated cash flow of 750 million, 1702 million and 400
million from issuance of common stock. Also, major decline in year 2018 is due to debt
repayment 6087 million and debt issued amounting 6176 million.
Net change in cash-flows reported by Tesla are 311 million, (25 million), 2196 million
and (709 million) respectively during 2018 to 2015. Overall evaluation and analysis of cash
flows shows that there is improvement in cash flow during 2018 but still company has not
reached cash flow level as of 2016. Presently net cash flow changes is positive which shows that
company’s liquidity position is quite better than just preceding year.
Comparative overall analysis: From the overall analysis of cash flow statement and trends in
cash-flows of Tesla and Daimler it has been analysed that Daimler’s cash flow position is better
than Tesla. As Daimler’s net cashflows has been increased over the year but in Tesla, company
has reported negative figures of cash flows in year 2015 and 2017. Also, there is major decline in
cash-flow change in year 2017. Therefore, it is clear that performance of Daimler is much better
than Tesla in terms of cash-flow position.
⊘ This is a preview!⊘
Do you want full access?
Subscribe today to unlock all pages.
Trusted by 1+ million students worldwide
1 out of 26
Related Documents


Your All-in-One AI-Powered Toolkit for Academic Success.
+13062052269
info@desklib.com
Available 24*7 on WhatsApp / Email
![[object Object]](/_next/static/media/star-bottom.7253800d.svg)
Unlock your academic potential
Copyright © 2020–2026 A2Z Services. All Rights Reserved. Developed and managed by ZUCOL.