Financial Performance and Strategic Review of Beverage Companies
VerifiedAdded on 2022/12/27
|13
|3181
|75
Report
AI Summary
This report provides a comprehensive financial analysis of three beverage companies: A.G. Barr PLC, Britvic PLC, and Coca-Cola European Partners PLC, all listed on the London Stock Exchange. The report examines their strategic reviews, performance evaluations, and financial ratios for the years 2018 and 2019. It delves into key performance indicators such as Return on Equity, Return on Assets, Interest Coverage, Liquidity, Solvency, and Gearing Ratios. Furthermore, the report discusses business financing, differentiating between internal sources like retained earnings and external sources such as debt and equity financing. The analysis highlights the strengths and weaknesses of each company, offering insights into their financial health, strategic decisions, and overall market positioning. The report concludes with an argument supporting investment in A.G. Barr PLC based on its superior financial performance in the analyzed period.

Accounting and Finance
for Managers
for Managers
Paraphrase This Document
Need a fresh take? Get an instant paraphrase of this document with our AI Paraphraser
TABLE OF CONTENTS
TABLE OF CONTENTS...............................................................................................................2
INTRODUCTION...........................................................................................................................3
1.a Strategic Review................................................................................................................3
1.b Performance Evaluation...................................................................................................5
1.c Argument.............................................................................................................................8
2.a Business Financing...........................................................................................................9
2.b Long-term financing by A.G. Barr PLC through Debt................................................11
CONCLUSION.............................................................................................................................11
REFERENCES............................................................................................................................13
INTRODUCTION
Accounting is a record and arrangement of the financial information periodically
in an orderly manner. The accounting when used by the managers to make decisions
and management purposes then it is known as accounting for managers. In this report
the analysis of the three companies that are part of the beverage industry is made. The
companies are A.G. Barr PLC, Britvic PLC, and Coca Cola European Partners PLC.
These companies are the part of London Stock Exchange. Further, the use of different
sources of finance viz. Internal and External sources is described and comparison and
analysis of the financial information taken from annual report of these companies of
different years is been made to show performance of the companies.
1.a Strategic Review
A.G. Barr PLC
For the company the year 2020 was not a profitable year as compared to
previous years.
Its core soft drinks business underperformed. The first half of the year 2020 hit almost
every economy around the globe due to global pandemic. After half a year the company
took strategic focus on selling in volumes and the performance increase significantly.
Challenges
2020
1. The soft drink business underperformed in the year 2020 as expected by the
company.
2. PepsiCo Inc. acquire the Rockstar Energy Beverages. The company holds the
rights of distribution of Rockstar Brand.
2019
1. Revenue of the company fell by 8.4% and statutory profit before tax fell 16%.
2. Company was facing difficulties in maintaining long-term investments in brands
and business.
Success Indicators
1. Cocktail market share of the company grows to 9.9% and outlet selling up by
3.2%.
⊘ This is a preview!⊘
Do you want full access?
Subscribe today to unlock all pages.
Trusted by 1+ million students worldwide
Key Strategies
In 2018 the company follows short-term volume trading then value. This strategy results
in the increase of the market shares of A.G. Barr PLC.
Later in 2019 the company shifted to its long-term value driven strategy. The strategy
helps in align the company close to its competitors and establish its consumer price
positioning in the market.
Britvic PLC
The company perform its operations in Great Britain, Brazil and Rest of the
World. 63% of the share holds by Great Britain. With the global restrictions the company
is also affected by the downturn. The company in 2020 launches new variants and
packs of soft drinks in the market. The company lead the soft drink industry by making
low calorie per serve portfolio.
Challenges
2020
1. The company's water factory in Ireland shut down for a short-period because of
demand drop.
2. The company's revenue decline in the Q2 of the year to 1.4% and in Q3 to 16.3%
and in Q4 fell by 11.3% than last year.
Success Indicators
1. In year 2020 the company reduced its debt portfolio by Pound 46 Million. In Q1
the revenue as compared to previous year increases to 2.6%.
2. The company in Great Britain increased its market share of 1.5%.
3. The company's Pure Coconut water brand becomes the third largest brand by
increase in 15% market share.
Key Strategies
1. In the month of October, the company signed an agreement of bottling
agreement with PepsiCo.
2. The company is focused on growing market share and value to the customer’s
company increase in its sales in flavoured soft drinks brands by 7.4% by the
second half of the year.
Coca Cola European Partners PLC
Paraphrase This Document
Need a fresh take? Get an instant paraphrase of this document with our AI Paraphraser
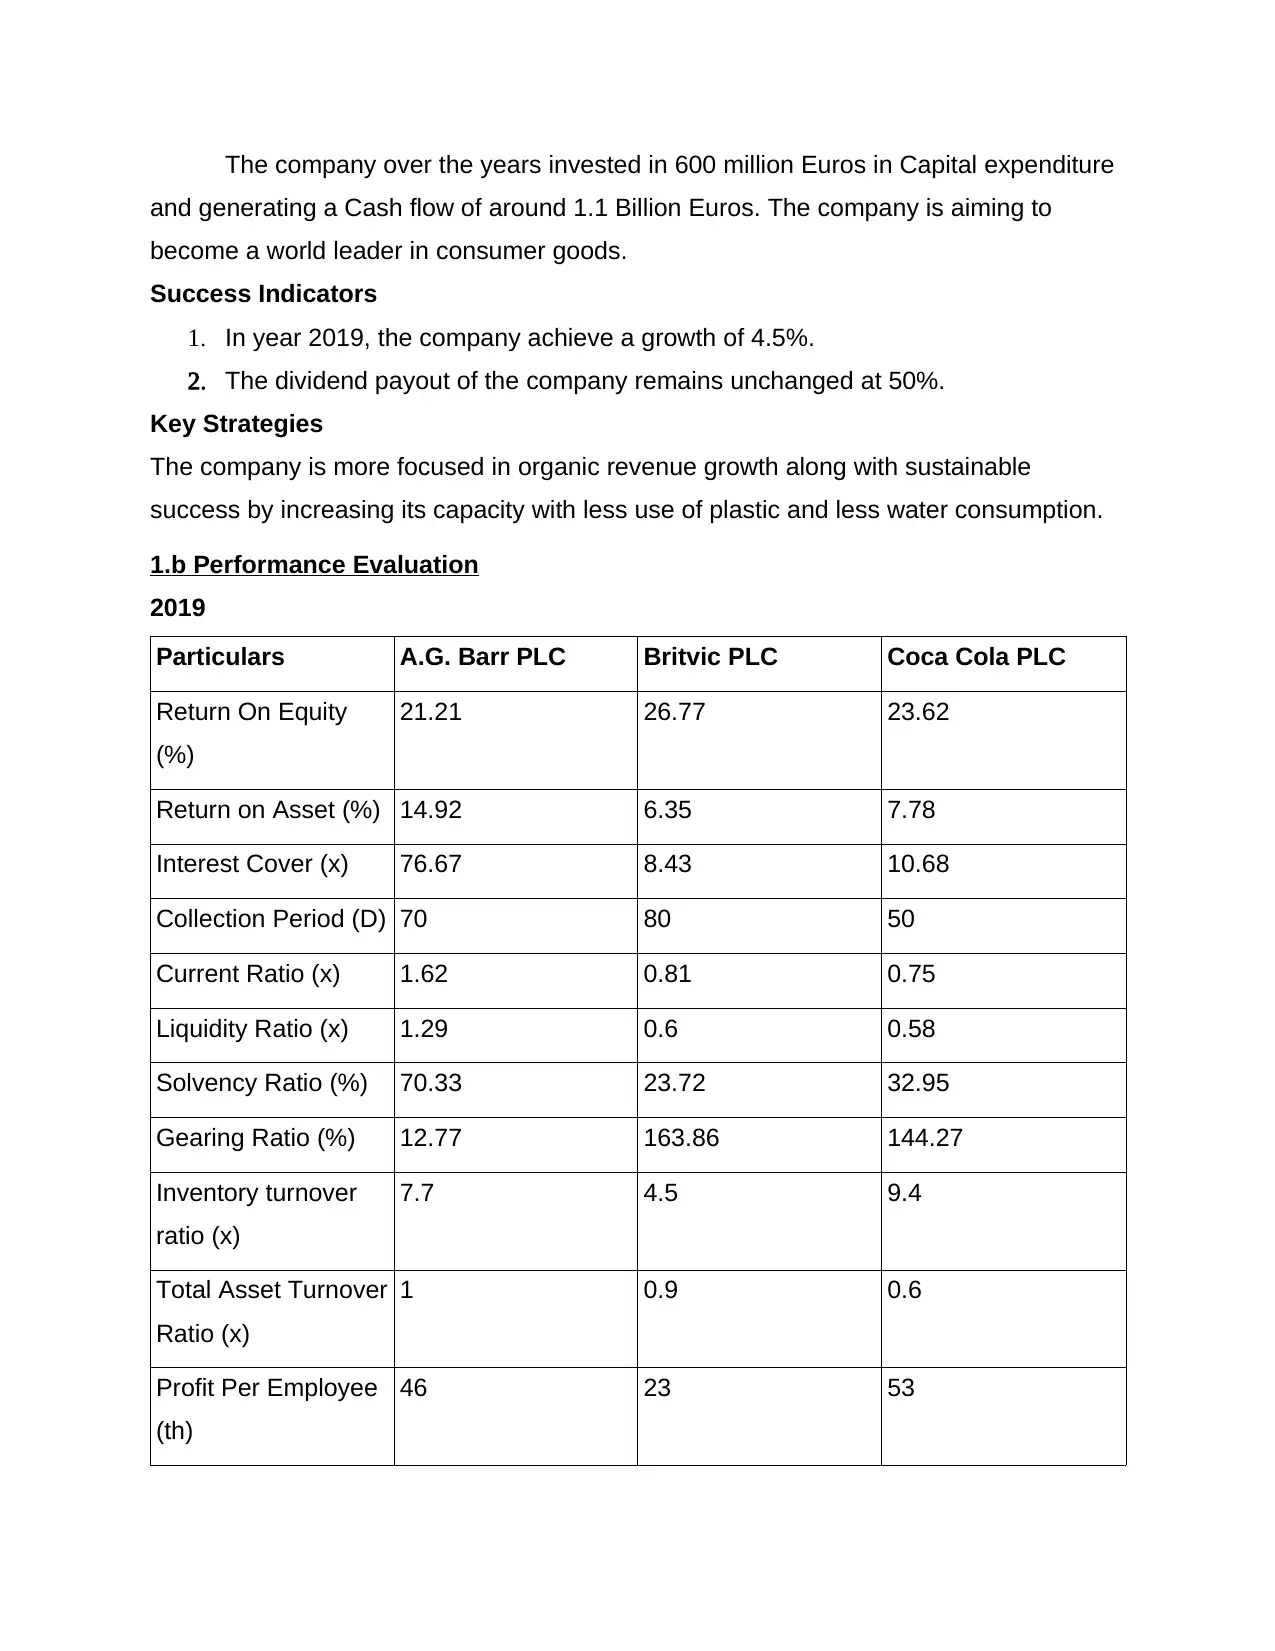
The company over the years invested in 600 million Euros in Capital expenditure
and generating a Cash flow of around 1.1 Billion Euros. The company is aiming to
become a world leader in consumer goods.
Success Indicators
1. In year 2019, the company achieve a growth of 4.5%.
2. The dividend payout of the company remains unchanged at 50%.
Key Strategies
The company is more focused in organic revenue growth along with sustainable
success by increasing its capacity with less use of plastic and less water consumption.
1.b Performance Evaluation
2019
Particulars A.G. Barr PLC Britvic PLC Coca Cola PLC
Return On Equity
(%)
21.21 26.77 23.62
Return on Asset (%) 14.92 6.35 7.78
Interest Cover (x) 76.67 8.43 10.68
Collection Period (D) 70 80 50
Current Ratio (x) 1.62 0.81 0.75
Liquidity Ratio (x) 1.29 0.6 0.58
Solvency Ratio (%) 70.33 23.72 32.95
Gearing Ratio (%) 12.77 163.86 144.27
Inventory turnover
ratio (x)
7.7 4.5 9.4
Total Asset Turnover
Ratio (x)
1 0.9 0.6
Profit Per Employee
(th)
46 23 53
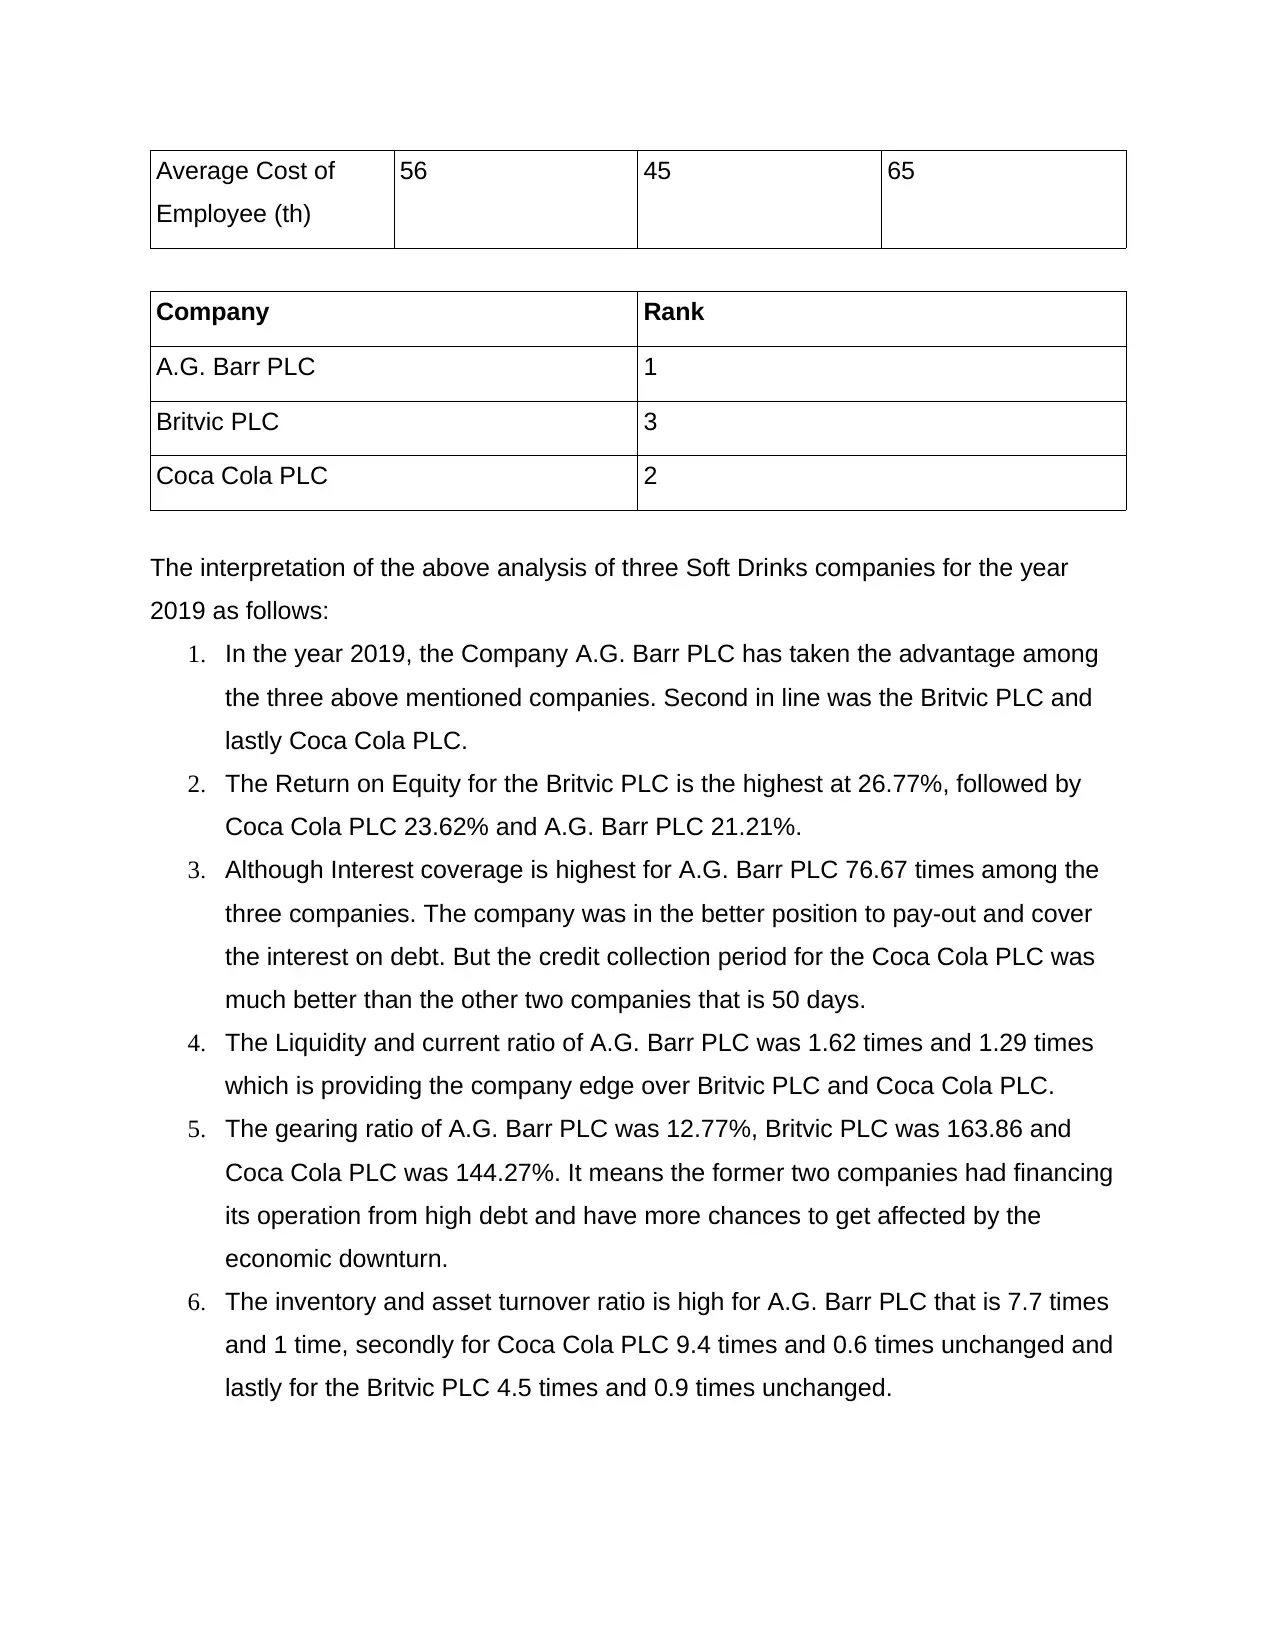
Average Cost of
Employee (th)
56 45 65
Company Rank
A.G. Barr PLC 1
Britvic PLC 3
Coca Cola PLC 2
The interpretation of the above analysis of three Soft Drinks companies for the year
2019 as follows:
1. In the year 2019, the Company A.G. Barr PLC has taken the advantage among
the three above mentioned companies. Second in line was the Britvic PLC and
lastly Coca Cola PLC.
2. The Return on Equity for the Britvic PLC is the highest at 26.77%, followed by
Coca Cola PLC 23.62% and A.G. Barr PLC 21.21%.
3. Although Interest coverage is highest for A.G. Barr PLC 76.67 times among the
three companies. The company was in the better position to pay-out and cover
the interest on debt. But the credit collection period for the Coca Cola PLC was
much better than the other two companies that is 50 days.
4. The Liquidity and current ratio of A.G. Barr PLC was 1.62 times and 1.29 times
which is providing the company edge over Britvic PLC and Coca Cola PLC.
5. The gearing ratio of A.G. Barr PLC was 12.77%, Britvic PLC was 163.86 and
Coca Cola PLC was 144.27%. It means the former two companies had financing
its operation from high debt and have more chances to get affected by the
economic downturn.
6. The inventory and asset turnover ratio is high for A.G. Barr PLC that is 7.7 times
and 1 time, secondly for Coca Cola PLC 9.4 times and 0.6 times unchanged and
lastly for the Britvic PLC 4.5 times and 0.9 times unchanged.
⊘ This is a preview!⊘
Do you want full access?
Subscribe today to unlock all pages.
Trusted by 1+ million students worldwide
7. The Coca Cola PLC is more focused toward its employees as the per employee
profit is the highest at 53 (th) and also the company is paying the highest
average cost of around 65 (th). Followed by A.G. Barr PLC and Britvic PLC.
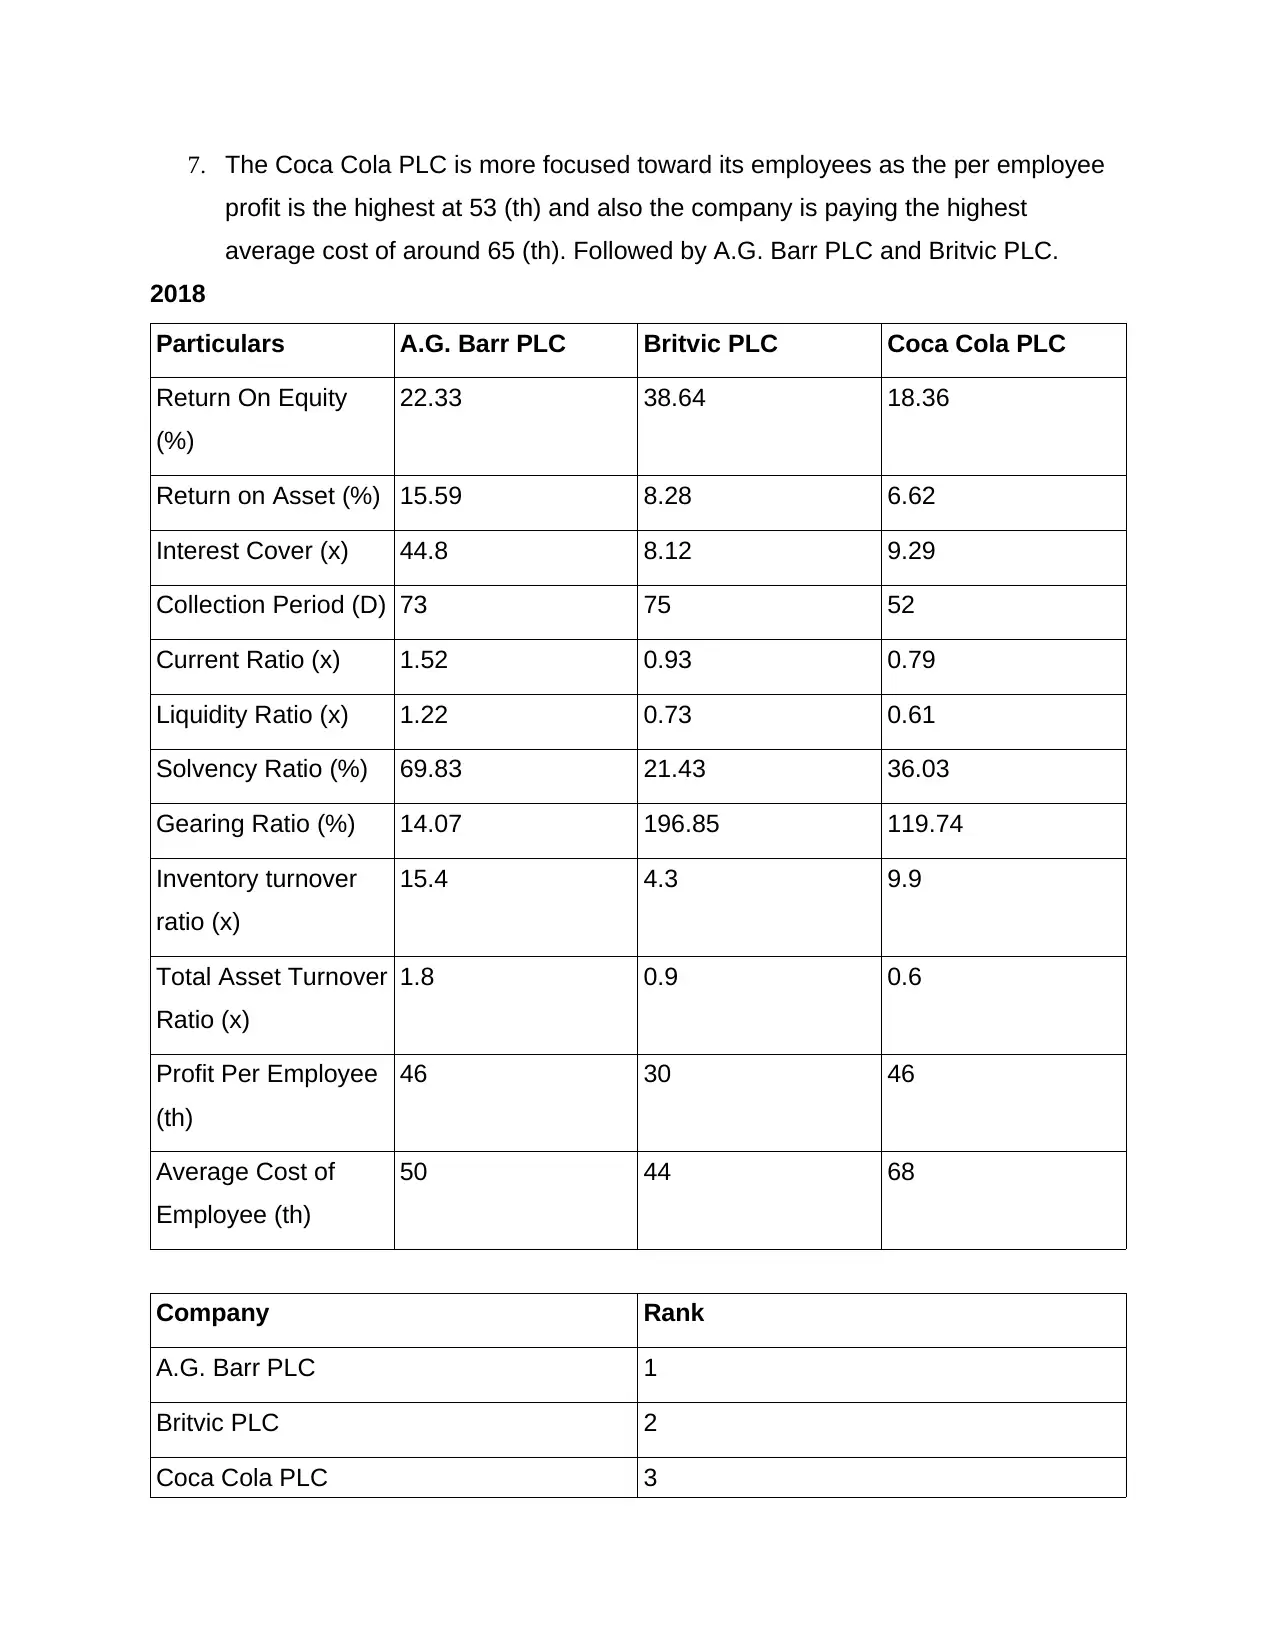
2018
Particulars A.G. Barr PLC Britvic PLC Coca Cola PLC
Return On Equity
(%)
22.33 38.64 18.36
Return on Asset (%) 15.59 8.28 6.62
Interest Cover (x) 44.8 8.12 9.29
Collection Period (D) 73 75 52
Current Ratio (x) 1.52 0.93 0.79
Liquidity Ratio (x) 1.22 0.73 0.61
Solvency Ratio (%) 69.83 21.43 36.03
Gearing Ratio (%) 14.07 196.85 119.74
Inventory turnover
ratio (x)
15.4 4.3 9.9
Total Asset Turnover
Ratio (x)
1.8 0.9 0.6
Profit Per Employee
(th)
46 30 46
Average Cost of
Employee (th)
50 44 68
Company Rank
A.G. Barr PLC 1
Britvic PLC 2
Coca Cola PLC 3
profit is the highest at 53 (th) and also the company is paying the highest
average cost of around 65 (th). Followed by A.G. Barr PLC and Britvic PLC.
2018
Particulars A.G. Barr PLC Britvic PLC Coca Cola PLC
Return On Equity
(%)
22.33 38.64 18.36
Return on Asset (%) 15.59 8.28 6.62
Interest Cover (x) 44.8 8.12 9.29
Collection Period (D) 73 75 52
Current Ratio (x) 1.52 0.93 0.79
Liquidity Ratio (x) 1.22 0.73 0.61
Solvency Ratio (%) 69.83 21.43 36.03
Gearing Ratio (%) 14.07 196.85 119.74
Inventory turnover
ratio (x)
15.4 4.3 9.9
Total Asset Turnover
Ratio (x)
1.8 0.9 0.6
Profit Per Employee
(th)
46 30 46
Average Cost of
Employee (th)
50 44 68
Company Rank
A.G. Barr PLC 1
Britvic PLC 2
Coca Cola PLC 3
Paraphrase This Document
Need a fresh take? Get an instant paraphrase of this document with our AI Paraphraser
The interpretation of the above analysis of three Soft Drinks companies for the year
2018 as follows:
1. In this year the Britvic PLC is provide better return on equity of 38.64% the
highest among the three companies. After the A.G. Barr PLC of 22.33% and
lowest Coca Cola PLC of 18.36%.
2. Return on Asset is high for A.G. Barr PLC of 15.59%, for Britvic PLC 18.28% and
for Coca Cola PLC 6.62%. Higher the percentage of ROA means the better
company is using its Asset for generating returns.
3. The Credit collection period Coca Cola PLC is the lowest of 52 days. Followed by
A.G. Barr PLC of 73 days and Britvic PLC of 75 days. It means how fast the
company is collecting its money from its creditors.
4. Current ratio for A.G. Barr PLC was better 1.52 times, then of Britvic PLC 0.93
times and at last for Coca Cola PLC 0.79 times. It means A.G. Barr PLC had
more current asset to maintain liquidity.
5. Solvency Ratio means how much percent the company is able to payout its long-
term and short-term debt at the time of solvency. Britvic PLC had the lowest
solvency ratio of 21.43%, followed by Coca Cola PLC 36.03% and A.G. Barr PLC
69.83%.
6. The inventory and asset turnover ratio is high for A.G. Barr PLC that is 15.4 times
and 1.8 time, secondly for Coca Cola PLC 9.9 times and 0.6 times and lastly for
the Britvic PLC 4.3 times and 0.9 times.
7. In year 2018 the performance of the employees of A.G. Barr PLC and Coca Cola
PLC were at same level 46 (th) and average cost of employees provided by the
Coca Cola PLC is highest 68 (th), followed by A.G. Barr PLC 50 (th) and lastly by
Britvic PLC 44 (th).
1.c Argument
From the above analysis of two years’ performance of the three companies A.G.
Barr PLC
Britvic PLC and Coca Cola PLC. It has been found out that the company A.G. Barr PLC
had outperformed in the provided two years viz. 2018-2019 continuously. The
investment in the company A.G. Barr PLC would be a profitable venture. The company
is constantly for previous two years provide average 21.77% return on equity. It has
been found out that the company is using its asset well and generating returns out of it.
The company had the highest interest coverage among the three companies. Although
the credit collection period is not quite well as the company has to wait for more than
two months to receive from the creditors. If the funds were to re-collect earlier then the
company might use that funds for its operations sooner and generate more revenue.
The A.G. Barr PLC had maintained highest degree of liquidity among the three
companies. The company is complete its working capital requirements well (Sahid and
et.al. 2020). Along with the company is also maintaining high solvency rate that would
provide the company advantage over its competitors. The company is also keep its
gearing ratio low by financing its operations low on debt as in the unforeseen event the
company has to pay out of its revenues less which in the end benefit the stakeholders of
the company.
2.a Business Financing
Companies are needed finance to expand its business activities so as to achieve
a sustainable growth and revenue generation. The companies have to sort the different
sources of the finance viz. From the internal source or from the external sources. The
choice of source is depending on the availability and the cost of financing (Triantis,
2018).
Internal Source of Long-term Finance
Retained Earnings
The company uses this source of the financing from its distributable profits. Instead of
paying the dividend the company chooses to retained the earning to finance the activity.
Example: Let Say Company X has Profit After Interest and Tax for the Year is Pound
10000. The company decided to retained that earnings for the expansion purpose
instead of distributing dividend. The cost of financing is nil in this case only the risk is
the shareholders will not get the dividend payout. As the financing of the funds is done
from the internal source there is no impact on the cash flows of the company.
⊘ This is a preview!⊘
Do you want full access?
Subscribe today to unlock all pages.
Trusted by 1+ million students worldwide
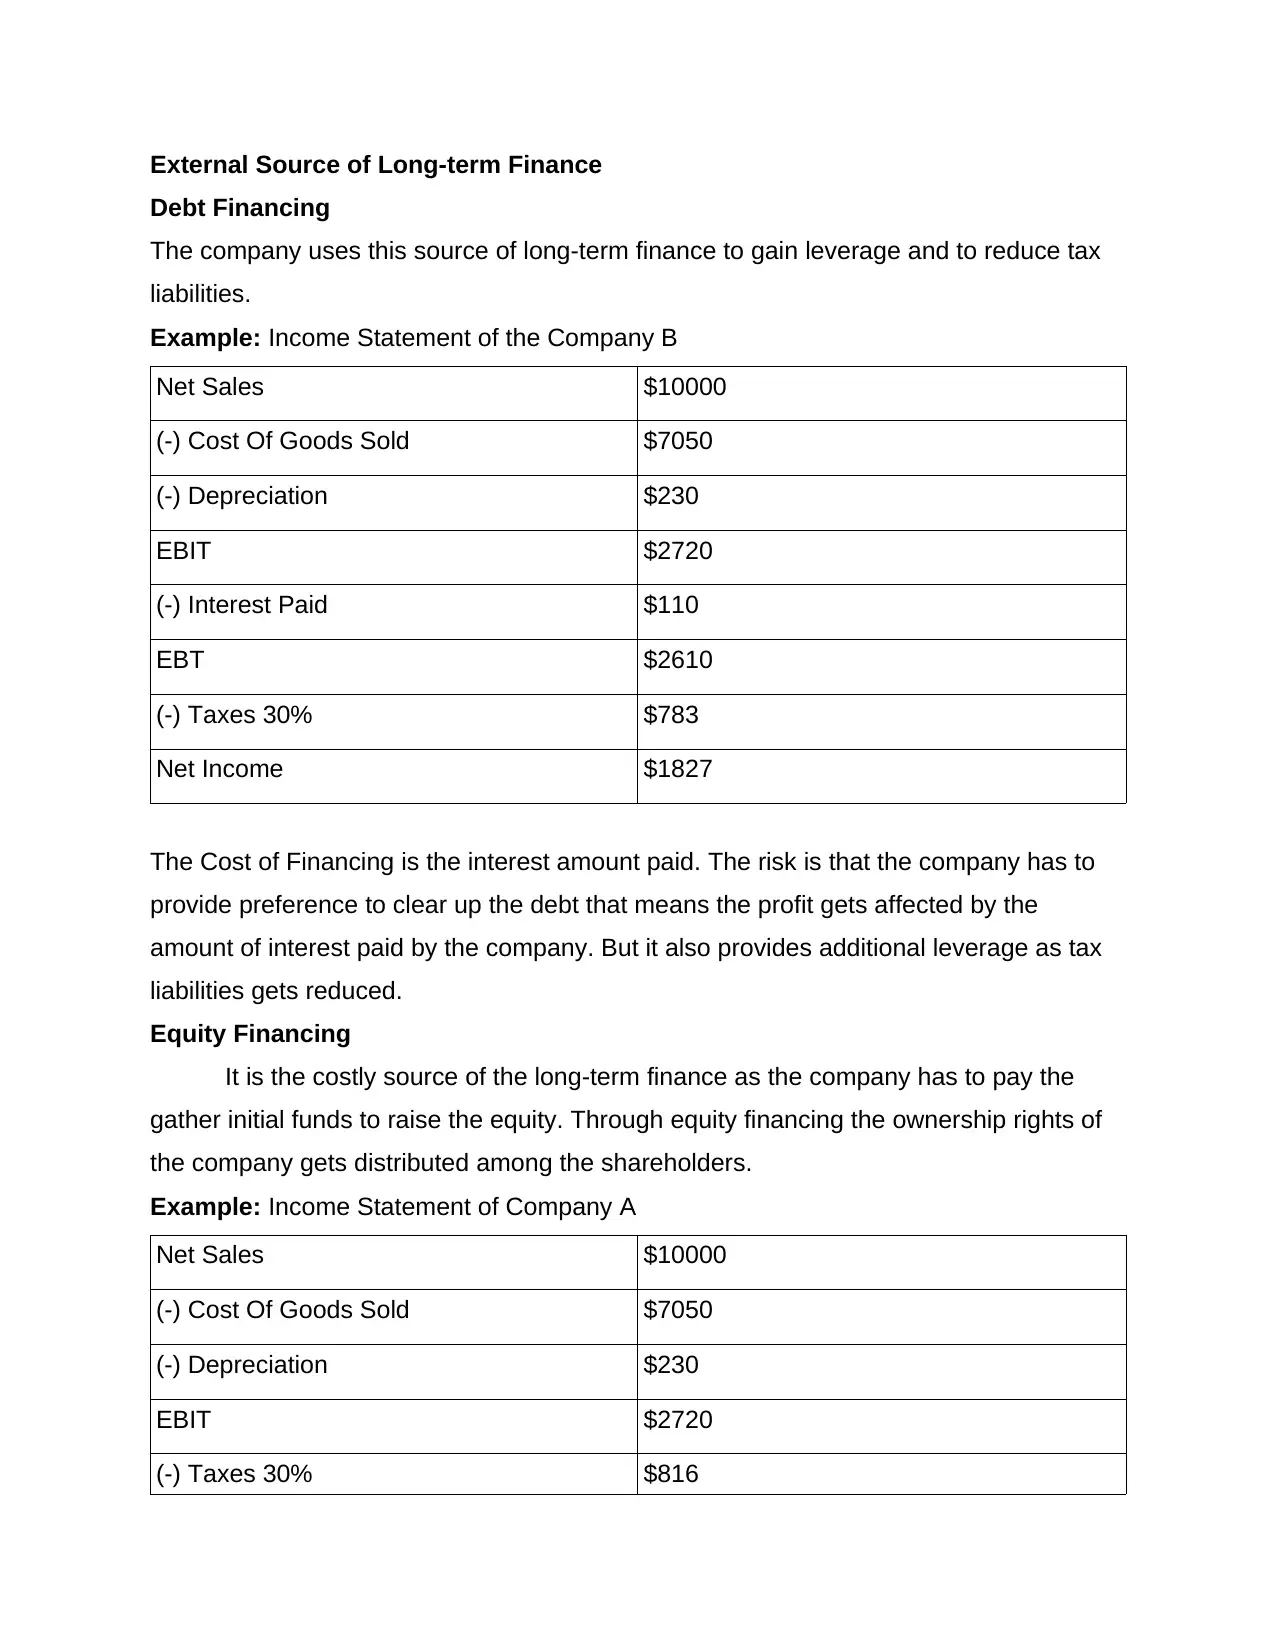
External Source of Long-term Finance
Debt Financing
The company uses this source of long-term finance to gain leverage and to reduce tax
liabilities.
Example: Income Statement of the Company B
Net Sales $10000
(-) Cost Of Goods Sold $7050
(-) Depreciation $230
EBIT $2720
(-) Interest Paid $110
EBT $2610
(-) Taxes 30% $783
Net Income $1827
The Cost of Financing is the interest amount paid. The risk is that the company has to
provide preference to clear up the debt that means the profit gets affected by the
amount of interest paid by the company. But it also provides additional leverage as tax
liabilities gets reduced.
Equity Financing
It is the costly source of the long-term finance as the company has to pay the
gather initial funds to raise the equity. Through equity financing the ownership rights of
the company gets distributed among the shareholders.
Example: Income Statement of Company A
Net Sales $10000
(-) Cost Of Goods Sold $7050
(-) Depreciation $230
EBIT $2720
(-) Taxes 30% $816
Paraphrase This Document
Need a fresh take? Get an instant paraphrase of this document with our AI Paraphraser
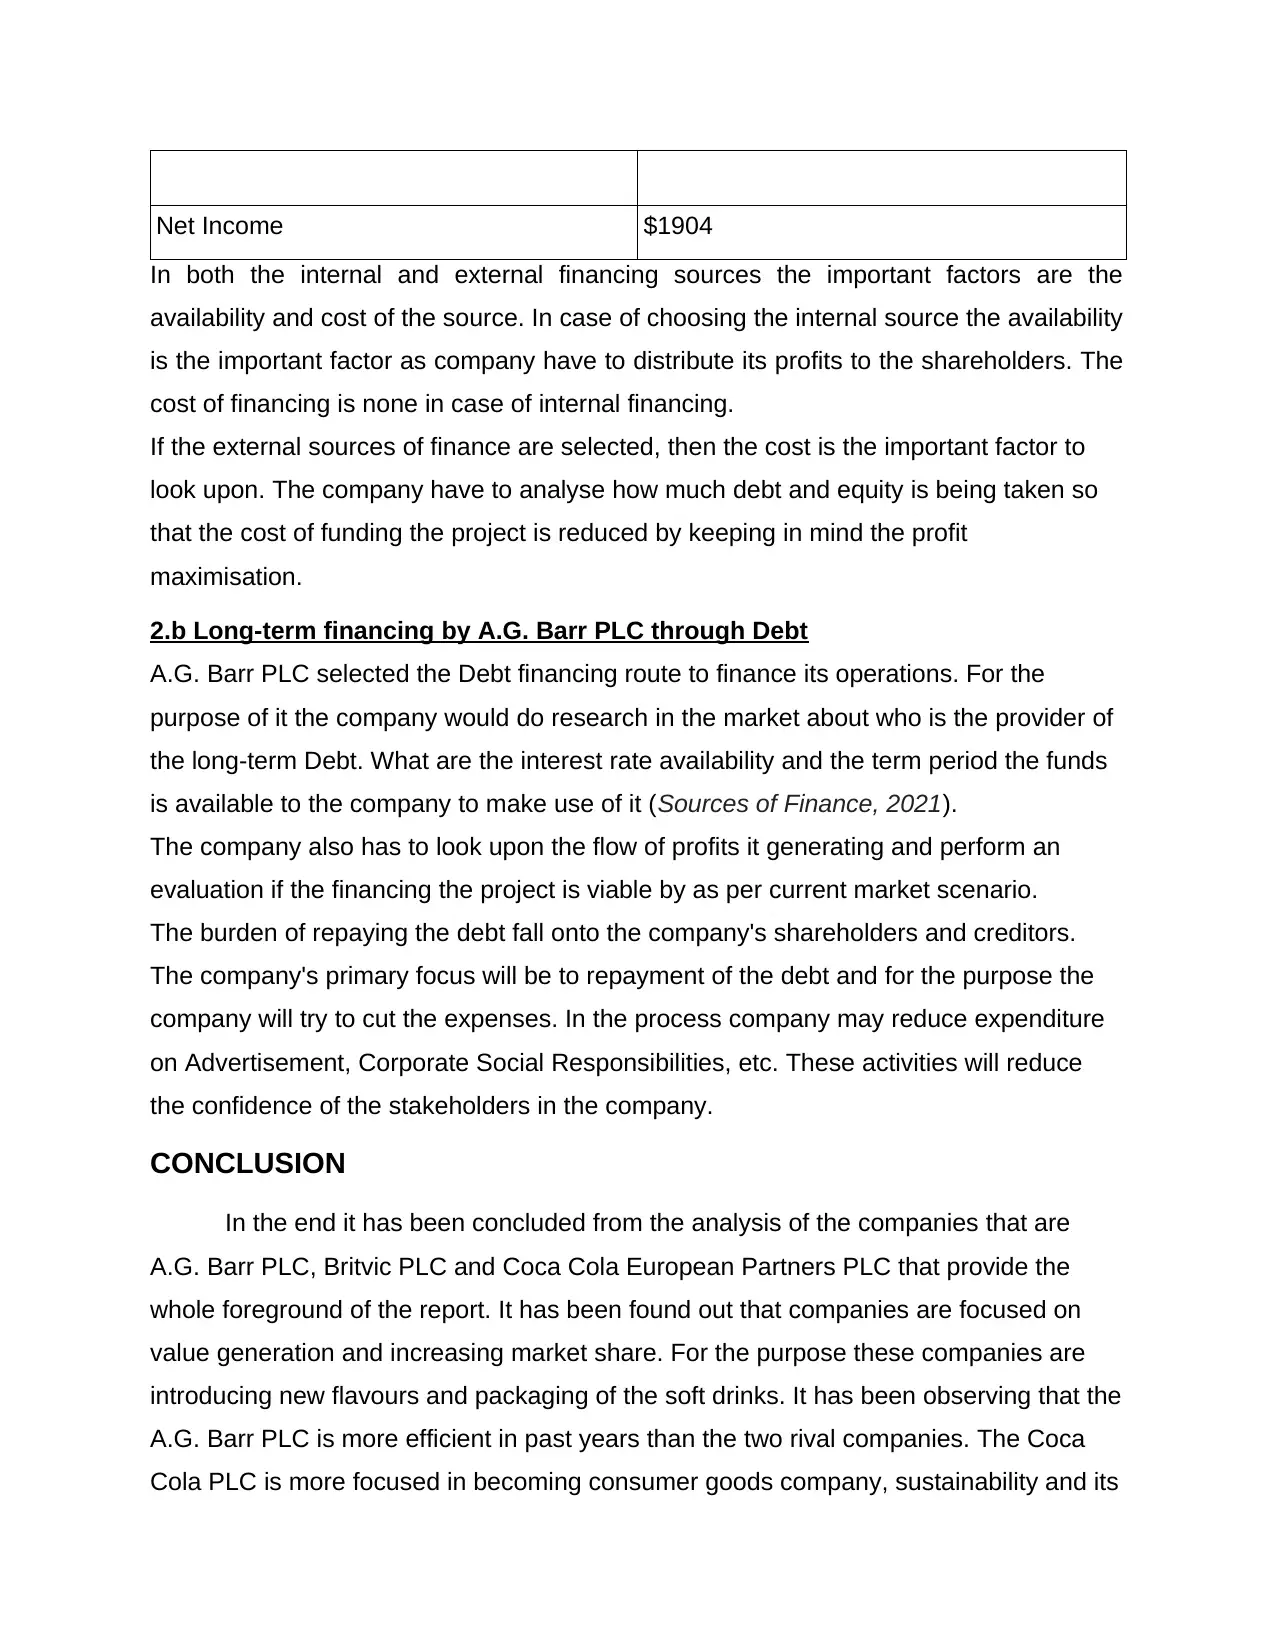
Net Income $1904
In both the internal and external financing sources the important factors are the
availability and cost of the source. In case of choosing the internal source the availability
is the important factor as company have to distribute its profits to the shareholders. The
cost of financing is none in case of internal financing.
If the external sources of finance are selected, then the cost is the important factor to
look upon. The company have to analyse how much debt and equity is being taken so
that the cost of funding the project is reduced by keeping in mind the profit
maximisation.
2.b Long-term financing by A.G. Barr PLC through Debt
A.G. Barr PLC selected the Debt financing route to finance its operations. For the
purpose of it the company would do research in the market about who is the provider of
the long-term Debt. What are the interest rate availability and the term period the funds
is available to the company to make use of it (Sources of Finance, 2021).
The company also has to look upon the flow of profits it generating and perform an
evaluation if the financing the project is viable by as per current market scenario.
The burden of repaying the debt fall onto the company's shareholders and creditors.
The company's primary focus will be to repayment of the debt and for the purpose the
company will try to cut the expenses. In the process company may reduce expenditure
on Advertisement, Corporate Social Responsibilities, etc. These activities will reduce
the confidence of the stakeholders in the company.
CONCLUSION
In the end it has been concluded from the analysis of the companies that are
A.G. Barr PLC, Britvic PLC and Coca Cola European Partners PLC that provide the
whole foreground of the report. It has been found out that companies are focused on
value generation and increasing market share. For the purpose these companies are
introducing new flavours and packaging of the soft drinks. It has been observing that the
A.G. Barr PLC is more efficient in past years than the two rival companies. The Coca
Cola PLC is more focused in becoming consumer goods company, sustainability and its
main highlight is its policies that are concentrated on employees that have a vital role in
generating revenues and company’s success. At the end Britvic PLC had
underperformed and did not show much success. The company is high on debt and the
credit collection period it also high which hindering the company's flow of working capital
requirements and in its operations. The employees of the company did not perform at
par with the average cost company putting. At the end A.G. Barr PLC is found out to be
the sound company recommended for the investment, followed by Coca Cola European
Partners PLC and lastly Britvic PLC.
⊘ This is a preview!⊘
Do you want full access?
Subscribe today to unlock all pages.
Trusted by 1+ million students worldwide
1 out of 13
Related Documents


Your All-in-One AI-Powered Toolkit for Academic Success.
+13062052269
info@desklib.com
Available 24*7 on WhatsApp / Email
![[object Object]](/_next/static/media/star-bottom.7253800d.svg)
Unlock your academic potential
Copyright © 2020–2026 A2Z Services. All Rights Reserved. Developed and managed by ZUCOL.