Financial Performance and Risk Analysis: Alliance Pharma vs Allergy

Verified

Added on  2023/01/12

|24
|3295
|29
Report
AI Summary
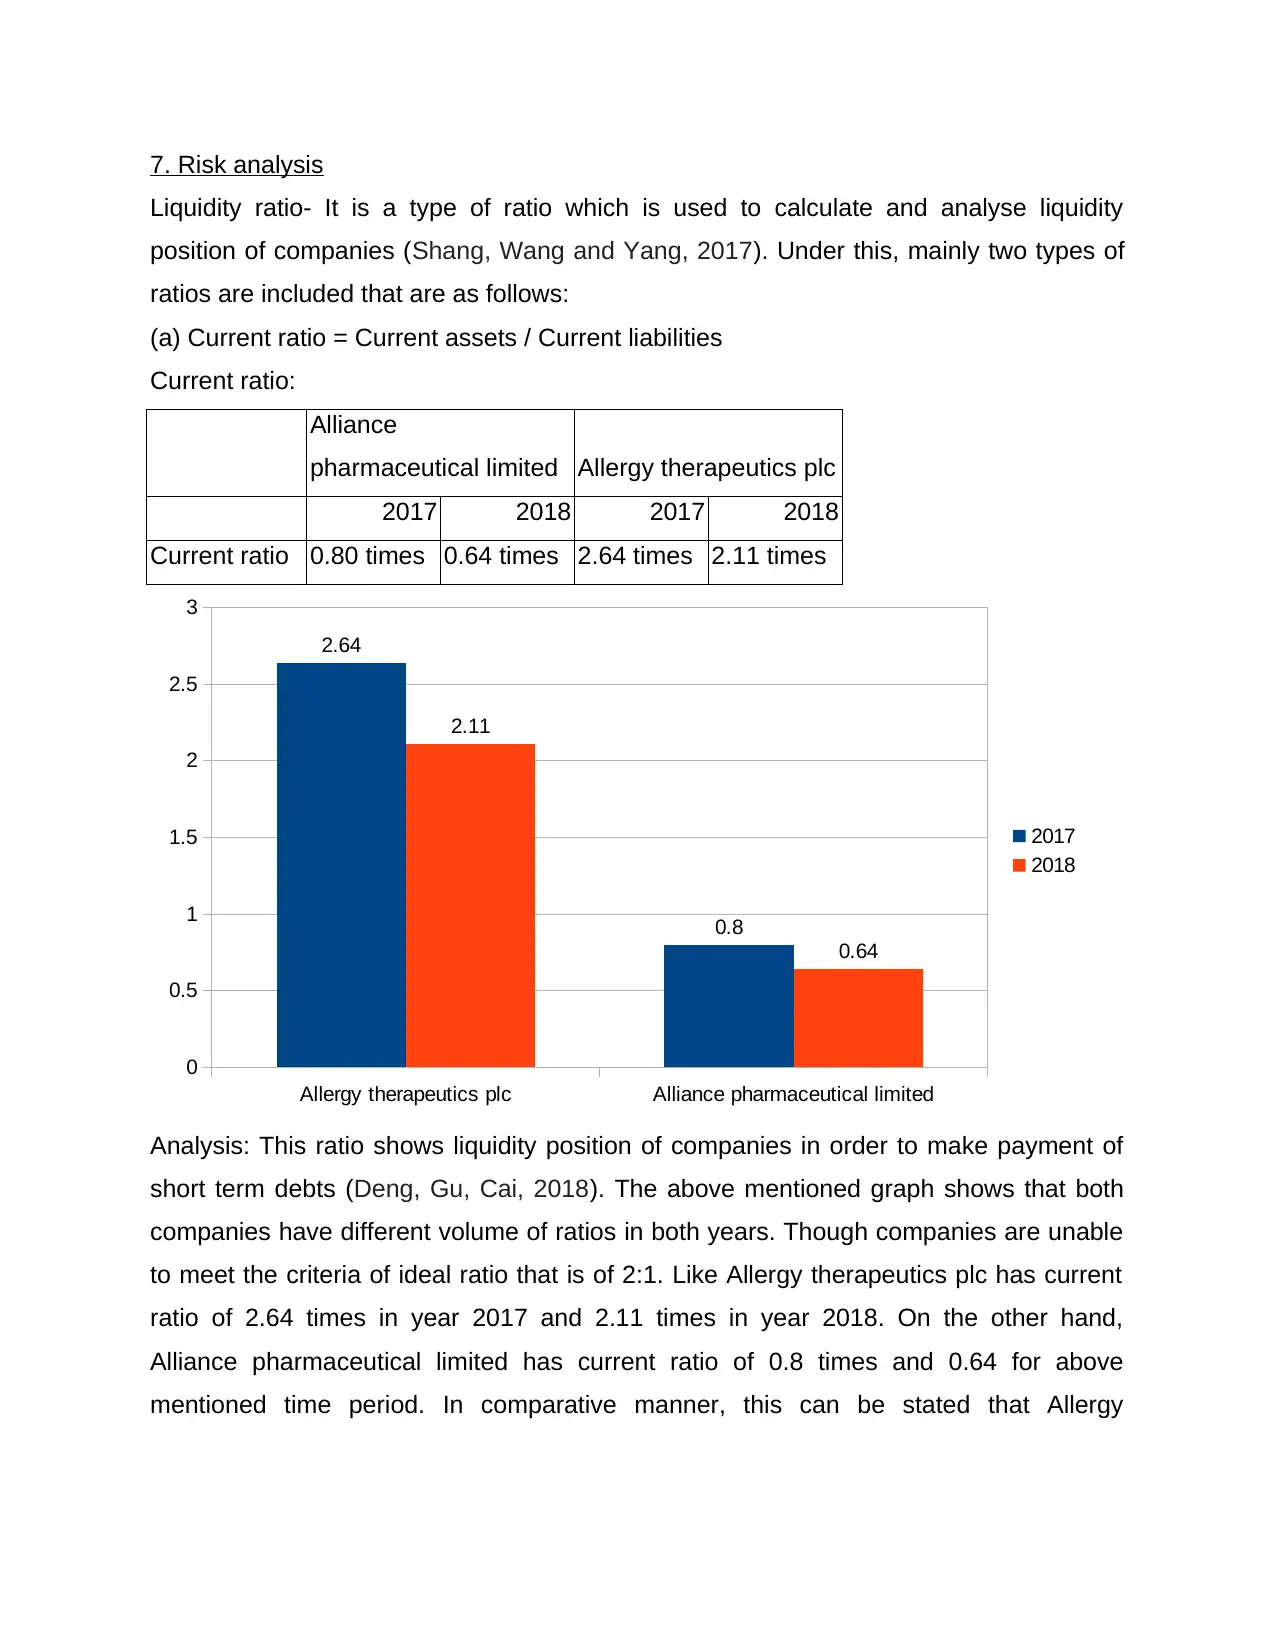
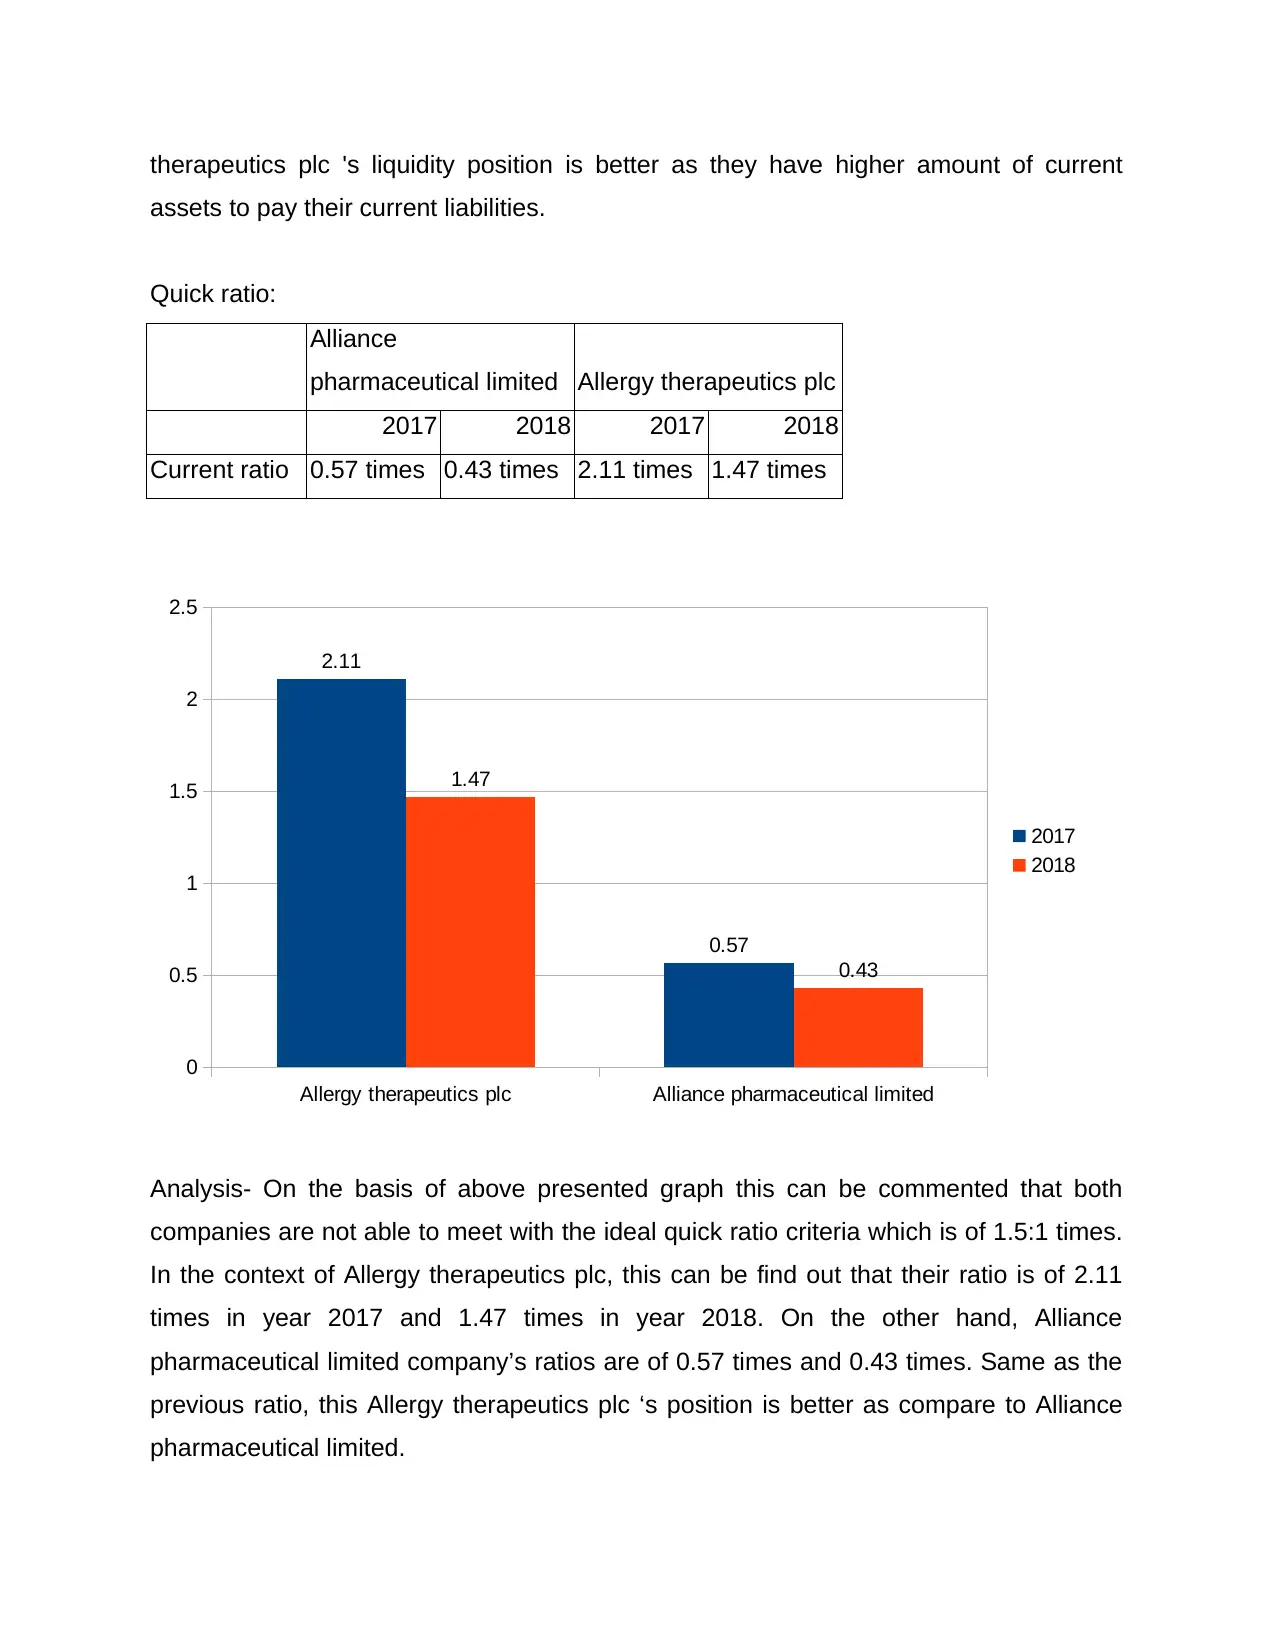
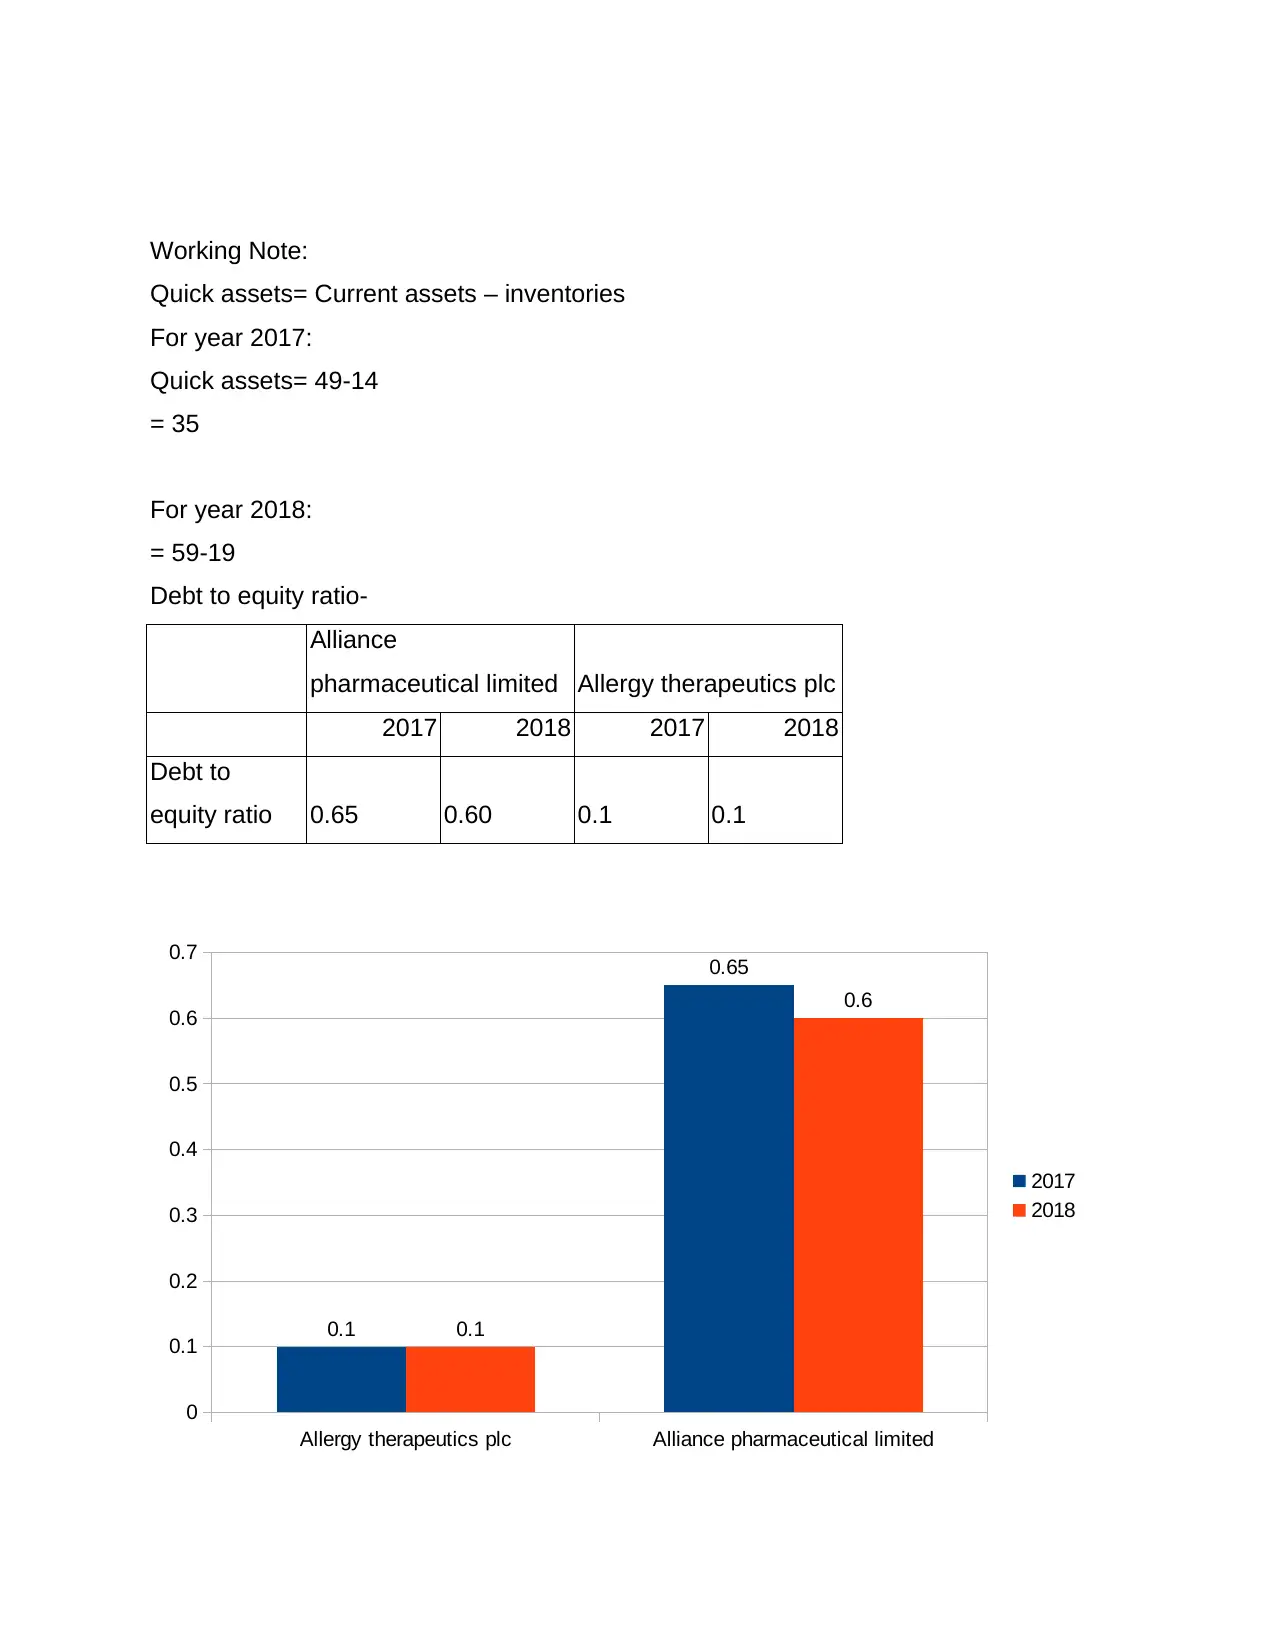
This report provides a comprehensive financial performance analysis of Alliance Pharmaceuticals Limited and Allergy Therapeutics Plc, both operating in the UK pharmaceutical industry. The report begins with an introduction, industry analysis, and company overviews, followed by a discussion of business strategies and operational activities. The core of the report focuses on evaluating financial performance through profitability, risk, and efficiency ratios, comparing the two companies across various metrics. Profitability ratios such as gross profit, net profit, and operating profit ratios are calculated and analyzed. Risk analysis involves assessing liquidity and solvency using current, quick, and debt-to-equity ratios. Managerial performance is evaluated using efficiency ratios, specifically the accounts receivable turnover ratio. The report uses financial data from 2017 and 2018 to draw comparisons, identify strengths and weaknesses, and provide insights into the competitive landscape of the pharmaceutical sector. The analysis highlights differences in financial health, operational efficiency, and risk profiles between the two companies.
Document Page
MANAGING OPERATIONS AND FINANCE
tabler-icon-diamond-filled.svg

Paraphrase This Document

Need a fresh take? Get an instant paraphrase of this document with our AI Paraphraser
Document Page
Contents
Chapter 1.......................................................................................................................................3
1. Introduction..................................................................................................................3
2. Industry analysis-............................................................................................................3
3. Company overview:........................................................................................................4
4. Business Strategy...........................................................................................................5
5. Operational activities......................................................................................................6
Chapter 2 EVALUATION OF PERFORMANCE:...................................................................6
6. Financial performance....................................................................................................7
7. Risk analysis..................................................................................................................10
8. Managerial performance..............................................................................................14
9. Market performance......................................................................................................17
10. Market movements.....................................................................................................18
REFERENCES............................................................................................................................19
APPENDIX...................................................................................................................................20
Document Page
Chapter 1
1. Introduction
The analysis of financial data is extremely relevant to the business as it allows
the financial successes and deficiencies of an organization to be identified easily. In
fact, it allows one organization to evaluate its comparative success. This is important for
business entities to manage their operations and finance so that effective utilisation of
resources can become possible. In the absence of proper management of operations
and activities of companies, it may become difficult to achieve predetermined objectives
(Butler, 2016). The project report is based on analysis of performance of a company
which is Alliance pharmaceuticals limited. This company is located in London, UK and
was founded in year 1996. Company operates its operations in providing
pharmaceutical products to customers. The report covers detailed information about
chosen company, its financial performance and comparison with Allergy therapeutics
plc. Allergy Therapeutics Plc is a medication manufacturer. The organization relies on
aluminium-free goods for prevention and avoiding reactions. This company was
founded in year 2004 and it’s headquartered in London, United Kingdom. The analysis
is carried out on the basis of the financial details obtained in the 2017 financial reports.
It is important to consider which of the two firms is competitive in the healthcare industry
by this comparative study.
2. Industry analysis-
In the UK there are about 73,000 workers in the pharmaceutical sector and, in 2007, the
UK GDP were allocated EUR8.4 billion with a sum of approximately £3.9 billion spent in
R&D. In 2007, pharmaceutical shipments to the United Kingdom amounted to £14.6
billion, generating a trade gap of £4.3 billion in pharmaceuticals.
In 2017, UK Pharmacy staff is 73,000 relative to 114,000 in Germany in 2015, 92,000 in
Germany in 2014, and 723,000 in the EU as a whole. As of 2016, 281,440 workers in
the United States work in the pharmacy sector.
GlaxoSmithKline and AstraZeneca, the fifth and sixth biggest pharmaceutical firms in
the country, are home to their 2009 market share. Pfizer, Novartis, Hoffmann – La
Document Page
Roche, and Eisai are multinational corporations with significant involvement in the UK
pharmaceutical business. One in five pharmaceutical drugs worldwide have been
produced in the UK.
3. Company overview:
Alliance pharmaceutical limited:
Alliance pharmaceutical limited is a leading international healthcare entity which
is inter-connected with different brands. This company is listed in London stock
exchange and started trading in year 1998. The product portfolio of this company is too
wide that consists various medical devices, therapy equipment’s and many more.
Allergy Therapeutics Plc:
Allergy Therapeutics Plc is a medication manufacturer. The Group relies on
aluminum safe goods for the diagnosis and avoidance of allergies. The branches of the
Community are Northern Europe including groups including Austria, Germany, the
Netherlands, Sweden and Southern Europe like Italy and Spain. Throughout the field of
detection, evaluation, and management of allergic diseases, this organization offers
healthcare providers with knowledge based on the vaccine of allergies, often known as
specific antibody stimulation or desensitization.
tabler-icon-diamond-filled.svg

Paraphrase This Document

Need a fresh take? Get an instant paraphrase of this document with our AI Paraphraser
Document Page
4. Business Strategy
Alliance pharmaceutical limited:
A business strategy is a collection of tactical activities and actions utilized by a
organization to gain consumers, succeed effectively, boost efficiency, and meet
organizational goals. It explains how to conduct business and accomplish the
required goals. Alliance pharmaceutical limited company’s business strategies are
as follows:
Key feature of differentiation- Alliance pharmaceutical limited is different from rest
of pharmaceutical companies located in United Kingdom. This is so because of
following reasons:
Providing pharmaceutical products at worldwide level. While most of the
pharmaceutical companies in UK operates its operations at small level (Fine,
Padurean and Naumov, 2018).
Along with the manufacturing and distributing of pharmaceutical products,
company deals in acquisition & licensing of pharmaceutical products that makes
it different.
So, these are the key feature of above company that makes it different from rest of
pharmaceutical companies located in United Kingdom.
Allergy Therapeutics plc:
The business model of allergy therapeutics depends around how the
organization creates revenue from organic and inorganic development for investors.
The business reinvests profits in research and growth, helping our European
businesses to flourish and extend into new markets such as the USA.
Document Page
5. Operational activities
Alliance pharmaceutical limited:
Alliance pharmaceutical limited company's key operational activities are
acquisition and licensing of key pharmaceutical products. As well as marketing of those
products. In addition, capital intensive activities like production, warehousing and
logistics are processed to class leading specialists in fields (Babich and Kouvelis, 2018).
This company allocate its products by wholesalers, retail pharmacies, hospitals and key
global network of distributors.
Allergy Therapeutics plc:
Allergy Therapeutics plc firmly commitments itself in its practices and operations
to corporate ethics, strong ethical standards, and expertise. The Board of Directors (the
"Board") of the Organization endorses the best expectations of corporate management
and is responsible to the owners as an integral part of this dedication.
Chapter 2 EVALUATION OF PERFORMANCE:
Document Page
6. Financial performance
1. Profitability ratio- Under it, there is different types of ratios which are calculated in
order to assess actual financial position of a company (dellaBadia Simon, 2019).
Herein, underneath some types of ratios are mentioned below in such manner that are
as follows:
(a) Gross profit ratio = Gross profit / Net sales * 100
Alliance pharmaceutical
limited Allergy therapeutics plc
2017 2018 2017 2018
GROSS
PROFIT 57.28% 61.86% 73.43% 75.00%
Allergy therapeutics plc Alliance pharmaceutical limited
0
10
20
30
40
50
60
70
80 73.43
57.28
75
61.86
2017
2018
Analysis- On the basis of above presented graph this can be find out that Allergy
therapeutics plc's gross profit ratio is higher in both years as compare to Alliance
pharmaceutical limited. Such as in year 2017, Allergy therapeutics plc's ratio was of
73.43% that raised and became of 75%. While Alliance pharmaceutical limited
tabler-icon-diamond-filled.svg

Paraphrase This Document

Need a fresh take? Get an instant paraphrase of this document with our AI Paraphraser
Document Page
company's ratio was 57.28% and 61.86% for year 2017 and 2018. It shows that Allergy
therapeutics plc 's performance is better in terms of gross profitability.
(b) Net profit ratio:
Alliance pharmaceutical
limited Allergy therapeutics plc
2017 2018 2017 2018
NET
PROFIT
RATIO 28.15% 15.25% -3.87% 11.20%
Allergy therapeutics plc Alliance pharmaceutical limited
-15
-10
-5
0
5
10
15
20
25
30
35
-3.87
28.15
-11.2
15.25
2017
2018
Analysis- On the basis of above presented graph this can be find out that Alliance
pharmaceutical limited' s net profit ratio is too higher in both years as compare to Allergy
therapeutics plc. Such as in year 2017, Allergy therapeutics plc's ratio was of -3.87%
that reduced and became of -11.2%. While Alliance pharmaceutical limited company's
ratio was 28.15% and 15.25% for year 2017 and 2018. This is showing that Alliance
pharmaceutical limited has positive ratios and able to generate higher income from its
operations while Allergy therapeutics plc is unable to do so and facing loss in both
years.
(c) Operating profit ratio:
Alliance pharmaceutical Allergy therapeutics plc
Document Page
limited
2017 2018 2017 2018
Operating
profit ratio 27.18% 19.49% -2.96% -9.85%
Allergy therapeutics plc Alliance pharmaceutical limited
-15
-10
-5
0
5
10
15
20
25
30
-2.96
27.18
-9.85
19.19
2017
2018
Analysis- Similar as the net profit ratio, the operating profit ratio of Allergy therapeutics
is in negative. The above presented graph shows that that Alliance pharmaceutical
limited' s operating profit ratio is too higher in both years as compare to Allergy
therapeutics plc. Such as in year 2017, Allergy therapeutics plc's ratio was of -2.96%
that reduced and became of -9.85%. While Alliance pharmaceutical limited company's
ratio was 27.18% and 19.19% for year 2017 and 2018. This is showing that Alliance
pharmaceutical limited has positive ratios and able to generate higher income from its
operations while Allergy therapeutics plc is unable to do so and facing loss in both
years.
Document Page
7. Risk analysis
Liquidity ratio- It is a type of ratio which is used to calculate and analyse liquidity
position of companies (Shang, Wang and Yang, 2017). Under this, mainly two types of
ratios are included that are as follows:
(a) Current ratio = Current assets / Current liabilities
Current ratio:
Alliance
pharmaceutical limited Allergy therapeutics plc
2017 2018 2017 2018
Current ratio 0.80 times 0.64 times 2.64 times 2.11 times
Allergy therapeutics plc Alliance pharmaceutical limited
0
0.5
1
1.5
2
2.5
3
2.64
0.8
2.11
0.64
2017
2018
Analysis: This ratio shows liquidity position of companies in order to make payment of
short term debts (Deng, Gu, Cai, 2018). The above mentioned graph shows that both
companies have different volume of ratios in both years. Though companies are unable
to meet the criteria of ideal ratio that is of 2:1. Like Allergy therapeutics plc has current
ratio of 2.64 times in year 2017 and 2.11 times in year 2018. On the other hand,
Alliance pharmaceutical limited has current ratio of 0.8 times and 0.64 for above
mentioned time period. In comparative manner, this can be stated that Allergy
tabler-icon-diamond-filled.svg

Paraphrase This Document

Need a fresh take? Get an instant paraphrase of this document with our AI Paraphraser
Document Page
therapeutics plc 's liquidity position is better as they have higher amount of current
assets to pay their current liabilities.
Quick ratio:
Alliance
pharmaceutical limited Allergy therapeutics plc
2017 2018 2017 2018
Current ratio 0.57 times 0.43 times 2.11 times 1.47 times
Allergy therapeutics plc Alliance pharmaceutical limited
0
0.5
1
1.5
2
2.5
2.11
0.57
1.47
0.43
2017
2018
Analysis- On the basis of above presented graph this can be commented that both
companies are not able to meet with the ideal quick ratio criteria which is of 1.5:1 times.
In the context of Allergy therapeutics plc, this can be find out that their ratio is of 2.11
times in year 2017 and 1.47 times in year 2018. On the other hand, Alliance
pharmaceutical limited company’s ratios are of 0.57 times and 0.43 times. Same as the
previous ratio, this Allergy therapeutics plc ‘s position is better as compare to Alliance
pharmaceutical limited.
Document Page
Working Note:
Quick assets= Current assets – inventories
For year 2017:
Quick assets= 49-14
= 35
For year 2018:
= 59-19
Debt to equity ratio-
Alliance
pharmaceutical limited Allergy therapeutics plc
2017 2018 2017 2018
Debt to
equity ratio 0.65 0.60 0.1 0.1
Allergy therapeutics plc Alliance pharmaceutical limited
0
0.1
0.2
0.3
0.4
0.5
0.6
0.7
0.1
0.65
0.1
0.6
2017
2018
chevron_up_icon
1 out of 24
circle_padding
hide_on_mobile
zoom_out_icon
[object Object]