Financial Performance Management: Costing, Variance, and Budgeting
VerifiedAdded on 2022/12/28
|11
|2808
|311
Report
AI Summary
This report delves into financial performance management, examining various costing methods like absorption costing and activity-based costing, comparing their impacts on product profitability, and evaluating their effectiveness. It calculates and analyzes material variances, discussing the problems with current variance reporting systems and suggesting improvements. The report also explores budgeting techniques, contrasting zero-based budgeting and incremental budgeting, highlighting their strengths and weaknesses, and assessing their suitability for financial planning and control within a business context. Furthermore, it examines the application of sensitivity analysis in coping with uncertainties, demonstrating its importance in financial decision-making. The analysis includes detailed calculations, critical evaluations, and recommendations for enhancing financial performance.

FINANCIAL
PERFORMANCE
MANAGEMENT
PERFORMANCE
MANAGEMENT
Paraphrase This Document
Need a fresh take? Get an instant paraphrase of this document with our AI Paraphraser
TABLE OF CONTENTS
QUESTION 1...................................................................................................................................3
a. Cost on basis of absorbing all overheads based on labour hours............................................3
b. Calculation of cost on basis of activity based costing.............................................................4
c. Critical evaluation of result.....................................................................................................5
d. Sensitivity analysis helping manager in coping with uncertainties........................................6
QUESTION 2...................................................................................................................................6
a. Calculation of variance............................................................................................................6
b. Problem with current system of calculating and reporting variances for assessing
performance................................................................................................................................8
QUESTION 3...................................................................................................................................9
REFERENCES..............................................................................................................................11
QUESTION 1
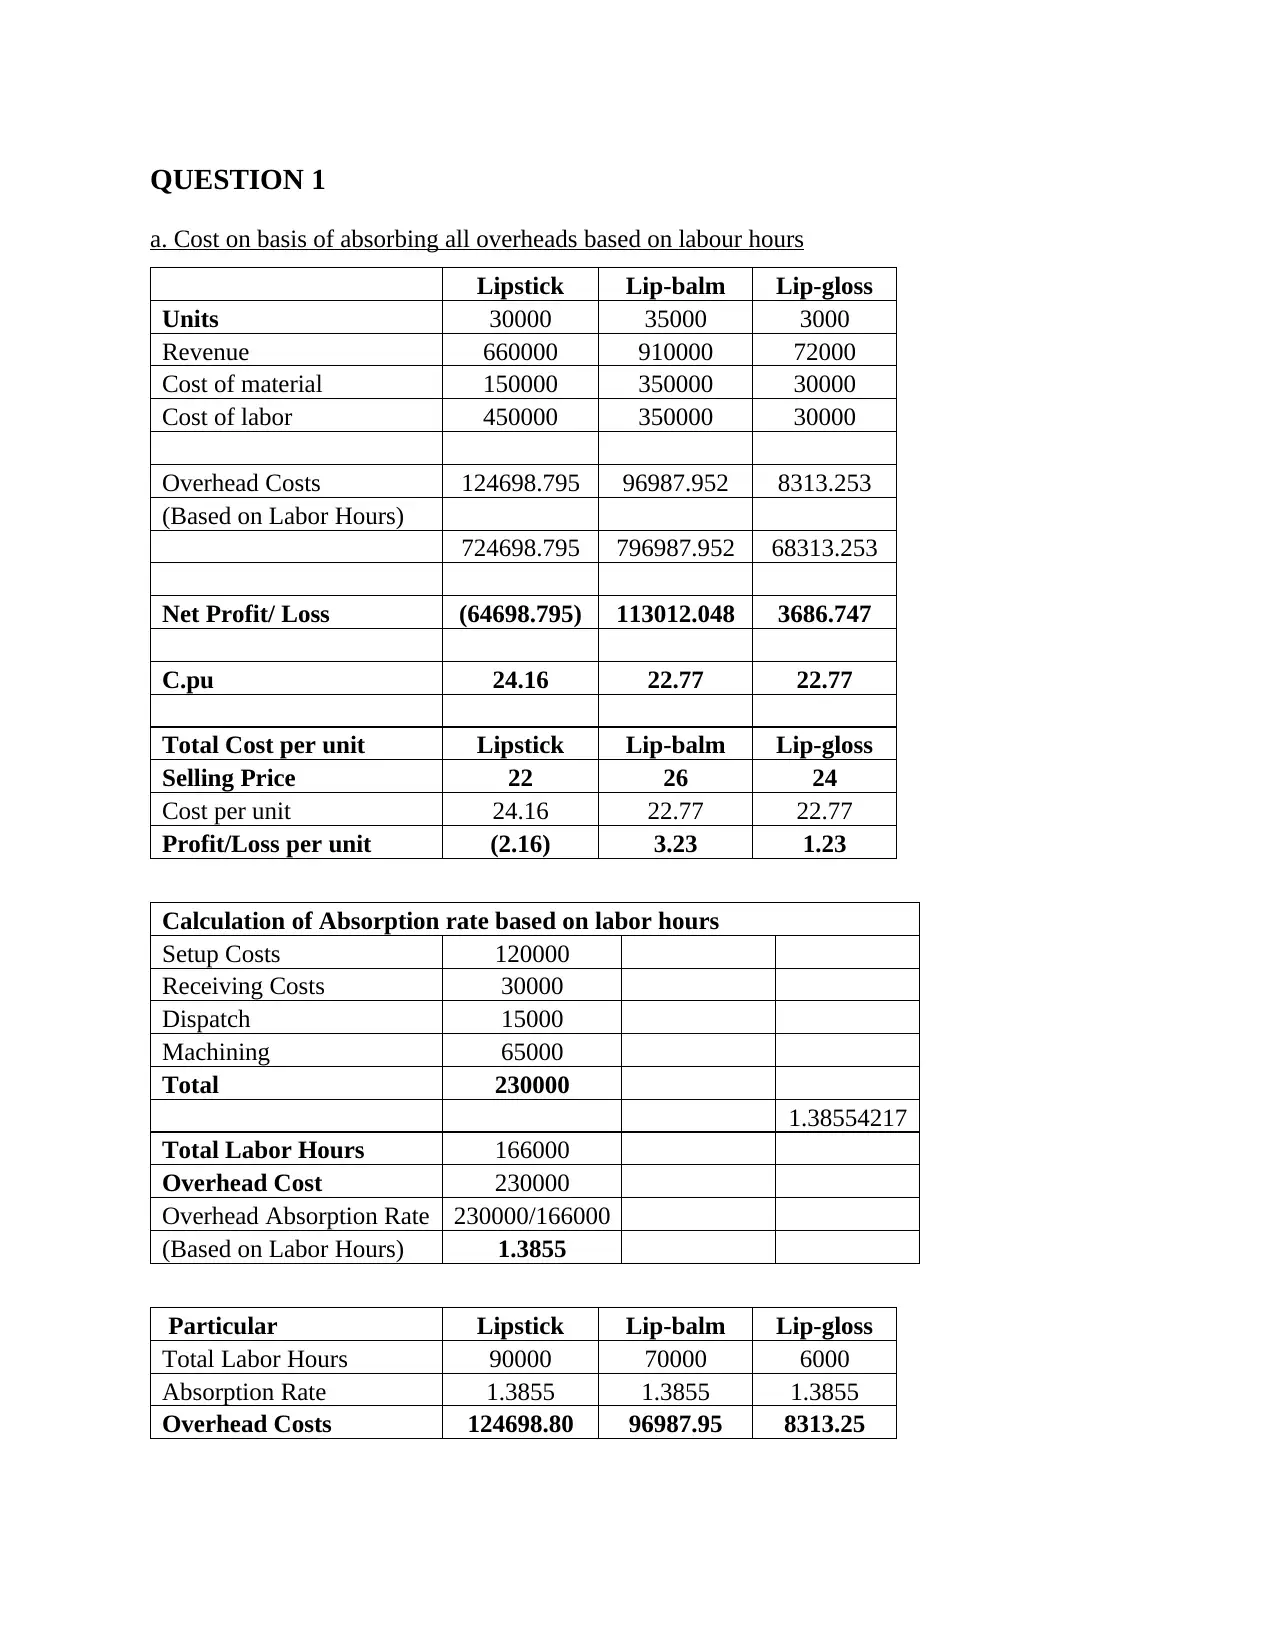
a. Cost on basis of absorbing all overheads based on labour hours
Lipstick Lip-balm Lip-gloss
Units 30000 35000 3000
Revenue 660000 910000 72000
Cost of material 150000 350000 30000
Cost of labor 450000 350000 30000
Overhead Costs 124698.795 96987.952 8313.253
(Based on Labor Hours)
724698.795 796987.952 68313.253
Net Profit/ Loss (64698.795) 113012.048 3686.747
C.pu 24.16 22.77 22.77
Total Cost per unit Lipstick Lip-balm Lip-gloss
Selling Price 22 26 24
Cost per unit 24.16 22.77 22.77
Profit/Loss per unit (2.16) 3.23 1.23
Calculation of Absorption rate based on labor hours
Setup Costs 120000
Receiving Costs 30000
Dispatch 15000
Machining 65000
Total 230000
1.38554217
Total Labor Hours 166000
Overhead Cost 230000
Overhead Absorption Rate 230000/166000
(Based on Labor Hours) 1.3855
Particular Lipstick Lip-balm Lip-gloss
Total Labor Hours 90000 70000 6000
Absorption Rate 1.3855 1.3855 1.3855
Overhead Costs 124698.80 96987.95 8313.25
⊘ This is a preview!⊘
Do you want full access?
Subscribe today to unlock all pages.
Trusted by 1+ million students worldwide
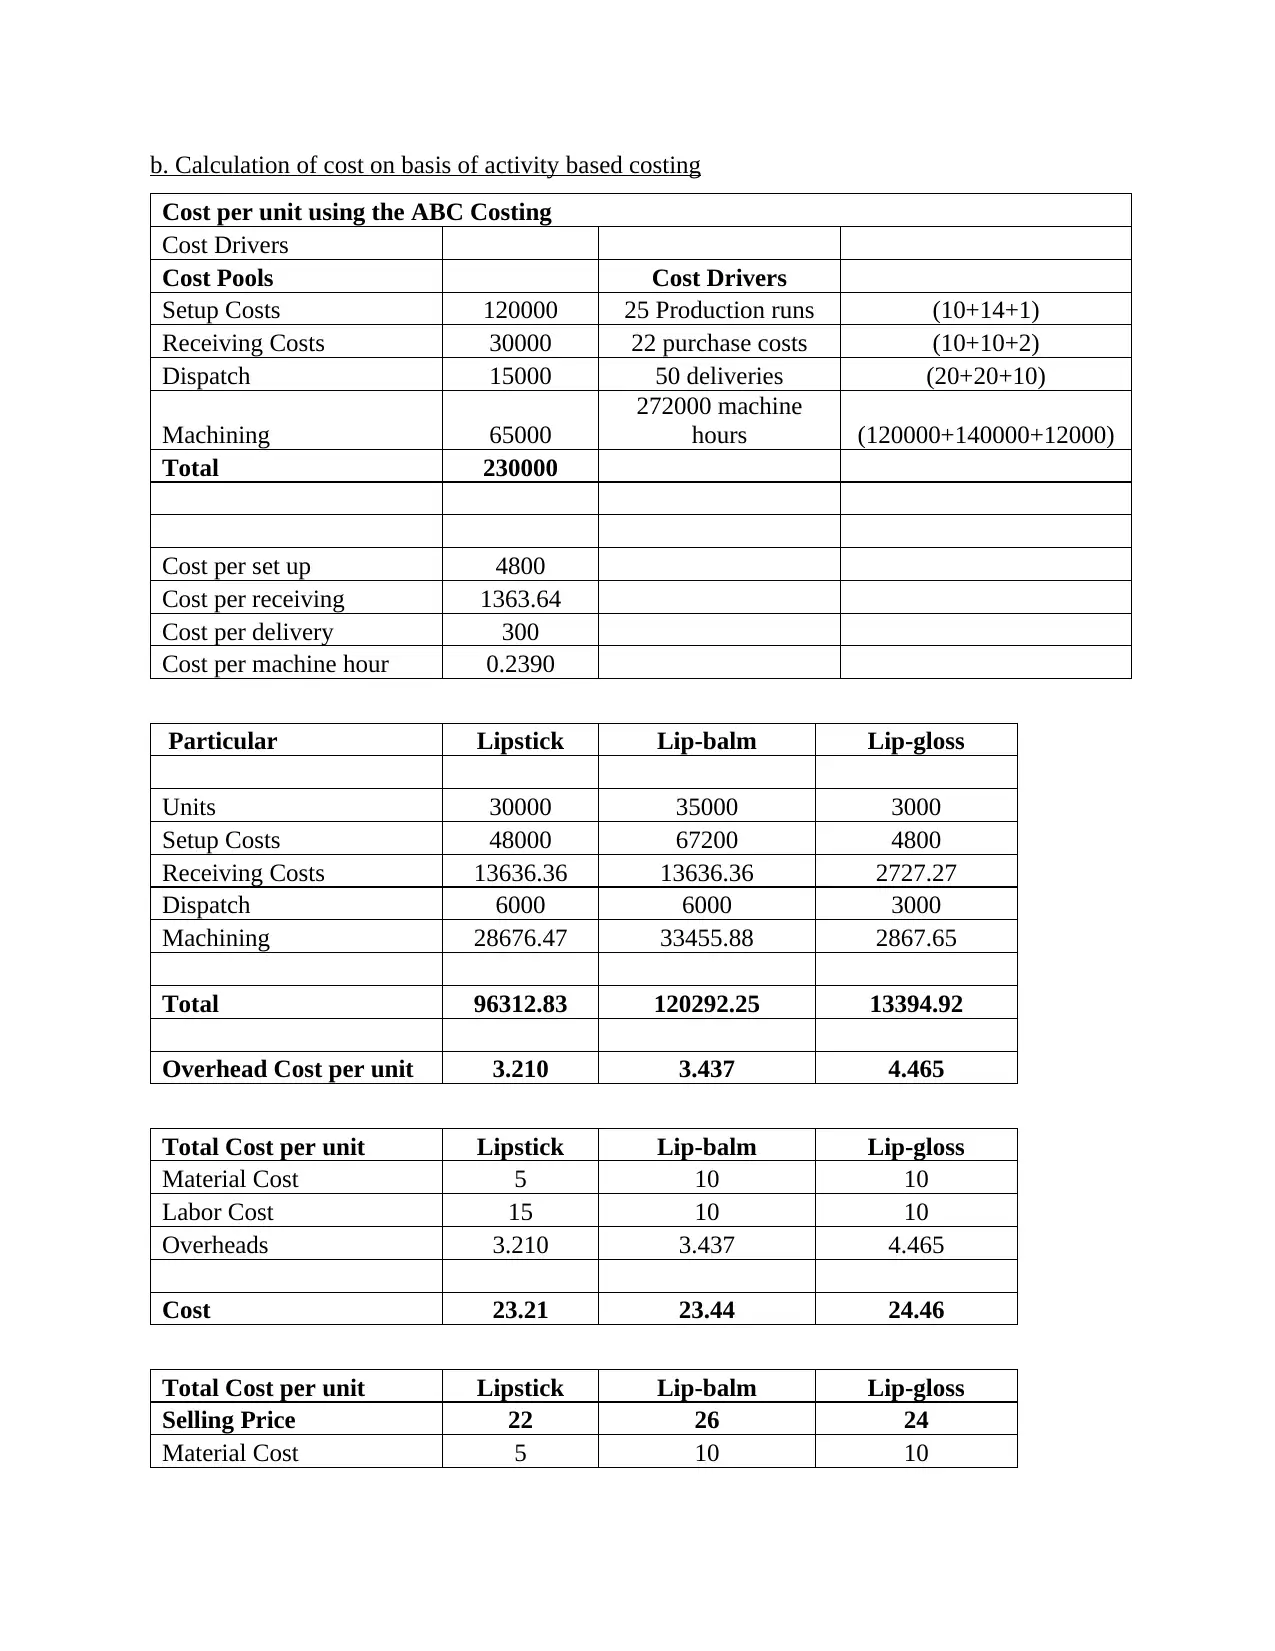
b. Calculation of cost on basis of activity based costing
Cost per unit using the ABC Costing
Cost Drivers
Cost Pools Cost Drivers
Setup Costs 120000 25 Production runs (10+14+1)
Receiving Costs 30000 22 purchase costs (10+10+2)
Dispatch 15000 50 deliveries (20+20+10)
Machining 65000
272000 machine
hours (120000+140000+12000)
Total 230000
Cost per set up 4800
Cost per receiving 1363.64
Cost per delivery 300
Cost per machine hour 0.2390
Particular Lipstick Lip-balm Lip-gloss
Units 30000 35000 3000
Setup Costs 48000 67200 4800
Receiving Costs 13636.36 13636.36 2727.27
Dispatch 6000 6000 3000
Machining 28676.47 33455.88 2867.65
Total 96312.83 120292.25 13394.92
Overhead Cost per unit 3.210 3.437 4.465
Total Cost per unit Lipstick Lip-balm Lip-gloss
Material Cost 5 10 10
Labor Cost 15 10 10
Overheads 3.210 3.437 4.465
Cost 23.21 23.44 24.46
Total Cost per unit Lipstick Lip-balm Lip-gloss
Selling Price 22 26 24
Material Cost 5 10 10
Paraphrase This Document
Need a fresh take? Get an instant paraphrase of this document with our AI Paraphraser
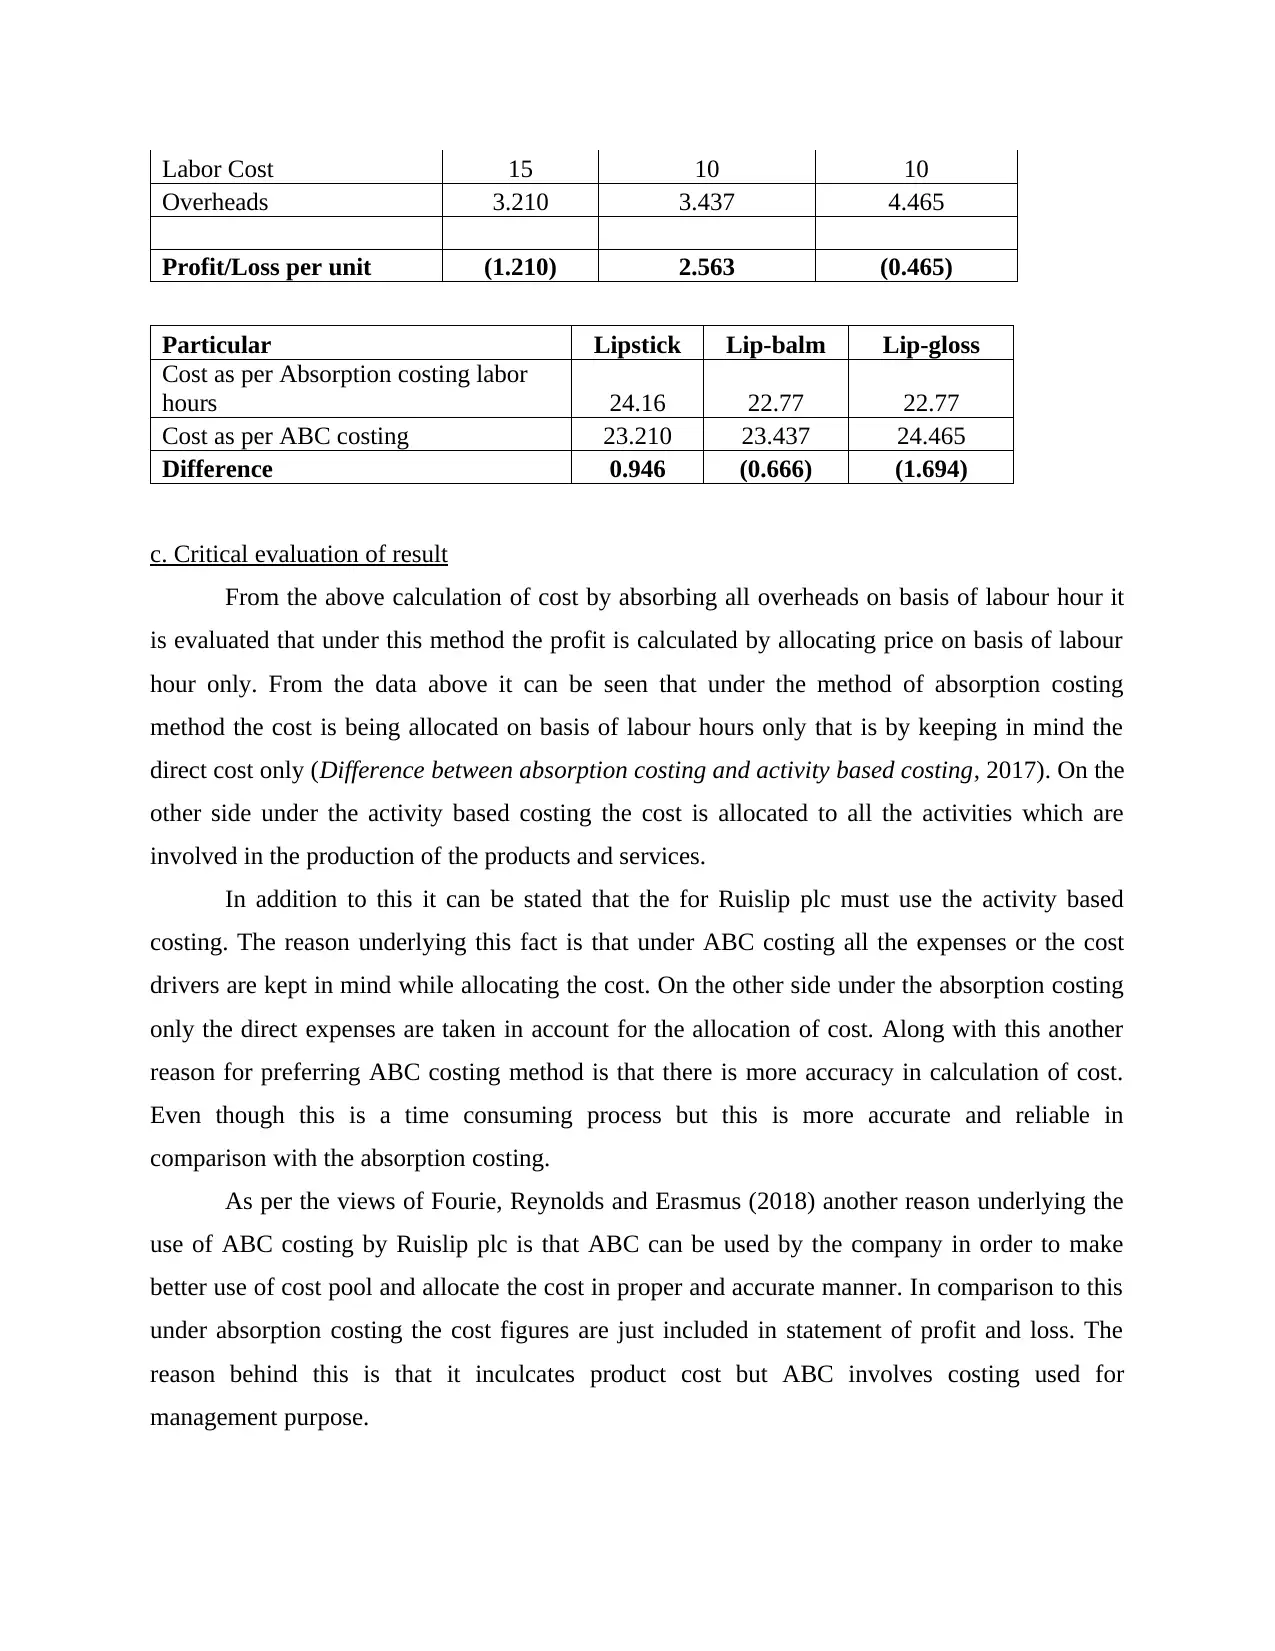
Labor Cost 15 10 10
Overheads 3.210 3.437 4.465
Profit/Loss per unit (1.210) 2.563 (0.465)
Particular Lipstick Lip-balm Lip-gloss
Cost as per Absorption costing labor
hours 24.16 22.77 22.77
Cost as per ABC costing 23.210 23.437 24.465
Difference 0.946 (0.666) (1.694)
c. Critical evaluation of result
From the above calculation of cost by absorbing all overheads on basis of labour hour it
is evaluated that under this method the profit is calculated by allocating price on basis of labour
hour only. From the data above it can be seen that under the method of absorption costing
method the cost is being allocated on basis of labour hours only that is by keeping in mind the
direct cost only (Difference between absorption costing and activity based costing, 2017). On the
other side under the activity based costing the cost is allocated to all the activities which are
involved in the production of the products and services.
In addition to this it can be stated that the for Ruislip plc must use the activity based
costing. The reason underlying this fact is that under ABC costing all the expenses or the cost
drivers are kept in mind while allocating the cost. On the other side under the absorption costing
only the direct expenses are taken in account for the allocation of cost. Along with this another
reason for preferring ABC costing method is that there is more accuracy in calculation of cost.
Even though this is a time consuming process but this is more accurate and reliable in
comparison with the absorption costing.
As per the views of Fourie, Reynolds and Erasmus (2018) another reason underlying the
use of ABC costing by Ruislip plc is that ABC can be used by the company in order to make
better use of cost pool and allocate the cost in proper and accurate manner. In comparison to this
under absorption costing the cost figures are just included in statement of profit and loss. The
reason behind this is that it inculcates product cost but ABC involves costing used for
management purpose.
d. Sensitivity analysis helping manager in coping with uncertainties.
Sensitivity analysis is defined as the financial model which assist in determining the way
in which target variable is being affected by the changes in other variable that is input variable.
This model is also defined as the ‘what if’ analysis under which the decision is being analysed in
some given situations (Herman and Usher, 2017). Hence, if a decision is being taken then there
are different variable which can affect the decision. Hence, the sensitive analysis assists the
manager in dealing with different uncertainties as this affects the decision undertaken. Hence, in
order to make sure that the decision taken is correct first the manager analyse all the factors or
uncertainties relating to the decision. Then the manager need to analyse each uncertainty
individually that if this uncertainty will occur then what impact will it create over decision.
Along with this the sensitivity analysis also assist manager in coping with uncertainties as
this will provide help in analysing all the internal and external uncertainties having impact over
decision. This is particularly because of the reason that when the company will be using
sensitivity analysis then they will include all the factors whether big or small which will affect
the working of the decision either in positive or in negative manner (VanderWeele and Ding,
2017). This will include the critical analysis of the decision and will outline all the possible
factors which will affect working and its critical analysis and will result in successful
implementation of the decision.
QUESTION 2
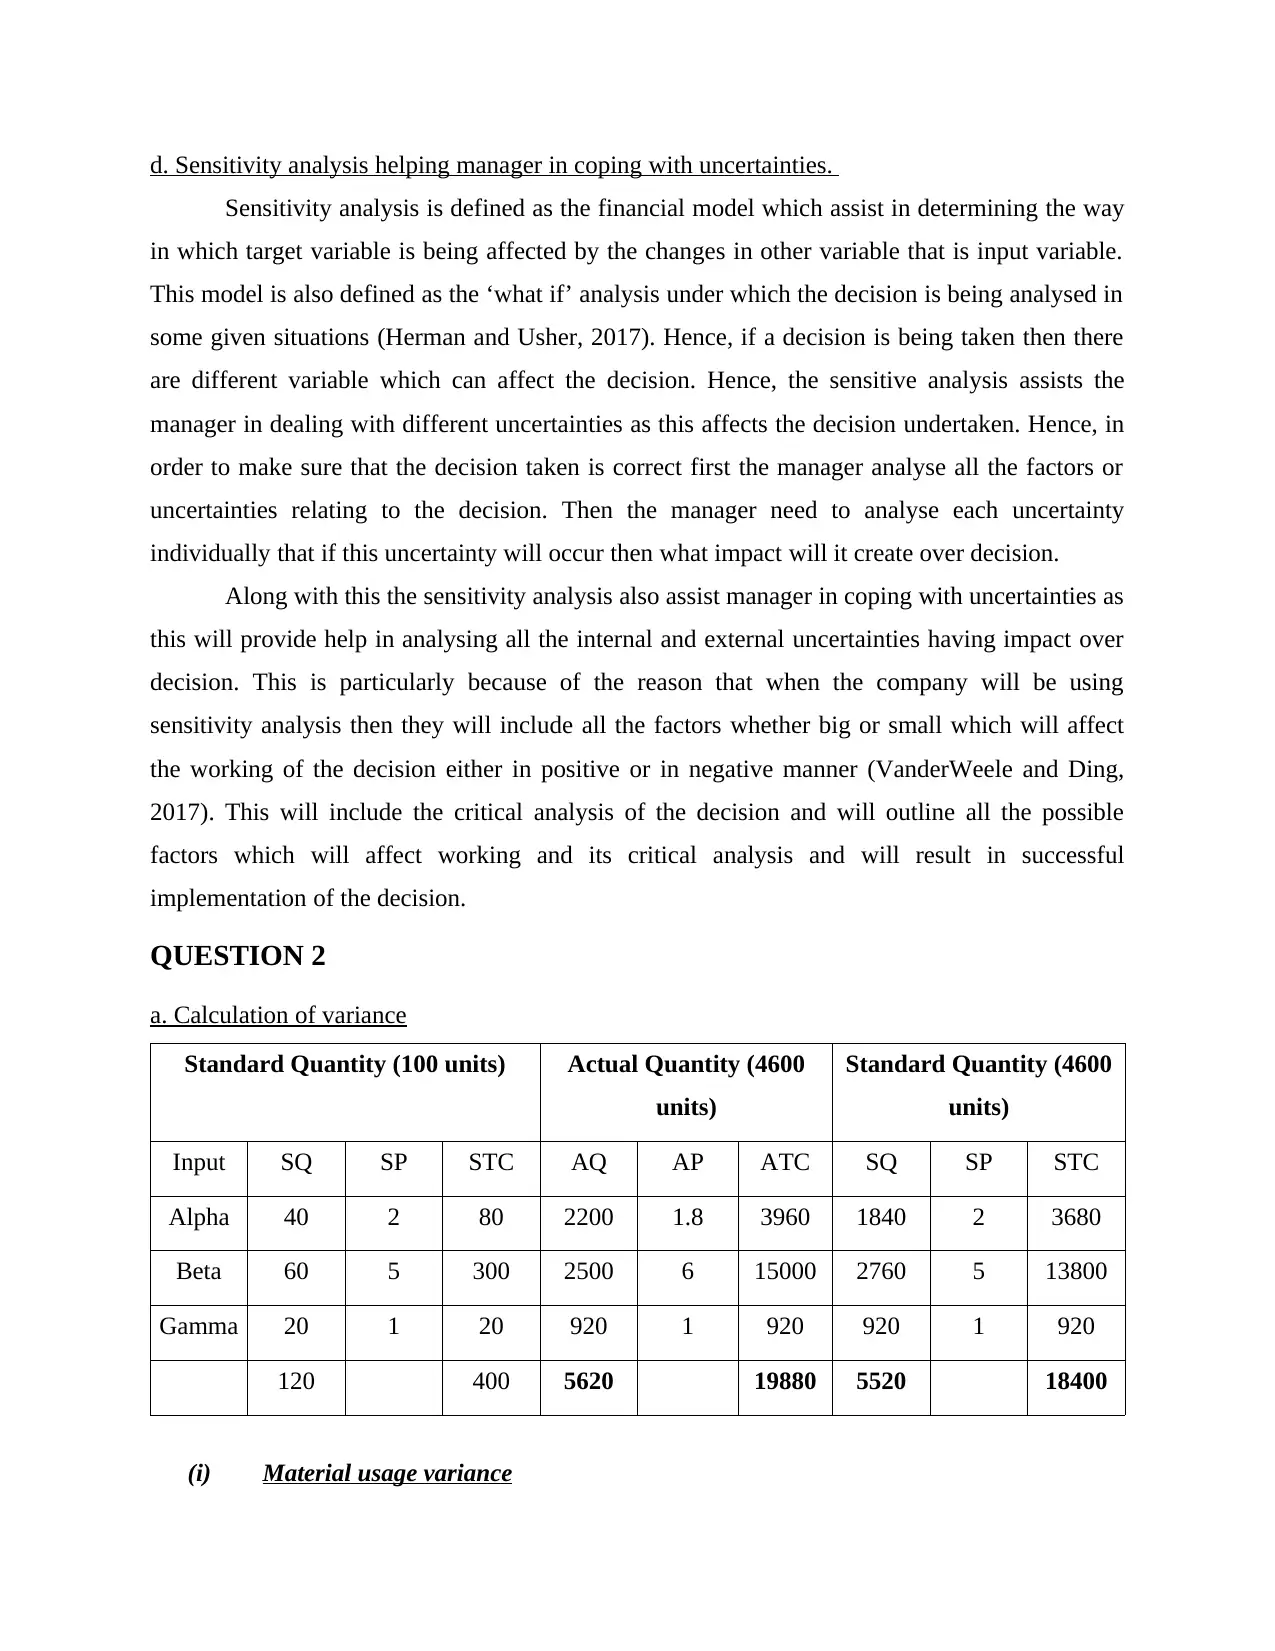
a. Calculation of variance
Standard Quantity (100 units) Actual Quantity (4600
units)
Standard Quantity (4600
units)
Input SQ SP STC AQ AP ATC SQ SP STC
Alpha 40 2 80 2200 1.8 3960 1840 2 3680
Beta 60 5 300 2500 6 15000 2760 5 13800
Gamma 20 1 20 920 1 920 920 1 920
120 400 5620 19880 5520 18400
(i) Material usage variance
Sensitivity analysis is defined as the financial model which assist in determining the way
in which target variable is being affected by the changes in other variable that is input variable.
This model is also defined as the ‘what if’ analysis under which the decision is being analysed in
some given situations (Herman and Usher, 2017). Hence, if a decision is being taken then there
are different variable which can affect the decision. Hence, the sensitive analysis assists the
manager in dealing with different uncertainties as this affects the decision undertaken. Hence, in
order to make sure that the decision taken is correct first the manager analyse all the factors or
uncertainties relating to the decision. Then the manager need to analyse each uncertainty
individually that if this uncertainty will occur then what impact will it create over decision.
Along with this the sensitivity analysis also assist manager in coping with uncertainties as
this will provide help in analysing all the internal and external uncertainties having impact over
decision. This is particularly because of the reason that when the company will be using
sensitivity analysis then they will include all the factors whether big or small which will affect
the working of the decision either in positive or in negative manner (VanderWeele and Ding,
2017). This will include the critical analysis of the decision and will outline all the possible
factors which will affect working and its critical analysis and will result in successful
implementation of the decision.
QUESTION 2
a. Calculation of variance
Standard Quantity (100 units) Actual Quantity (4600
units)
Standard Quantity (4600
units)
Input SQ SP STC AQ AP ATC SQ SP STC
Alpha 40 2 80 2200 1.8 3960 1840 2 3680
Beta 60 5 300 2500 6 15000 2760 5 13800
Gamma 20 1 20 920 1 920 920 1 920
120 400 5620 19880 5520 18400
(i) Material usage variance
⊘ This is a preview!⊘
Do you want full access?
Subscribe today to unlock all pages.
Trusted by 1+ million students worldwide
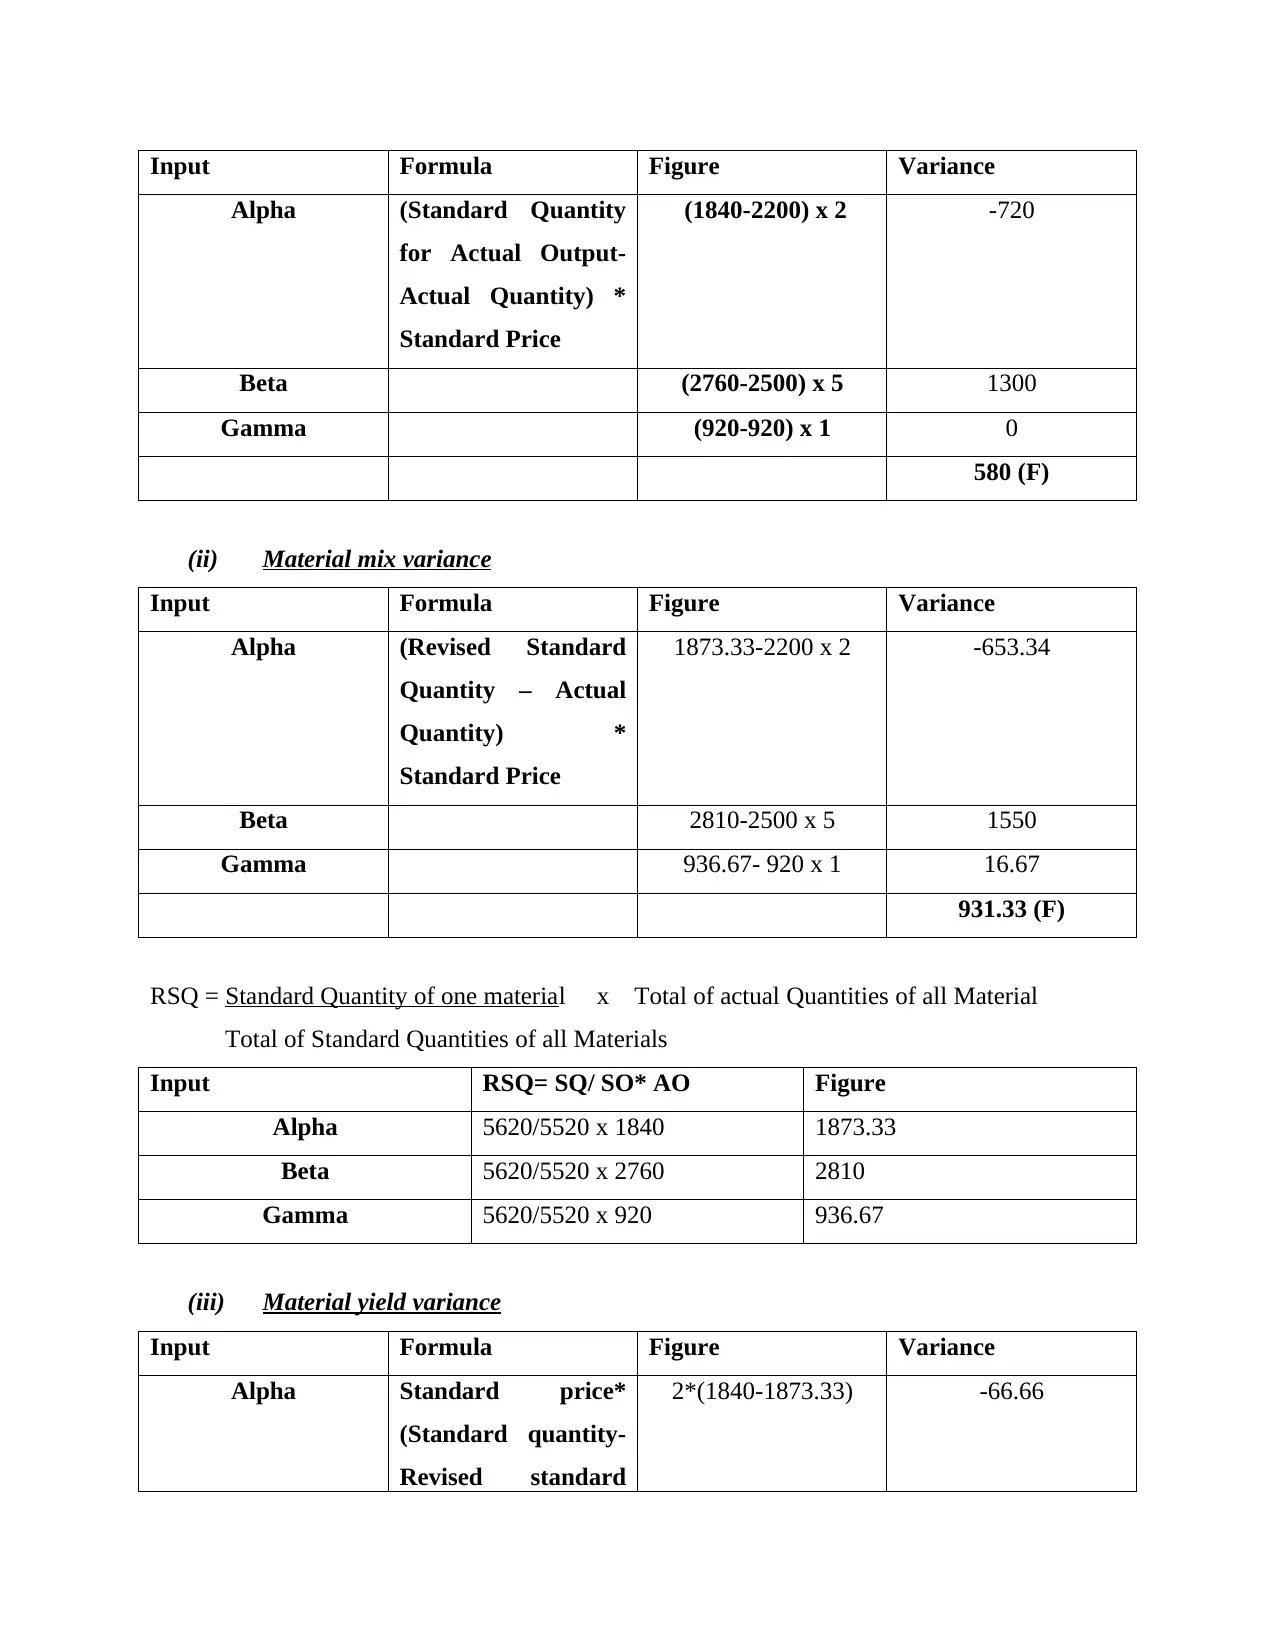
Input Formula Figure Variance
Alpha (Standard Quantity
for Actual Output-
Actual Quantity) *
Standard Price
(1840-2200) x 2 -720
Beta (2760-2500) x 5 1300
Gamma (920-920) x 1 0
580 (F)
(ii) Material mix variance
Input Formula Figure Variance
Alpha (Revised Standard
Quantity – Actual
Quantity) *
Standard Price
1873.33-2200 x 2 -653.34
Beta 2810-2500 x 5 1550
Gamma 936.67- 920 x 1 16.67
931.33 (F)
RSQ = Standard Quantity of one material x Total of actual Quantities of all Material
Total of Standard Quantities of all Materials
Input RSQ= SQ/ SO* AO Figure
Alpha 5620/5520 x 1840 1873.33
Beta 5620/5520 x 2760 2810
Gamma 5620/5520 x 920 936.67
(iii) Material yield variance
Input Formula Figure Variance
Alpha Standard price*
(Standard quantity-
Revised standard
2*(1840-1873.33) -66.66
Paraphrase This Document
Need a fresh take? Get an instant paraphrase of this document with our AI Paraphraser
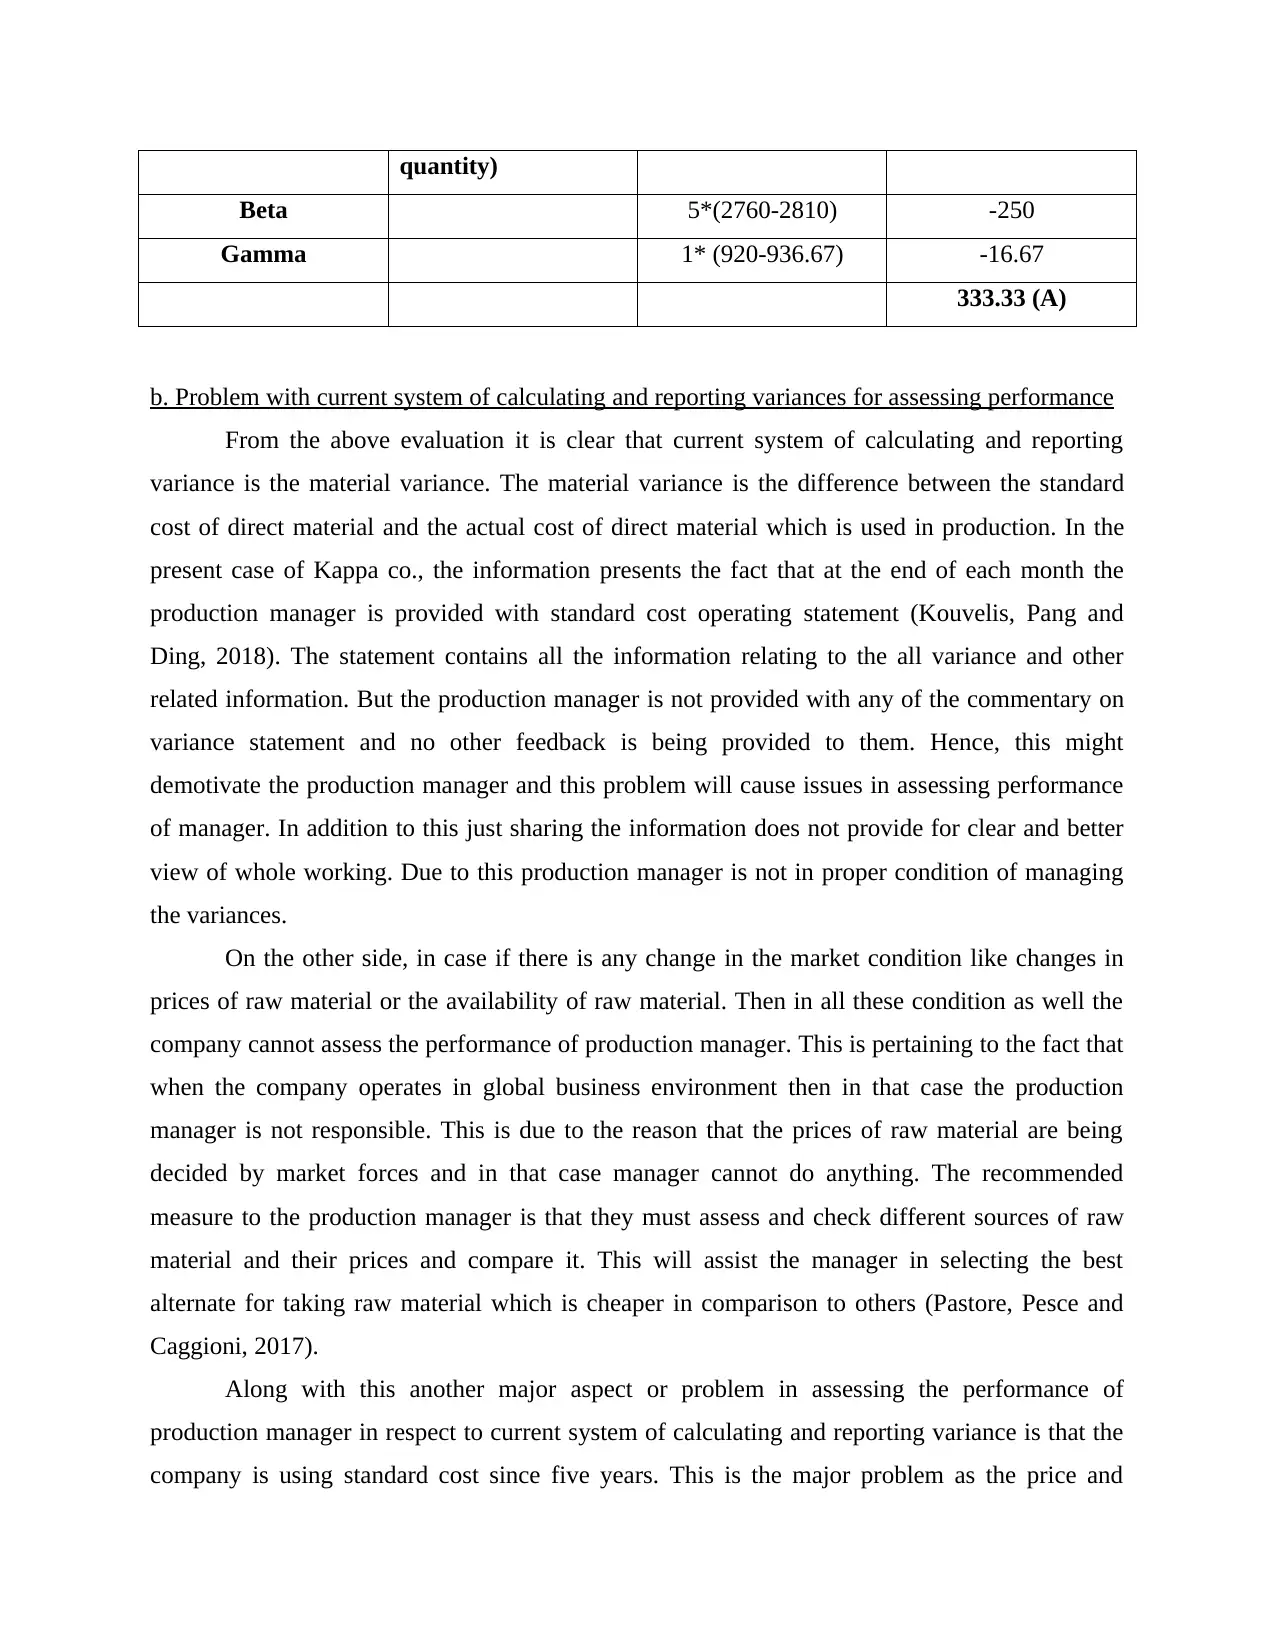
quantity)
Beta 5*(2760-2810) -250
Gamma 1* (920-936.67) -16.67
333.33 (A)
b. Problem with current system of calculating and reporting variances for assessing performance
From the above evaluation it is clear that current system of calculating and reporting
variance is the material variance. The material variance is the difference between the standard
cost of direct material and the actual cost of direct material which is used in production. In the
present case of Kappa co., the information presents the fact that at the end of each month the
production manager is provided with standard cost operating statement (Kouvelis, Pang and
Ding, 2018). The statement contains all the information relating to the all variance and other
related information. But the production manager is not provided with any of the commentary on
variance statement and no other feedback is being provided to them. Hence, this might
demotivate the production manager and this problem will cause issues in assessing performance
of manager. In addition to this just sharing the information does not provide for clear and better
view of whole working. Due to this production manager is not in proper condition of managing
the variances.
On the other side, in case if there is any change in the market condition like changes in
prices of raw material or the availability of raw material. Then in all these condition as well the
company cannot assess the performance of production manager. This is pertaining to the fact that
when the company operates in global business environment then in that case the production
manager is not responsible. This is due to the reason that the prices of raw material are being
decided by market forces and in that case manager cannot do anything. The recommended
measure to the production manager is that they must assess and check different sources of raw
material and their prices and compare it. This will assist the manager in selecting the best
alternate for taking raw material which is cheaper in comparison to others (Pastore, Pesce and
Caggioni, 2017).
Along with this another major aspect or problem in assessing the performance of
production manager in respect to current system of calculating and reporting variance is that the
company is using standard cost since five years. This is the major problem as the price and
quality of the material changes every year and if this will not be addressed it affects working of
production manager. Since last five years the prices would have changes but Kappa co. is using
the same standard cost since past five years and this affects the performance of the company and
manager as well. In this case the recommended strategy to production manager is that they must
ask purchasing manager to update the rates of standard output.
QUESTION 3
The zero based budgeting is a type of approach which is used to make the budget from a
scratch that is from starting. Under this technique no past data or records are being used in order
to make the budgets. On the other side the incremental budget is being prepared by using the
previous year budget and the actual performance as a basis and uses the incremental amount in
order to prepare the new budget for a new period. Both the ZBB and IB are different from one
another and this makes a lot of difference in making the budget for the company. This is
particularly because of the reason that both are much diverse budgeting technique. Hence, the
better solution for making the budget lies between both these options. The reason underlying this
fact is that there are many shortcomings in both the methods of budget and due to this relying on
a single method of budgeting will not be appropriate. In addition to this another difference is that
making of ZBB is very complex in comparison to IB. this is due to the reason that when the ZBB
is used then at that time no base is there and budget need to be prepared from starting.
As per the views of Ibrahim (2019) ZBB does not provide a perfect toll for planning and
control and coordination in the business operations as this process is too much time consuming.
This is pertaining to the fact that when the company does not make use of any past data and
because of this it takes a lot of time in making the budget.
On the other side Hughes (2020) argues that the reason for managing the budget on basis
of ZBB is that this requires a high manpower requirement. This is particularly because of the
reason that there is no base for the employees to make the new budget and due to this there will
be requirement of many people. This is particularly essential as if there will not be any base for
making the new budget then people have to start from a scratch and due to this more people will
be required.
In against of this Mou, Atkinson and Marshall (2019) states that in case of IB also not
provide a better base for making the budget as this method assumes that all the activities and cost
remains to work in the same manner as they have been in the earlier budget. This assumption
⊘ This is a preview!⊘
Do you want full access?
Subscribe today to unlock all pages.
Trusted by 1+ million students worldwide

does not provide a clear view to manage the work and make the budget in proper and effective
manner.
Along with this Pohribna and Yuvzhenko (2018) criticizes that the future cannot be
predicted and this is also a major reason for IB not providing a perfect toll for planning and
coordination and control. This is particularly because of the reason that under IB method the new
budget is being prepared on the basis of the past data and it might not be possible that the past
records are relevant in the future condition as well. Also it is also possible that when the
company is preparing budget on basis of IB at that time it is correct but it is not necessary that in
future also it is relevant.
Furthermore, Ariffianto and Adhariani (2018) articulated that another reason that IB does
not provide a better view as it might be possible that the resource allocation may change with
respect to the future changes. This in turn will not provide a better base for the budget to be made
as per the working of the budget of last year. Hence, this will have a great impact over the
working and making of the budget.
Paraphrase This Document
Need a fresh take? Get an instant paraphrase of this document with our AI Paraphraser
REFERENCES
Books and Journals
Ariffianto, M.I.F.T.A.H. and Adhariani, D., 2018. Budget surplus determinants in Indonesian
regional government budgets from a budgetary slack behaviour point of view. International
Journal of Economics and Management, 12(Specialissue1), pp.17-29.
Fourie, H., Reynolds, A. and Erasmus, L., 2018. A framework for time-driven activity-based
costing implementation at small and medium enterprises. The Southern African Journal of
Entrepreneurship and Small Business Management, 10(1), pp.1-11.
Herman, J. and Usher, W., 2017. SALib: an open-source Python library for sensitivity analysis.
Journal of Open Source Software, 2(9), p.97.
Hughes, P., 2020. Discover the power of zero-based budgeting. Farmer’s Weekly, 2020(20032),
pp.30-30.
Ibrahim, M.M., 2019. Designing zero-based budgeting for public organizations. Problems and
Perspectives in Management, 17(2).
Kouvelis, P., Pang, Z. and Ding, Q., 2018. Integrated commodity inventory management and
financial hedging: A dynamic mean‐variance analysis. Production and Operations
Management, 27(6), pp.1052-1073.
Mou, H., Atkinson, M.M. and Marshall, J., 2019. Budgeting for efficiency? A case study of the
public K-12 education systems of Canada. Applied Economics, 51(34), pp.3740-3757.
Pastore, R., Pesce, G. and Caggioni, M., 2017. Differential Variance Analysis: a direct method to
quantify and visualize dynamic heterogeneities. Scientific reports, 7(1), pp.1-9.
Pohribna, N. and Yuvzhenko, N., 2018. FEATURES OF APPLICATION OF BUDGETING
MODELS IN MODERN CONDITIONS. Innovative Solution in Modern Science, 7(26),
pp.5-16.
VanderWeele, T.J. and Ding, P., 2017. Sensitivity analysis in observational research: introducing
the E-value. Annals of internal medicine, 167(4), pp.268-274.
Online
Difference between absorption costing and activity based costing. 2017. [Online]. Available
through: < https://www.differencebetween.com/difference-between-absorption-costing-
and-vs-activity-based-costing/>
1 out of 11
Related Documents


Your All-in-One AI-Powered Toolkit for Academic Success.
+13062052269
info@desklib.com
Available 24*7 on WhatsApp / Email
![[object Object]](/_next/static/media/star-bottom.7253800d.svg)
Unlock your academic potential
Copyright © 2020–2026 A2Z Services. All Rights Reserved. Developed and managed by ZUCOL.