Financial Analysis of CapitaLand and JB Hi-Fi: Investment Decisions
VerifiedAdded on 2020/03/01
|18
|4036
|257
Report
AI Summary
This report provides a comprehensive financial analysis of CapitaLand Limited and JB Hi-Fi Limited, evaluating their performance and offering investment recommendations. The analysis includes an overview of each company's business description, strategic position, and financial performance over a three-year period. Key financial ratios such as net margin, return on equity, current ratio, quick ratio, debt-to-equity ratio, and asset turnover are analyzed to assess profitability, liquidity, solvency, and efficiency. The report also includes a technical analysis of stock performance, including price movements and beta. Based on the financial and technical analysis, the report recommends investment strategies for each company's stock. The report concludes that investors should buy the stock of CapitaLand Limited, based on the overall evaluation. The report highlights the importance of financial analysis for equity investors in making informed investment decisions, emphasizing the use of financial reports and ratio analysis to assess a company's financial health and market performance.

Analysis of Financial Performance and Investment Decision
1
1
Paraphrase This Document
Need a fresh take? Get an instant paraphrase of this document with our AI Paraphraser
Introduction
The equity investors need variety of information to make investment decisions which are
provided through different financial reports. Primarily, it is required to analyze the financial performance
of the company which is done through ratio analysis. The ratio analysis report provides insight into the
profitability, l1iquidity, and solvency of the business (Schmidlin, 2014). Further, the ratio analysis also
provides a suitable basis for comparison with the industry peers. Apart from analyzing the financial
performance, it is also important to analyze the stock’s performance on the market index. For this purpose
security analysis report is produced. In this context, a report has been prepared presenting the financial
analysis of two companies namely CapitaLand Limited and JB Hi-Fi Limited. Further, the report also
provides recommendations to the investor in regards to investment in the stocks of these two companies.
Company-1: CapitaLand Limited
Description of Business and Analysis of Strategic Position
CapitaLand Limited having registered office in Singapore was founded in the year 1989. The
company is listed on the Singapore Stock Exchange. It is one of the biggest Asian companies engaged in
the business of managing real estate properties. The company develops and maintains real estate
properties in Singapore, China and other Asian countries. The product portfolio of the company includes
shopping malls, offices, complexes, and residential units. Further, the company also engages in the
investment activities through investment trusts and funds. The company was known as Pidemco Land
Limited Prior to the year 2000 when it changed its name (Capitaland, 2016).
The company gets an edge over its competitors due to quality management and availability of
resources in sufficient quantity. Further, the company is looking to expand the business which indicates a
great opportunity for the investors to earn money. The company is working on the mission of building
people and building communities. However, there is intense competition on the construction industry but
the company looks quite capable of beating the competitors with its strong strategies (Capitaland, 2016).
2
Analysis of Financial Performance
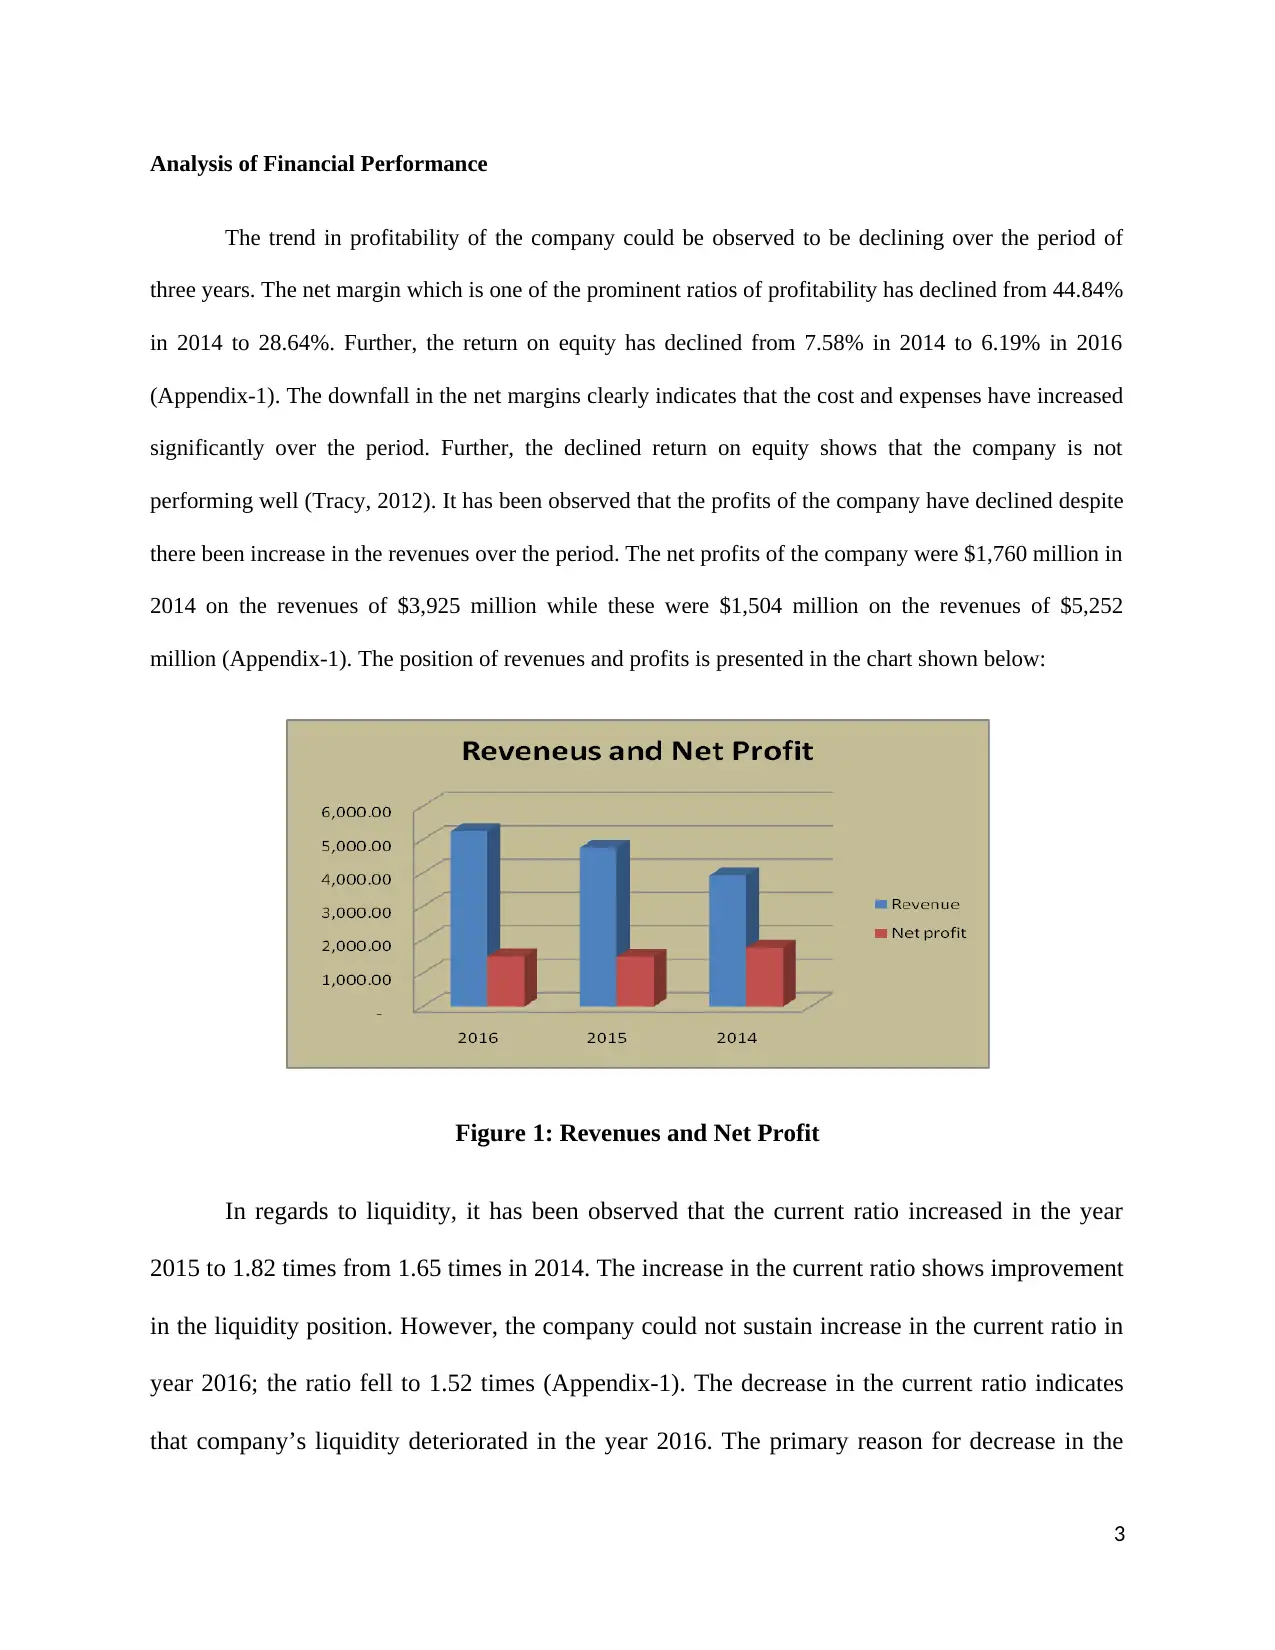
The trend in profitability of the company could be observed to be declining over the period of
three years. The net margin which is one of the prominent ratios of profitability has declined from 44.84%
in 2014 to 28.64%. Further, the return on equity has declined from 7.58% in 2014 to 6.19% in 2016
(Appendix-1). The downfall in the net margins clearly indicates that the cost and expenses have increased
significantly over the period. Further, the declined return on equity shows that the company is not
performing well (Tracy, 2012). It has been observed that the profits of the company have declined despite
there been increase in the revenues over the period. The net profits of the company were $1,760 million in
2014 on the revenues of $3,925 million while these were $1,504 million on the revenues of $5,252
million (Appendix-1). The position of revenues and profits is presented in the chart shown below:
Figure 1: Revenues and Net Profit
In regards to liquidity, it has been observed that the current ratio increased in the year
2015 to 1.82 times from 1.65 times in 2014. The increase in the current ratio shows improvement
in the liquidity position. However, the company could not sustain increase in the current ratio in
year 2016; the ratio fell to 1.52 times (Appendix-1). The decrease in the current ratio indicates
that company’s liquidity deteriorated in the year 2016. The primary reason for decrease in the
3
⊘ This is a preview!⊘
Do you want full access?
Subscribe today to unlock all pages.
Trusted by 1+ million students worldwide
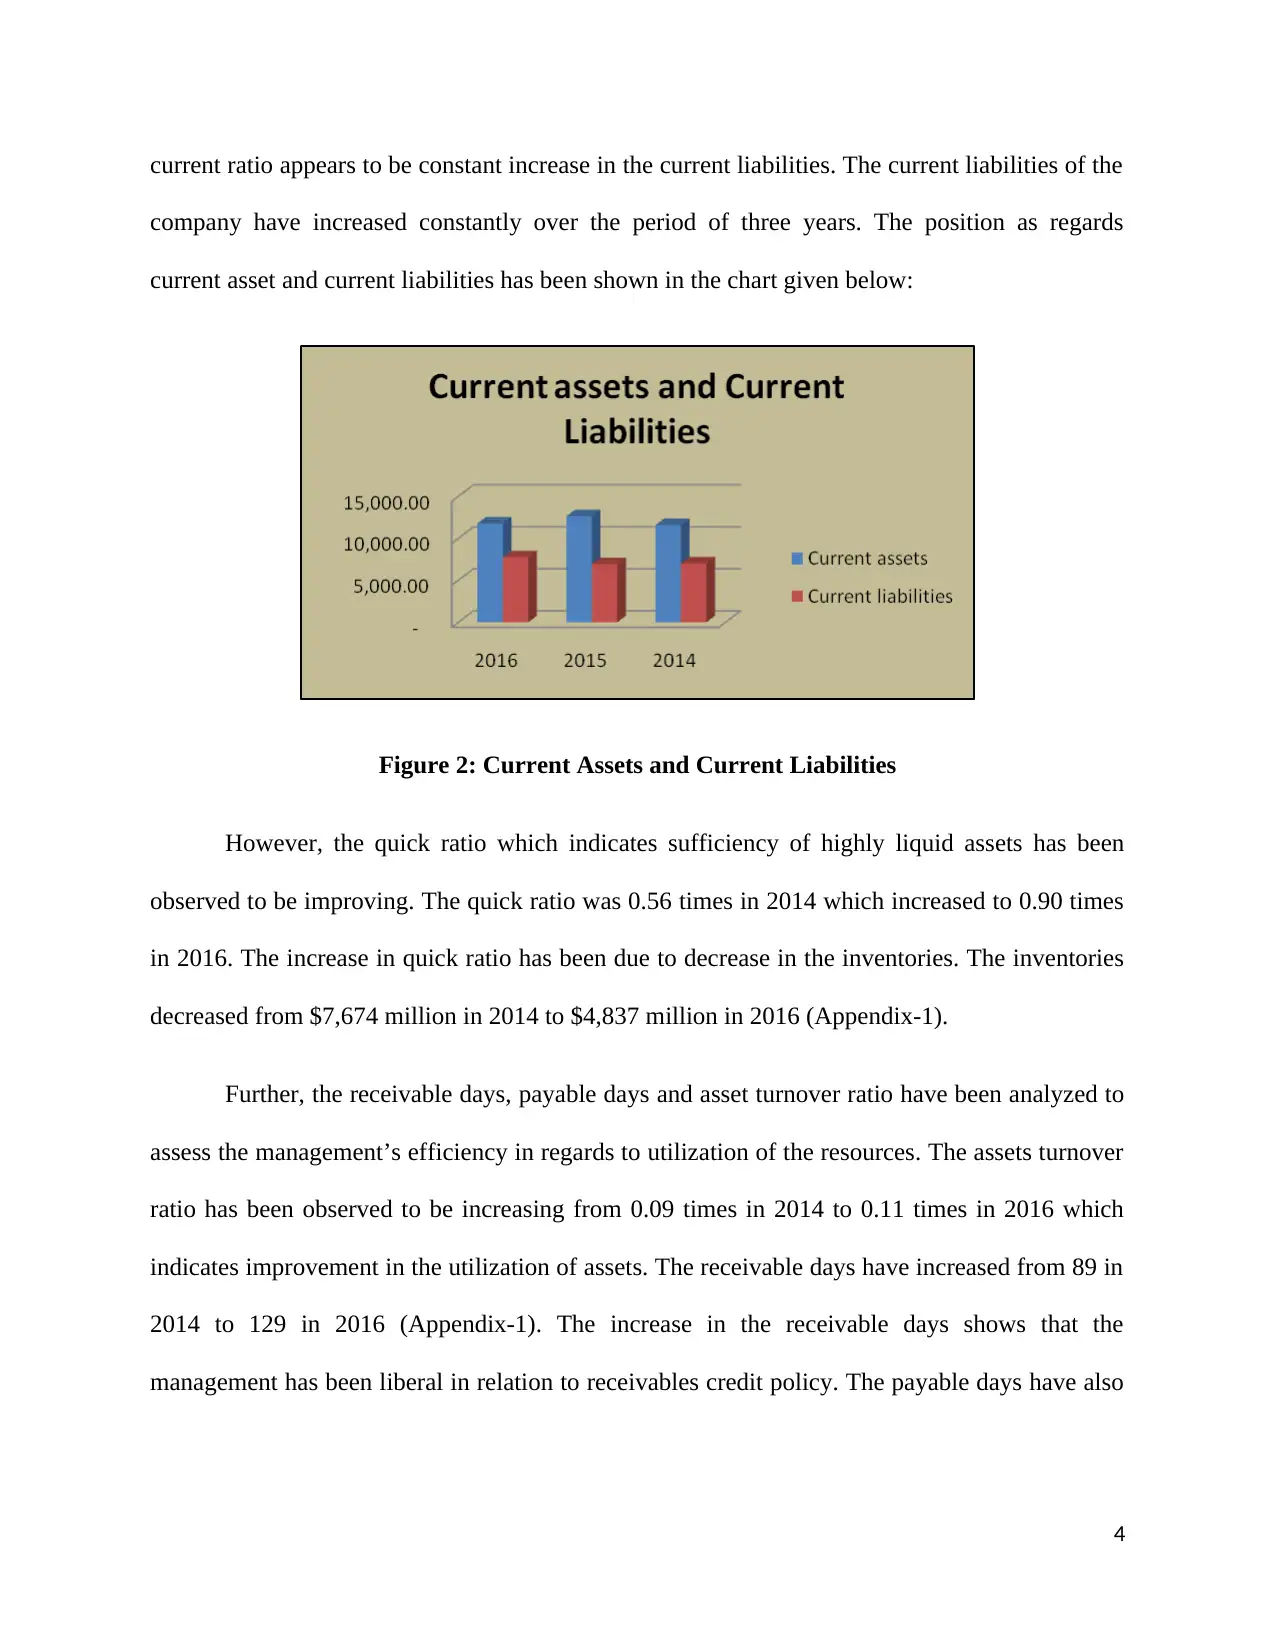
current ratio appears to be constant increase in the current liabilities. The current liabilities of the
company have increased constantly over the period of three years. The position as regards
current asset and current liabilities has been shown in the chart given below:
Figure 2: Current Assets and Current Liabilities
However, the quick ratio which indicates sufficiency of highly liquid assets has been
observed to be improving. The quick ratio was 0.56 times in 2014 which increased to 0.90 times
in 2016. The increase in quick ratio has been due to decrease in the inventories. The inventories
decreased from $7,674 million in 2014 to $4,837 million in 2016 (Appendix-1).
Further, the receivable days, payable days and asset turnover ratio have been analyzed to
assess the management’s efficiency in regards to utilization of the resources. The assets turnover
ratio has been observed to be increasing from 0.09 times in 2014 to 0.11 times in 2016 which
indicates improvement in the utilization of assets. The receivable days have increased from 89 in
2014 to 129 in 2016 (Appendix-1). The increase in the receivable days shows that the
management has been liberal in relation to receivables credit policy. The payable days have also
4
Paraphrase This Document
Need a fresh take? Get an instant paraphrase of this document with our AI Paraphraser
increased from 440 in 2014 to 468 in 2016 indicating that the company is receiving more credit
period from the suppliers.
Solvency is another important aspect of the financial analysis. The analysis of solvency is
important to assess the company’s ability to meet its long term commitments (Tracy, 2012). Two
prominent ratios such as debt equity and debt to assets have been analyzed to assess the solvency
of the company. The debt to equity ratio has been found to be similar in all the three years with
slight downward movement. In the year 2014, the debt to equity ratio was 0.90 times then it
slightly decreased to 0.89 times in 2015 and further to 0.88 times in 2016 (Appendix-1). The
decrease in the debt to equity ratio shows improvement in the solvency position of the company.
Further, the debt to total assets ratio 0.47 times in 2014 and it remained at the same level in 2015
and 2016. Thus, it could be articulated that the solvency position of the company has been intact
over the period.
Analysis of Stock Performance
The technical analysis of the stock covers the aspects such as evaluation of movement in the
stock prices, return on stock, standard deviation of return, beta, and dividend yield etc. The analysis of
movement in prices gives a fair idea about the volatility in the stock’s returns (Lorenzo, 2013). It could be
observed from the chart shown below that the price of CapitaLand Limited has been less volatile over the
period. The price of stock rose on 16th August and then it fell down on 17th and 18th August. The declining
trend continued till 21st August when the price of stock was $3.73. However, the stock again stimulated
and price started rising upside.
5
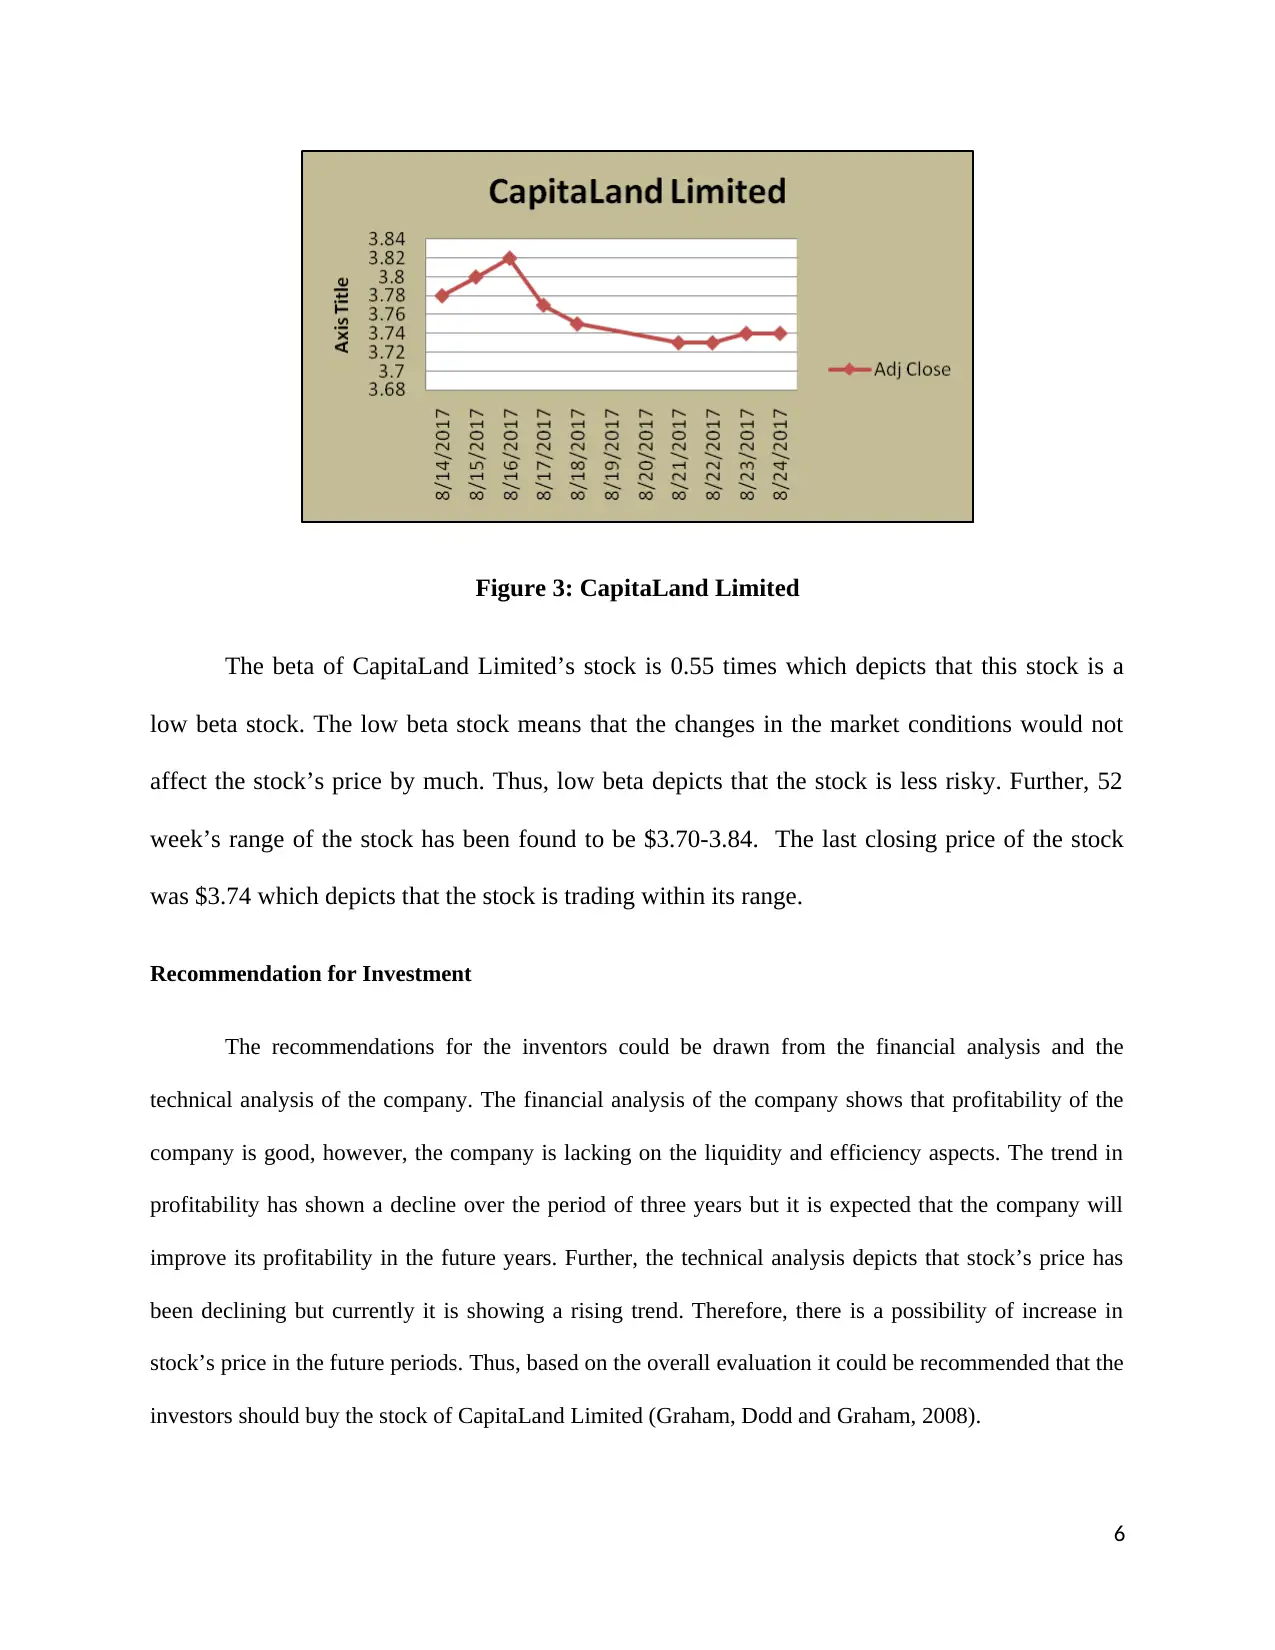
Figure 3: CapitaLand Limited
The beta of CapitaLand Limited’s stock is 0.55 times which depicts that this stock is a
low beta stock. The low beta stock means that the changes in the market conditions would not
affect the stock’s price by much. Thus, low beta depicts that the stock is less risky. Further, 52
week’s range of the stock has been found to be $3.70-3.84. The last closing price of the stock
was $3.74 which depicts that the stock is trading within its range.
Recommendation for Investment
The recommendations for the inventors could be drawn from the financial analysis and the
technical analysis of the company. The financial analysis of the company shows that profitability of the
company is good, however, the company is lacking on the liquidity and efficiency aspects. The trend in
profitability has shown a decline over the period of three years but it is expected that the company will
improve its profitability in the future years. Further, the technical analysis depicts that stock’s price has
been declining but currently it is showing a rising trend. Therefore, there is a possibility of increase in
stock’s price in the future periods. Thus, based on the overall evaluation it could be recommended that the
investors should buy the stock of CapitaLand Limited (Graham, Dodd and Graham, 2008).
6
⊘ This is a preview!⊘
Do you want full access?
Subscribe today to unlock all pages.
Trusted by 1+ million students worldwide
Company-2: JB Hi-Fi Limited
Description of Business and Analysis of Strategic Position
JB Hi-Fi Limited having headquarters in Chadstone is listed on the Australian Stock Exchange.
The company belongs to specialty retail industry having product portfolio of consumer goods. The major
products being sold by the company include televisions, computer, camera, CDs, DVDs, Games, cooking
product, kitchen appliances, and musical instruments. Further, apart from selling the consumer products,
the company also engages in providing telecommunication and consulting services. The company mainly
operates in the markets of Australia and New Zealand (JB Hi-Fi, 2016).
JB Hi-Fi is a well established old company which gives it an edge over the competitors. The
company is equipped with all the necessary resources which make it capable to stand like a rock in the
adverse market conditions. The retail industry is facing acute competition all around the world and the
firms are not even able to save their existing revenues but JB hi-Fi is experiencing growth in revenues.
The company is incurring huge amount of expenses on enhancing its sales network and advertising and
sales promotion (JB Hi-Fi, 2016).
Analysis of Financial Performance
Analysis of financial performance of JB Hi-Fi Limited has been conducted with the help of ratio
analysis covering profitability, liquidity, efficiency, and solvency. The profitability of the company has
been analyzed with the help of ratio such as net margin and return on equity (Tracy, 2012). The net
margin of the company has been found to be 3.67%, 3.75%, and 3.84% for the financial years 2014, 2015,
and 2016 respectively (Appendix-2). It could be observed that the net margin is showing increasing trend
over the period of three years. The improvement in the net margin depicts that the company has been able
to save cost of goods sold and operating expenses. Further, there has been observed decrease in the
finance cost over the period. The finance cost decreased from $9 million to $6 million in 2015 and then
further decreased to $4 million in 2016. The decrease in finance cost appears to be the primary reason for
7
Paraphrase This Document
Need a fresh take? Get an instant paraphrase of this document with our AI Paraphraser
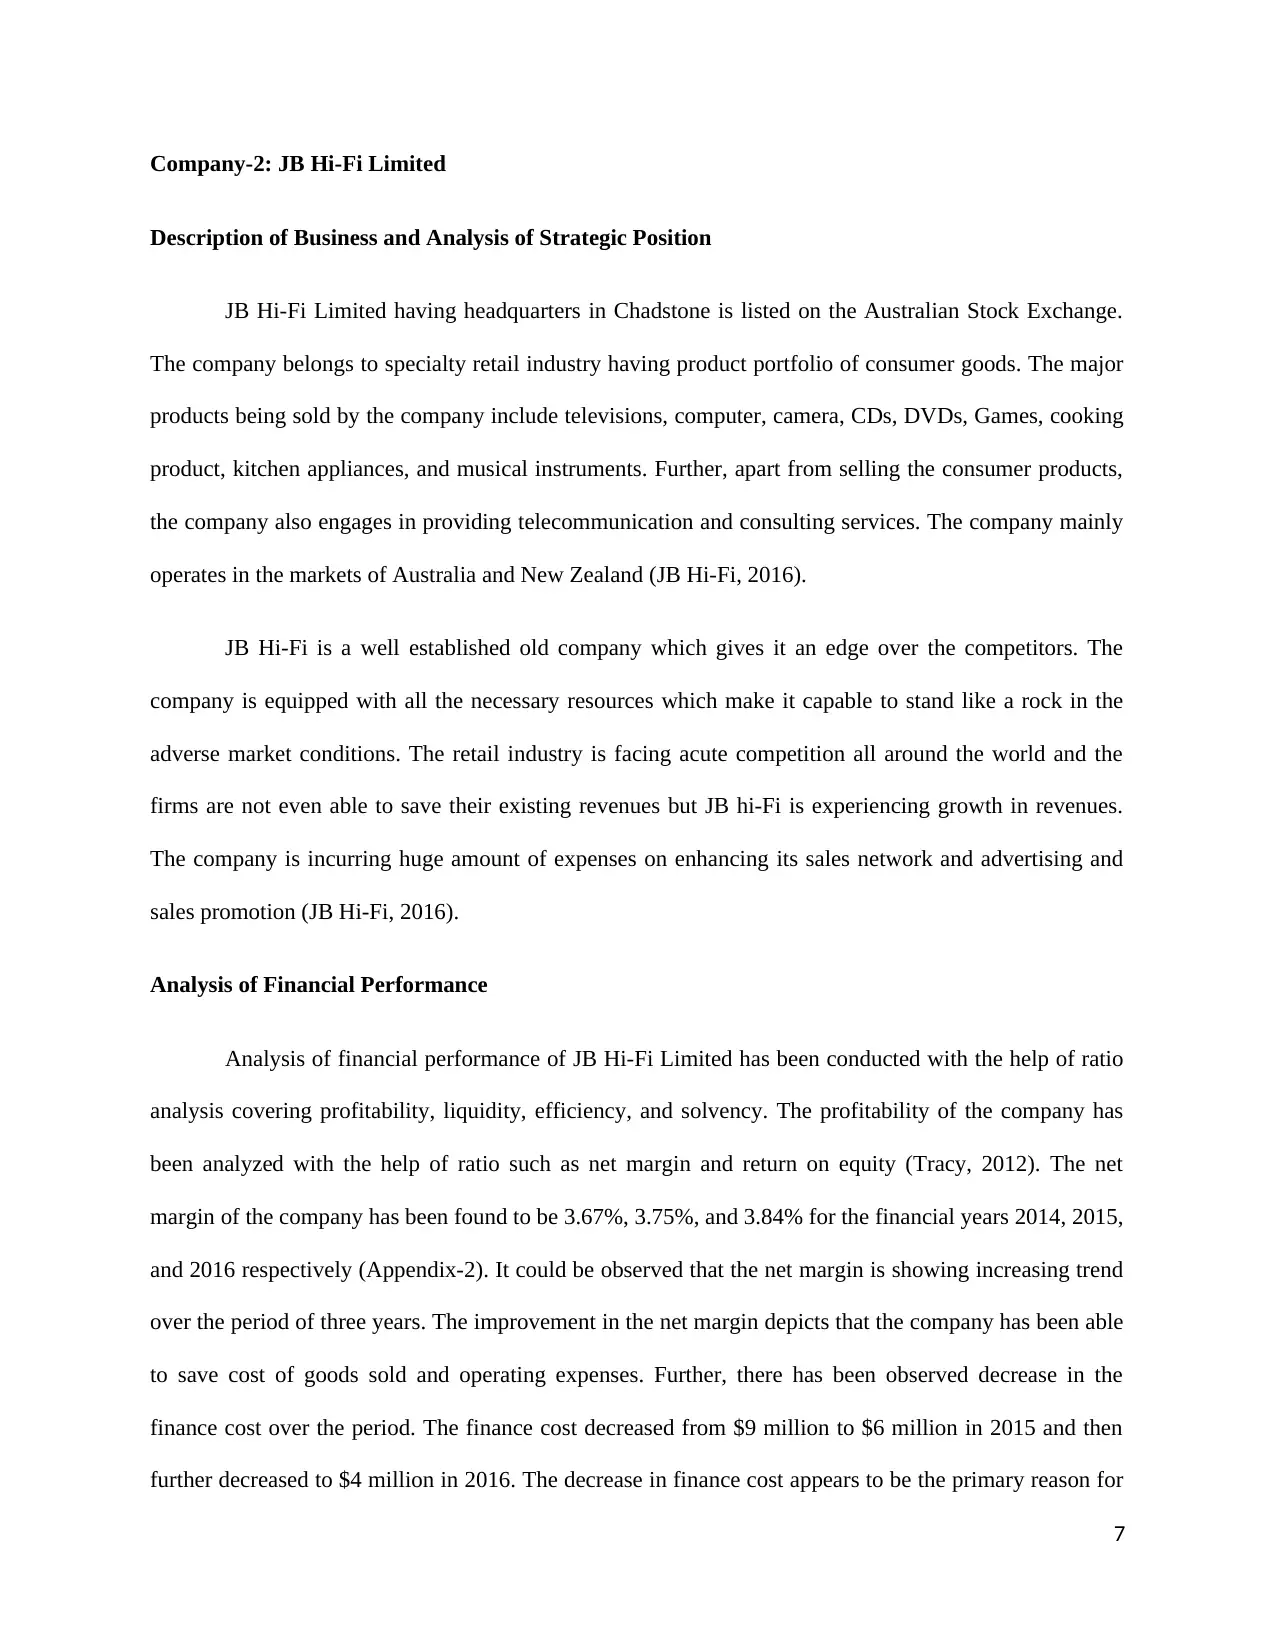
improvement in the net margin in 2015 and 2016. Further, the sales revenues of the company increased
from $3,484 million in 2014 to $3,652 million in 2015 and then further increased to $3,954 million in
2016 (Appendix-2). The trend in revenues and profits of JB Hi-Fi Limited has been shown in the chart
given below:
Figure 4: Revenues and Profits
Although the net margin is showing increasing trend but it is quite low being just around 3-4%.
However, the return on equity of the company appears to be good at 37.62% in the year 2016 but the
trend in return on equity is showing decline over the period of three years. In the year 2014, the return on
equity was 43.54% which declined to 37.62% in 2016. There has been observed a huge increase in the
shareholders equity which seems to be the main reason for decrease in the return on equity. The
shareholder’s equity has increased from $294 million in 2014 to $404 million in the year 2016
(Appendix-2).
The liquidity of the company has gone down over the period of time as depicted from the
decrease in the current ratio (Tracy, 2012). The current ratio decreased from 1.64 times in 2014 to 1.57
times in the year 2016. The decrease in the current ratio shows lack of sufficient liquid assets in
possession of the company to meet out its short term obligations. Further, the quick ratio was observed to
be slightly increasing from 0.34 times in 2014 to 0.35 times in 2016, which shows that the inventory
8
levels have increased. Further, as regards efficiency, the asset turnover ratio has decreased from 4.05
times in 2014 to 3.99 times in 2016 (Appendix-2). The decrease in the asset turnover ratio indicates that
the management has not been able to utilize the assets efficiently in generating revenues. Further, the
receivable days have also increased showing the inefficiency of the management. The receivable days
were 7 in the year 2014 which increased to 9 in the year 2016.
However, the payable days have also increased from 32 in 2014 to 35 in 2016 which might offset
the adverse impact of increase in the receivable days. As regards solvency, it has been observed that the
company is having a debt to equity ratio of 1.46 times which shows low risk of solvency. The debt to
equity ratio of 2:1 is considered ideal; therefore, the ratio of 1:46:1 could be inferred to be showing low
risk of solvency. Analysis of ratio over the period shows a declining trend which depicts improving
solvency position of the company. The debt to equity ratio decreased from 1.92 times in 2014 to 1.46
times in 2016 (Appendix-2). Further, debt to total asset ratio is analyzed to assess the leverage position of
the company. The ratio of debt to total assets has been observed to be falling down from 0.66 times in
2014 to 0.59 times in 2016. A high debt to total assets ratio indicates high leverage which is advantageous
for the company as it increases the profitability. However, the increase in debt beyond the tolerable level
exposes the company to the risk of solvency (Tracy, 2012).
Analysis of Stock Performance
For an investor exploring options to invest money in the equity market, analysis of financial
performance of the company is essential but even more essential is the technical analysis of the stock
(Chen, 2010). The analysis of stock prices of JB Hi-Fi Limited has been presented in the chart given
below:
9
⊘ This is a preview!⊘
Do you want full access?
Subscribe today to unlock all pages.
Trusted by 1+ million students worldwide
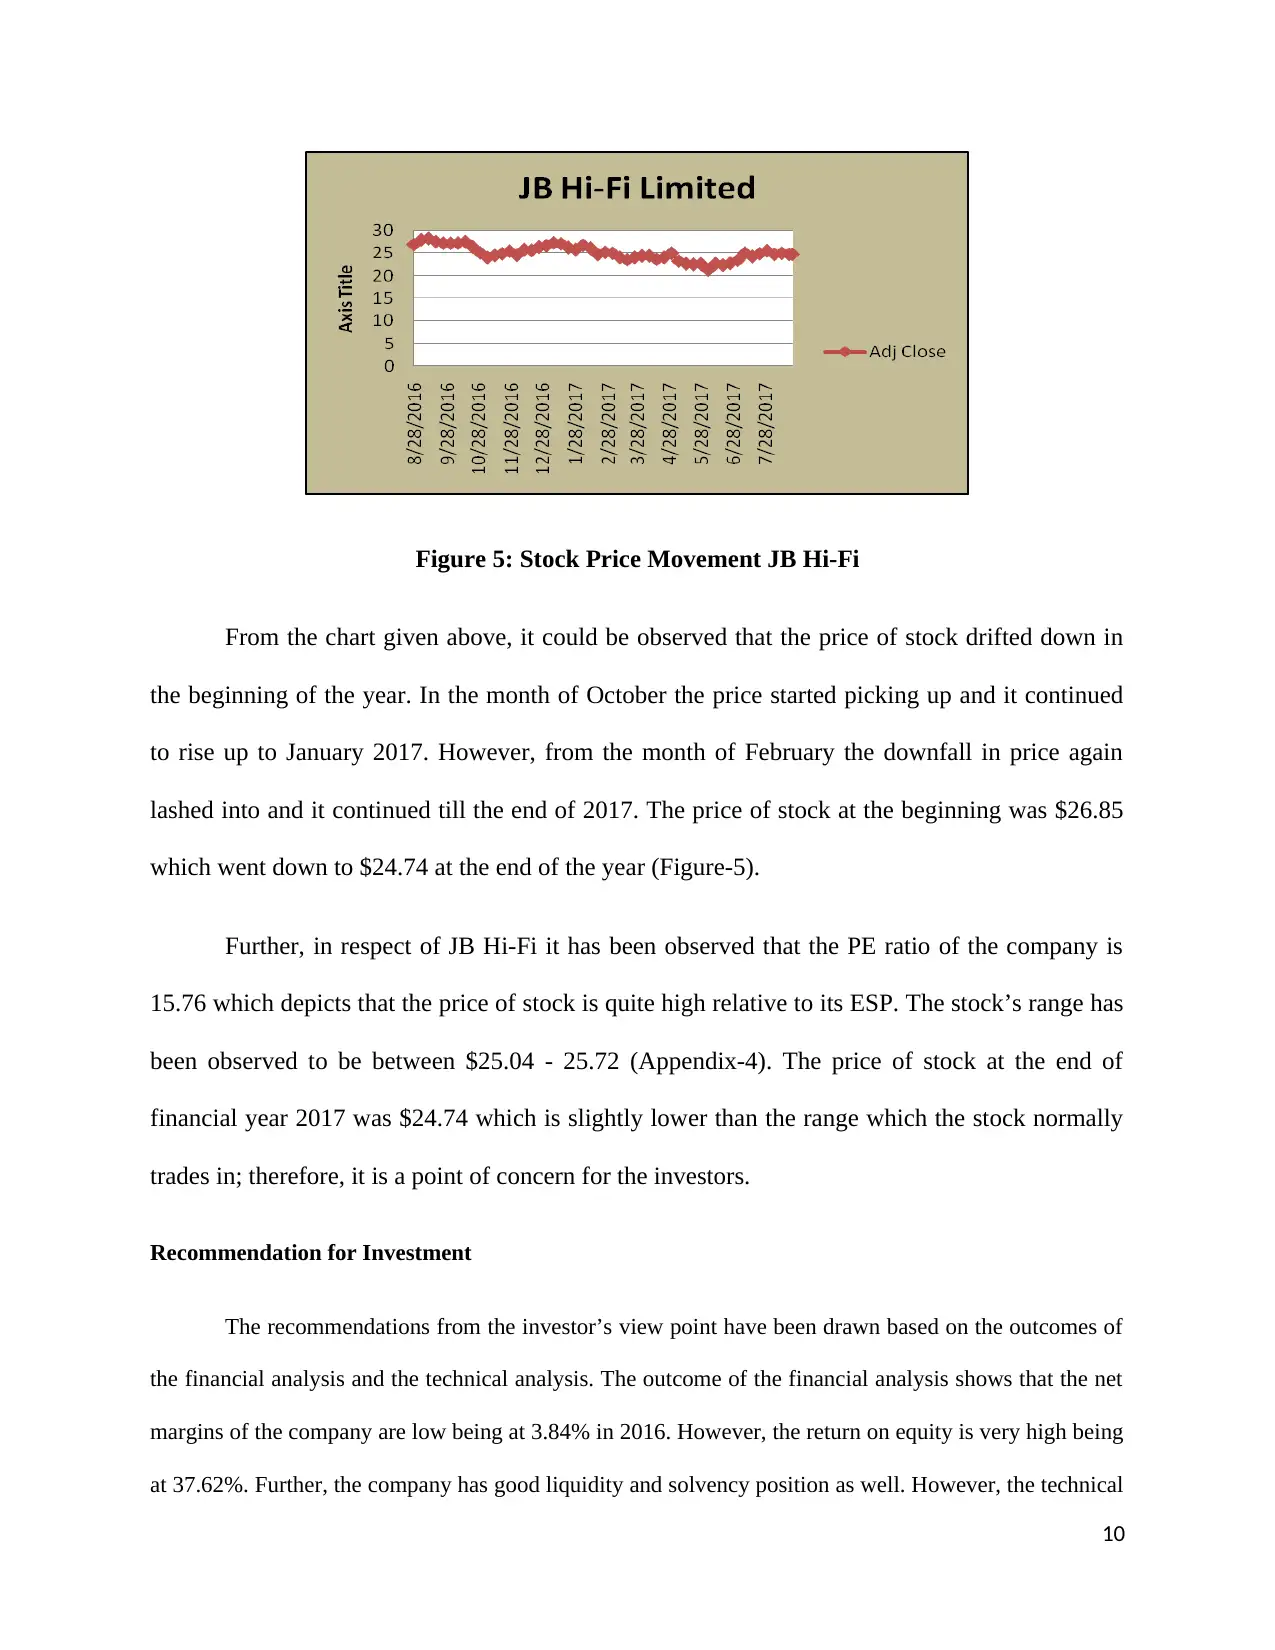
Figure 5: Stock Price Movement JB Hi-Fi
From the chart given above, it could be observed that the price of stock drifted down in
the beginning of the year. In the month of October the price started picking up and it continued
to rise up to January 2017. However, from the month of February the downfall in price again
lashed into and it continued till the end of 2017. The price of stock at the beginning was $26.85
which went down to $24.74 at the end of the year (Figure-5).
Further, in respect of JB Hi-Fi it has been observed that the PE ratio of the company is
15.76 which depicts that the price of stock is quite high relative to its ESP. The stock’s range has
been observed to be between $25.04 - 25.72 (Appendix-4). The price of stock at the end of
financial year 2017 was $24.74 which is slightly lower than the range which the stock normally
trades in; therefore, it is a point of concern for the investors.
Recommendation for Investment
The recommendations from the investor’s view point have been drawn based on the outcomes of
the financial analysis and the technical analysis. The outcome of the financial analysis shows that the net
margins of the company are low being at 3.84% in 2016. However, the return on equity is very high being
at 37.62%. Further, the company has good liquidity and solvency position as well. However, the technical
10
Paraphrase This Document
Need a fresh take? Get an instant paraphrase of this document with our AI Paraphraser
analysis shows that the stock’s price has gone down. Further, the company has high PE ratio of 15.76
times which indicates that the stock might be overvalued. Thus, considering the aspect of overvaluation of
the stock, it is recommended to the investors that they should not buy the stock. The investors are advised
to wait and watch if the rising trend starts to make investment (Graham, Dodd and Graham, 2008).
Large Forecast Error Related to Equity Investment
The forecasting error means the differences between the estimate and the actual results. It is quite
general that the errors in the forecast would arise but the magnitude of that error on the decision would
depend upon the size of gap between the estimate and the actual result. The larger the size of difference
severe would be the impact on the decision (Beaver et al., 2004). An extensive research is carried out to
make investment in equities, thus, there always remains a risk of forecasting error in equity investment
analysis. The forecasting error in equity investment depends upon the nature, quality, and the quantity of
the data. The analysts make forecast in relation to earnings of the company which have bearing on the
stock’s prices. If the analyst make positive forecast about the company’s growth, the price of the stock is
expected to increase, on the other hand, if the forecast is not positive, the price of the stock is expected to
go down (Beaver et al., 2004).
Elementary Discussion on Ethical Behavior of Professional Fund Managers
Ethics plays an important role in the development of a profession. The fund managers are
responsible to invest the money of investors in the manner that yields the highest possible return for them
(Ransome and Sampford, 2016). The fund managers owe a fiduciary duty to the investors to use the
money entrusted to them in a responsible manner. The lack of ethics in the fund managers would make
the investors lose their money. In order to safeguard the interest of investors, the ethical guidelines and
code of conducts have been framed by the body of professionals. For instance, the institute of CFA
provides ethical guidelines to its member. These ethical guidelines are to be followed by the members of
11
CFA institute while discharging their professional duties. The breach of ethical guidelines on the part of
member of CFA institute would entail high penalties and prosecution (Ransome and Sampford, 2016).
Conclusion
The investment in equities is subject to rigorous analysis of the financial performance and the
technical aspects of the stock. This report presents the financial and technical analysis of CapitaLand
Limited which is in the construction industry and JB Hi-Fi Limited engaging in the retail sales industry.
The financial analysis in respect of both the companies has been carried out by applying the ratio analysis
tool. Further, the technical analysis has been conducted with the help of charts and data tables. The
CapitaLand Limited’s financial performance has deteriorated over the period but the company still earns
good profit margin. Further, the utilization of assets to generate sales has also improved. JB Hi-Fi is
facing stiff competition and due to increased competition its profits margins have also shrinked.
12
⊘ This is a preview!⊘
Do you want full access?
Subscribe today to unlock all pages.
Trusted by 1+ million students worldwide
1 out of 18
Related Documents


Your All-in-One AI-Powered Toolkit for Academic Success.
+13062052269
info@desklib.com
Available 24*7 on WhatsApp / Email
![[object Object]](/_next/static/media/star-bottom.7253800d.svg)
Unlock your academic potential
Copyright © 2020–2026 A2Z Services. All Rights Reserved. Developed and managed by ZUCOL.