Comparative Financial Analysis of Food Industry Companies Report

Verified

Added on  2023/01/03

|17
|3880
|57
Report
AI Summary
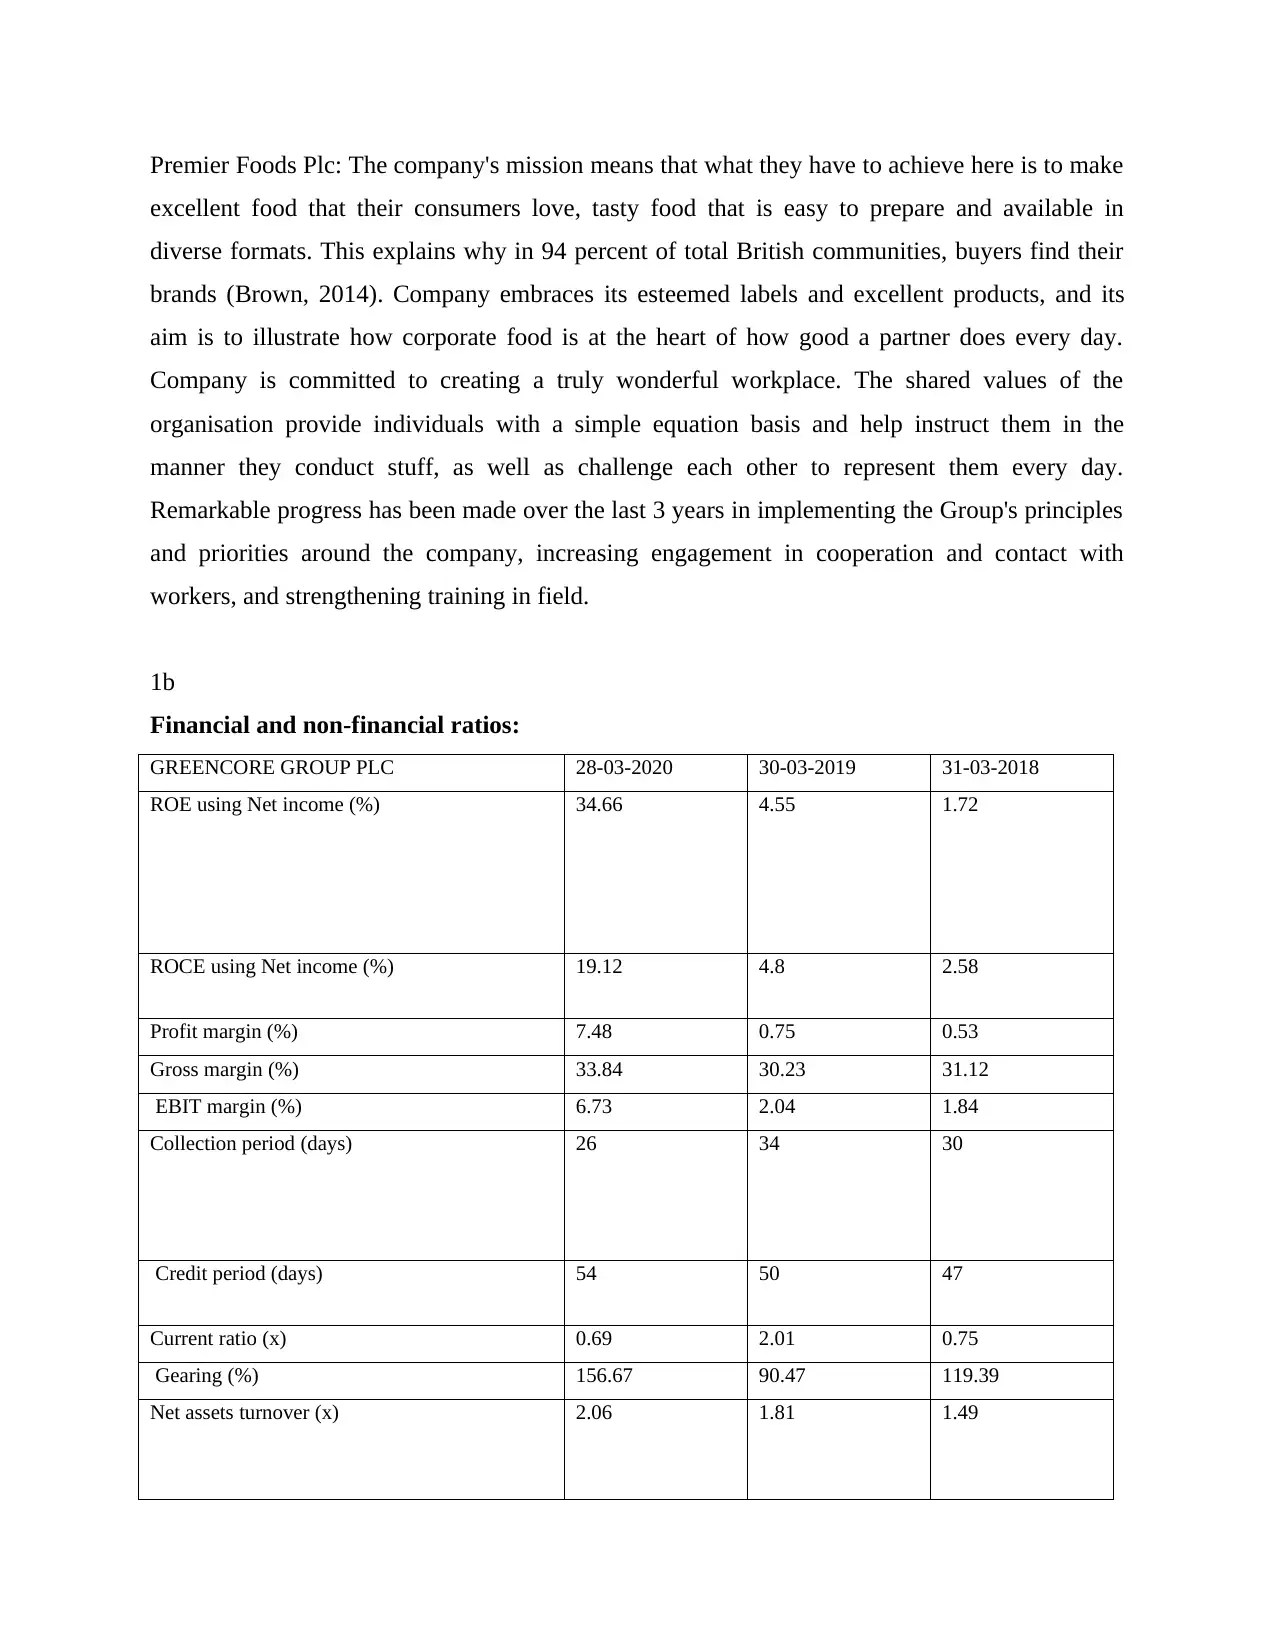
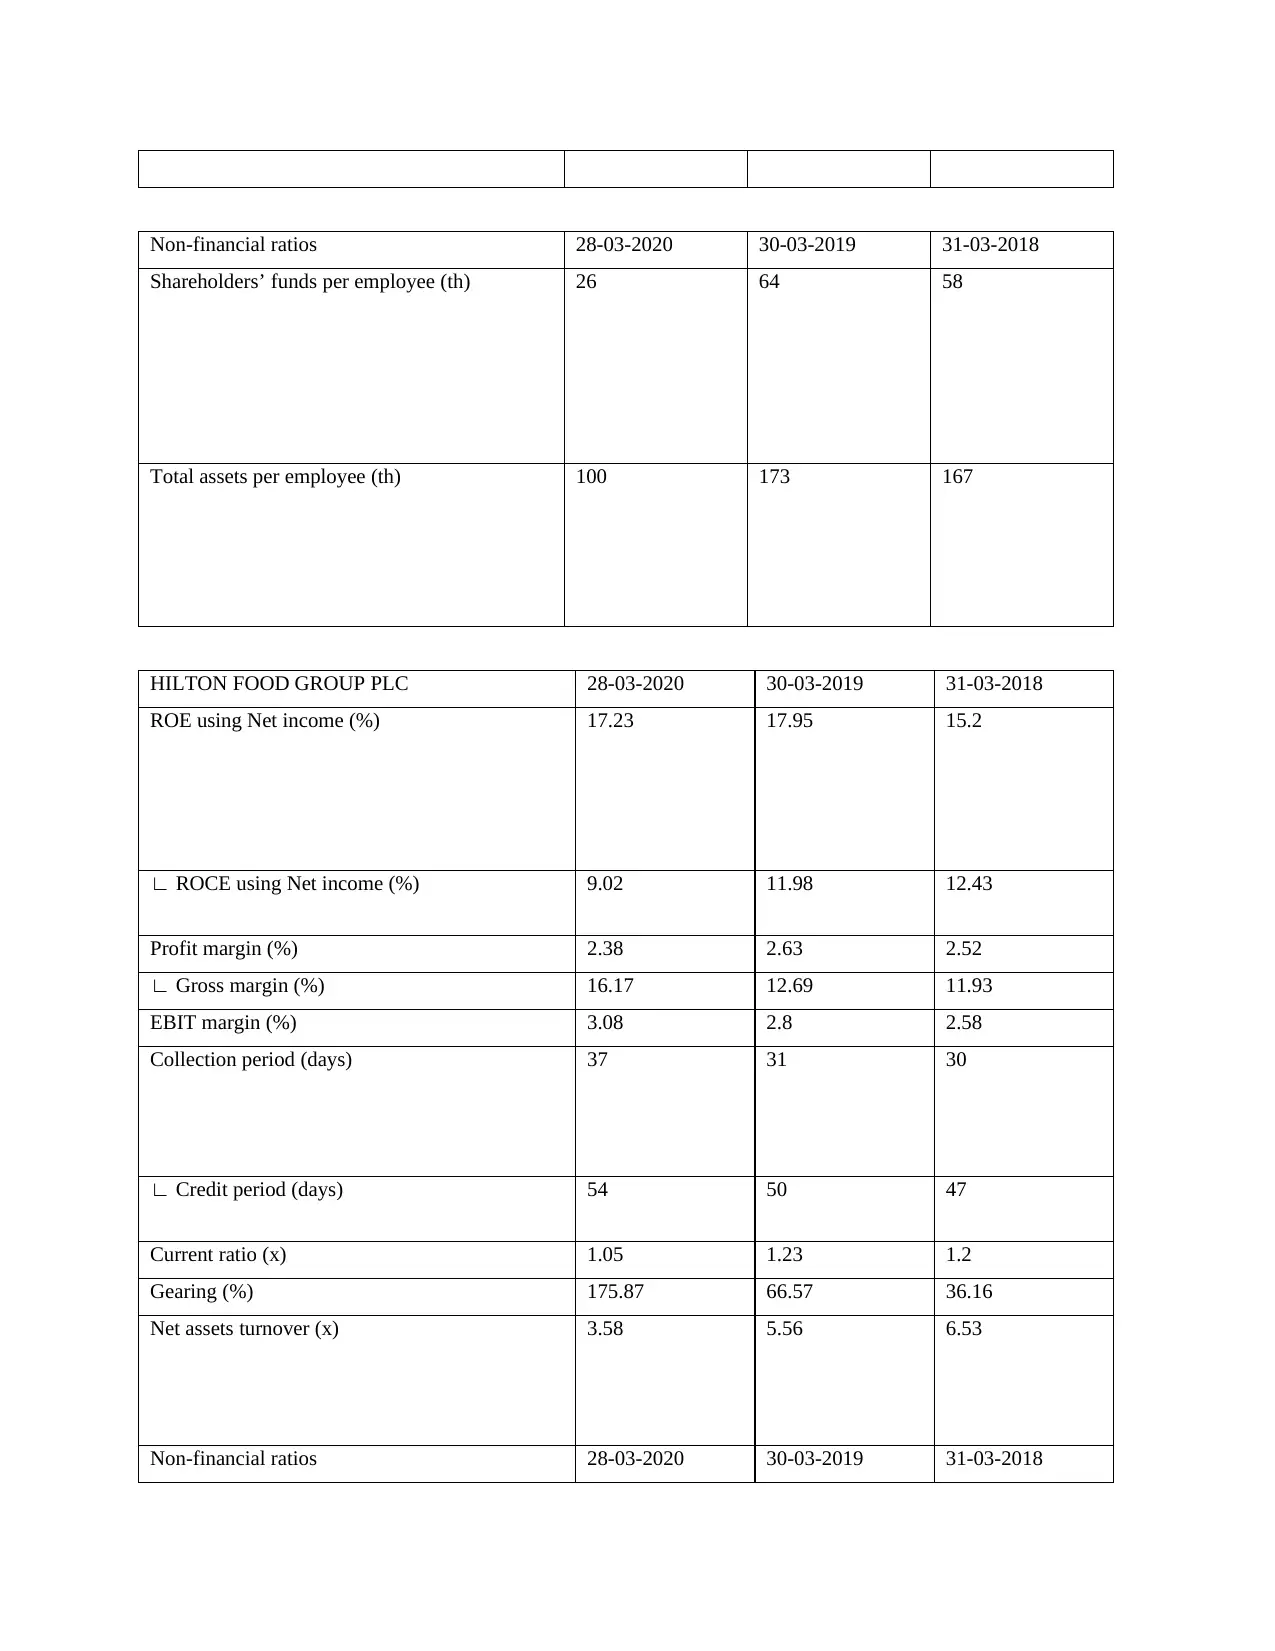
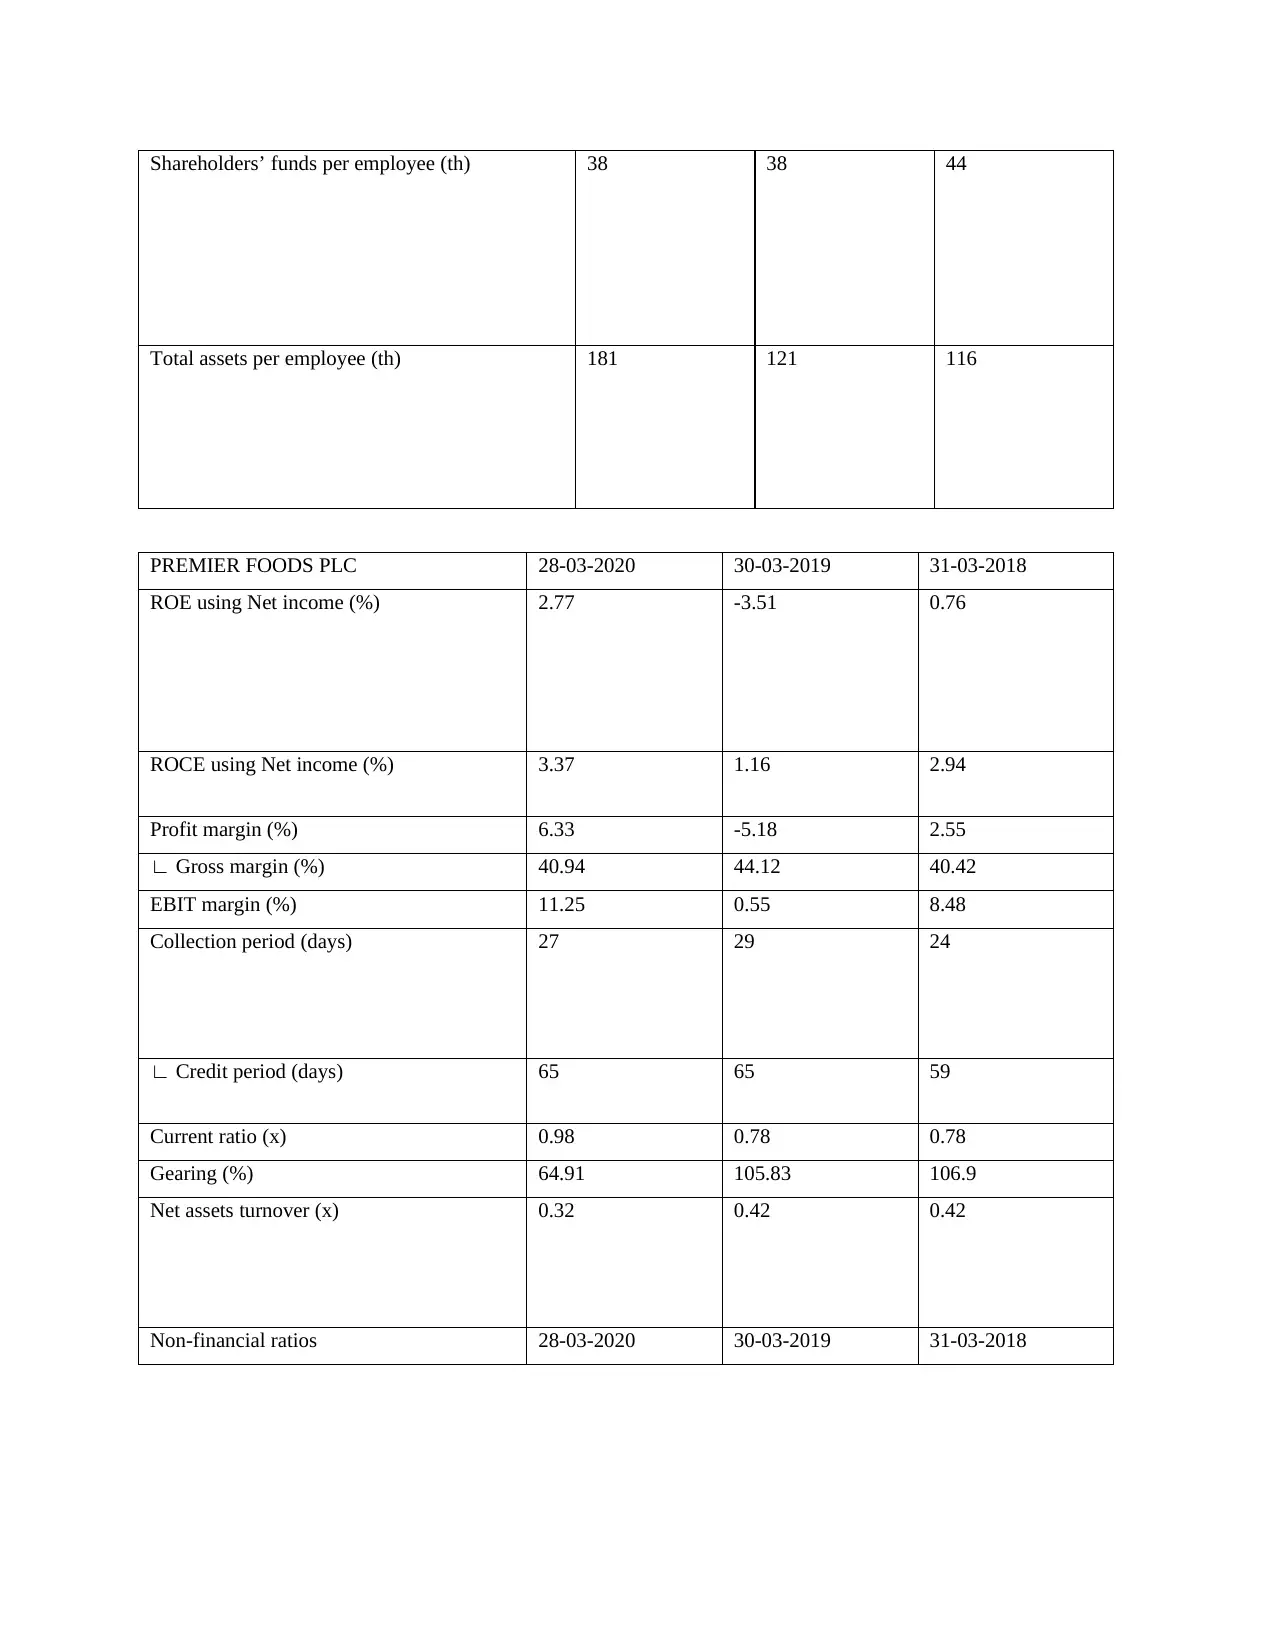
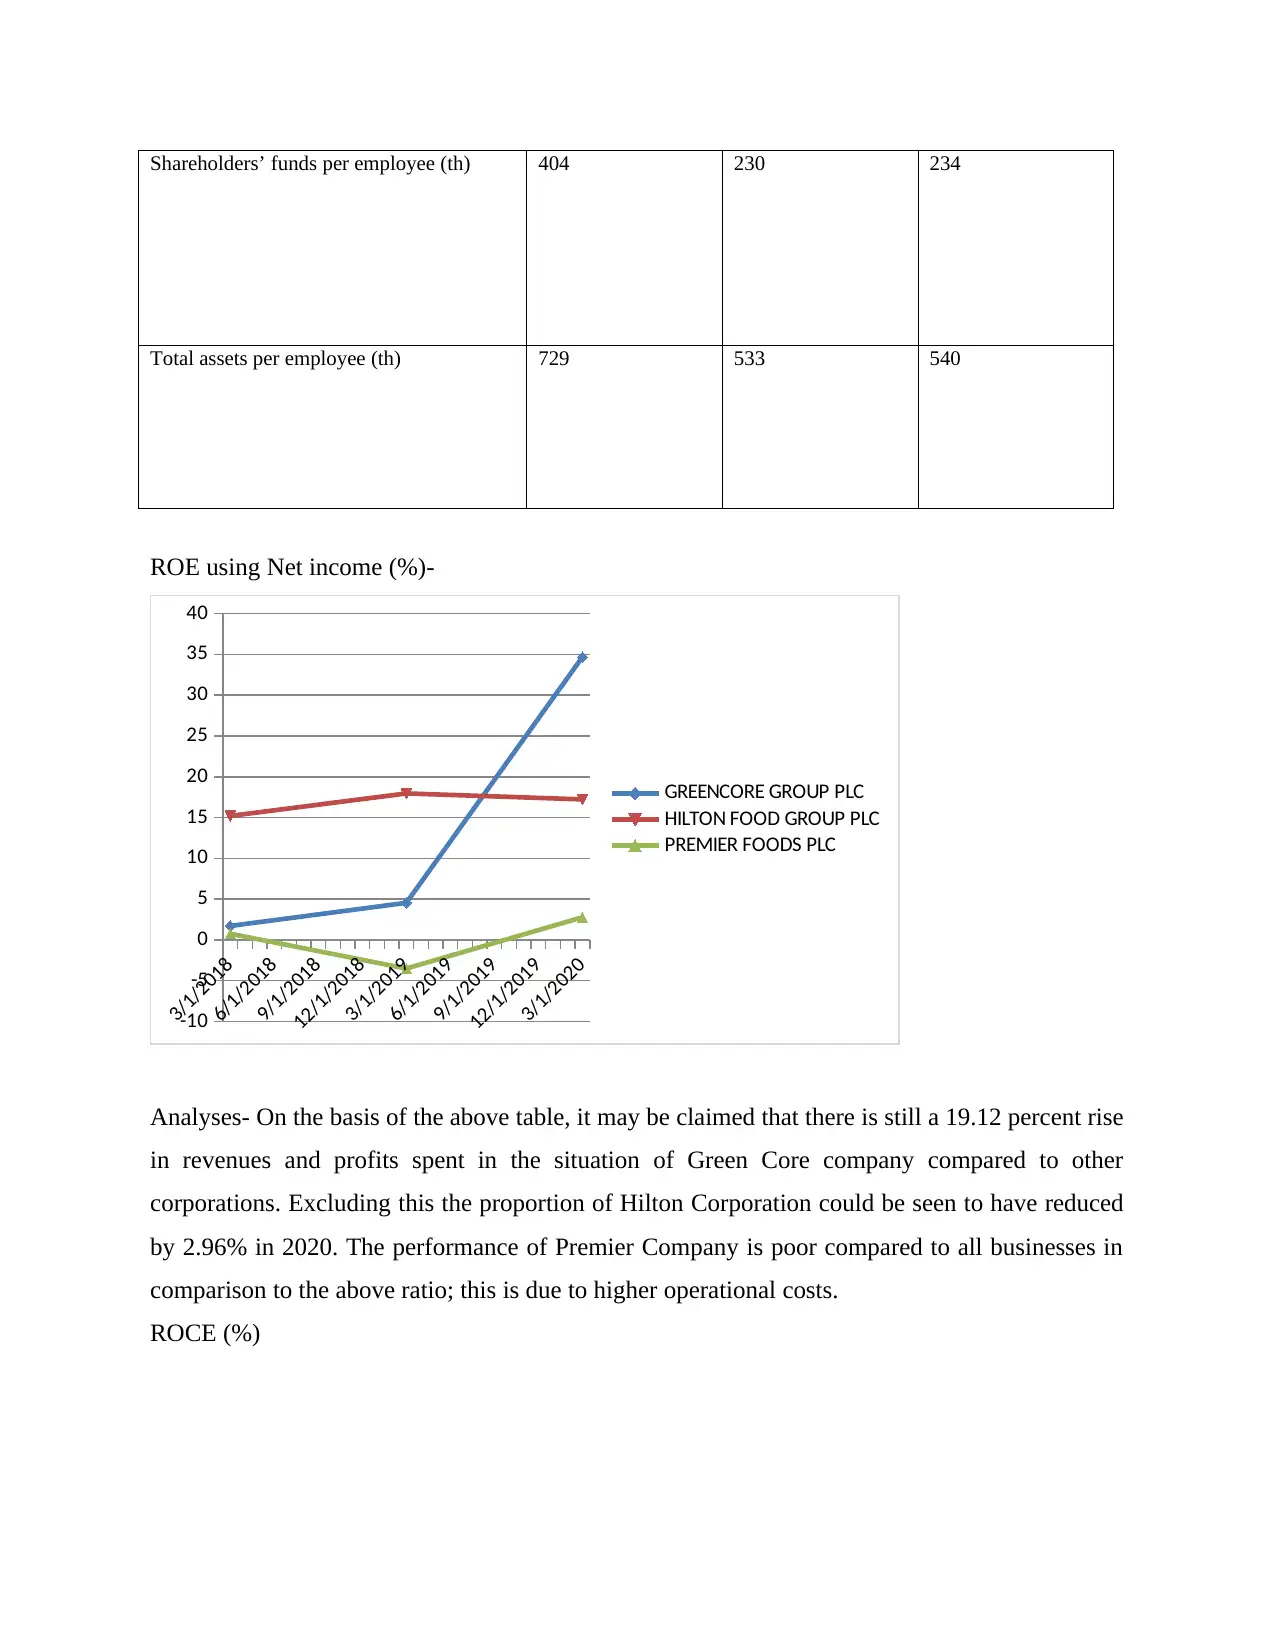
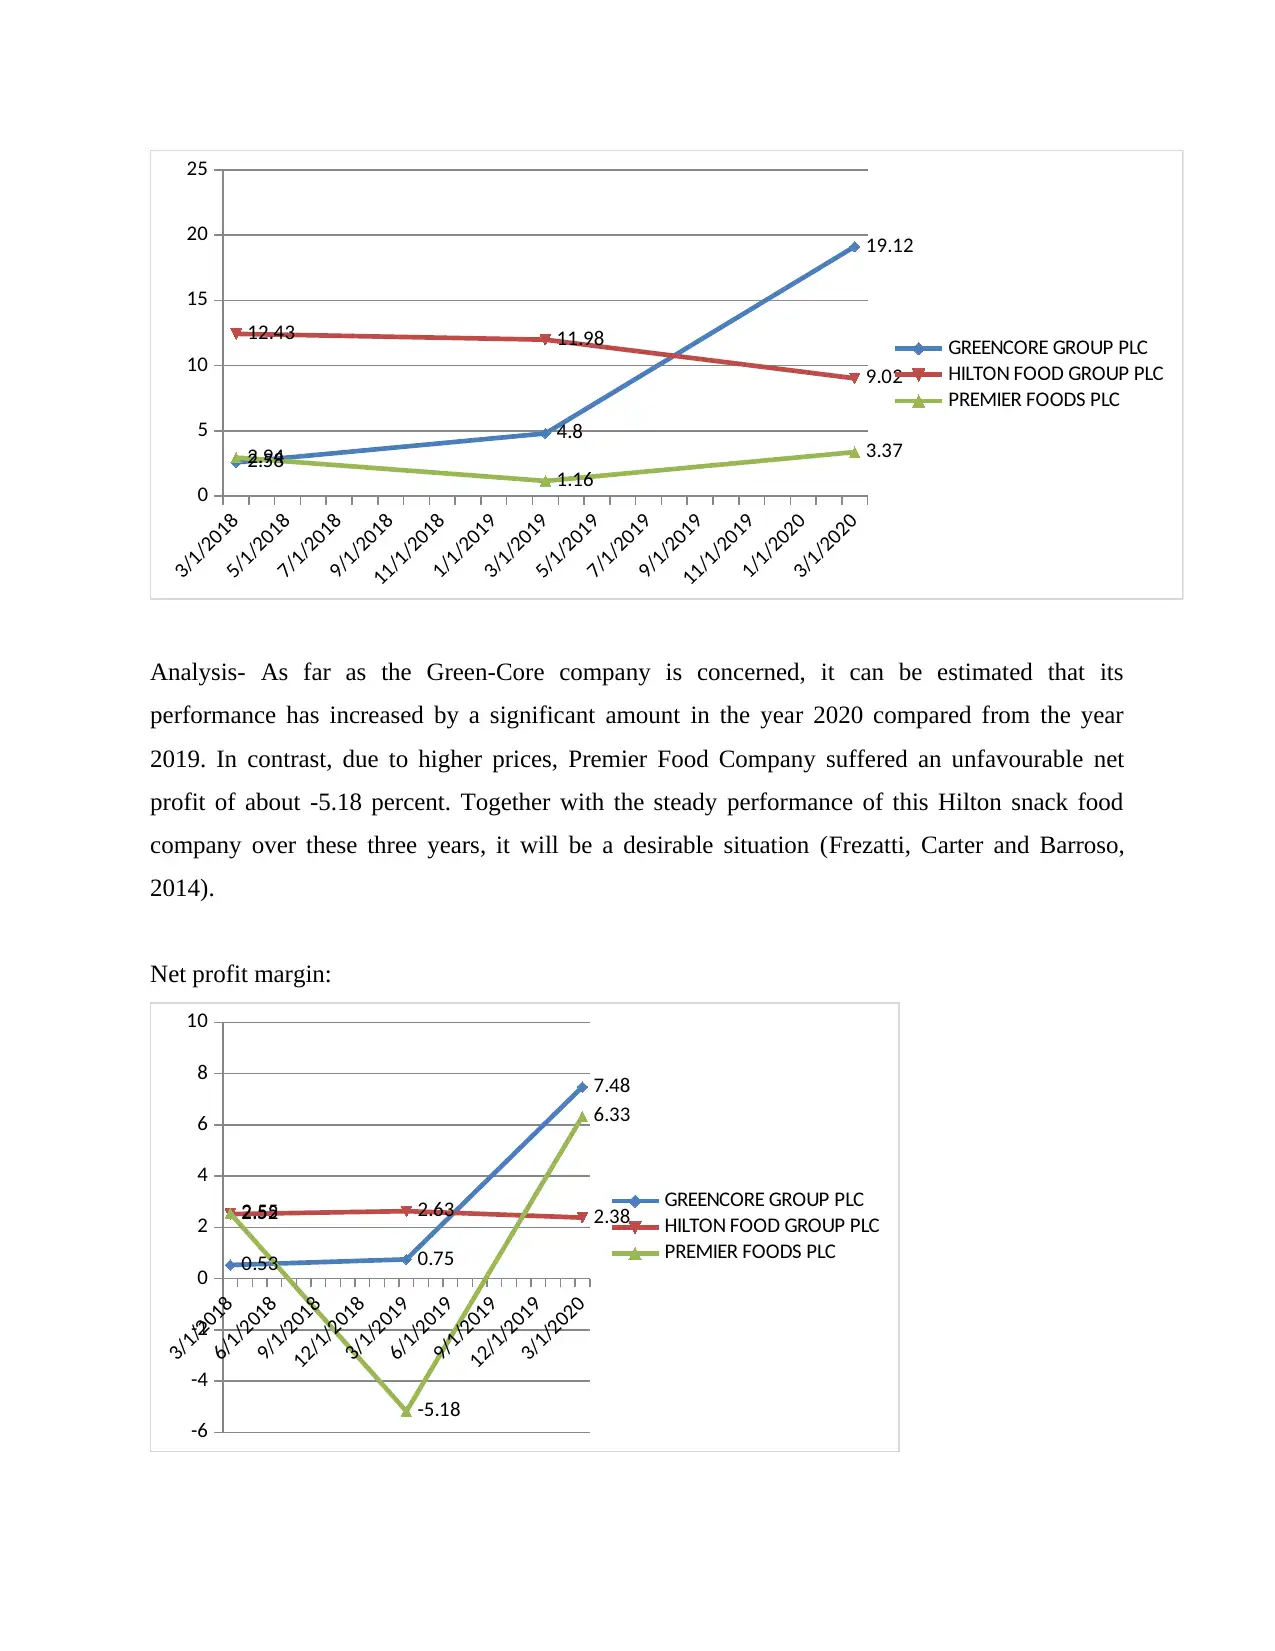
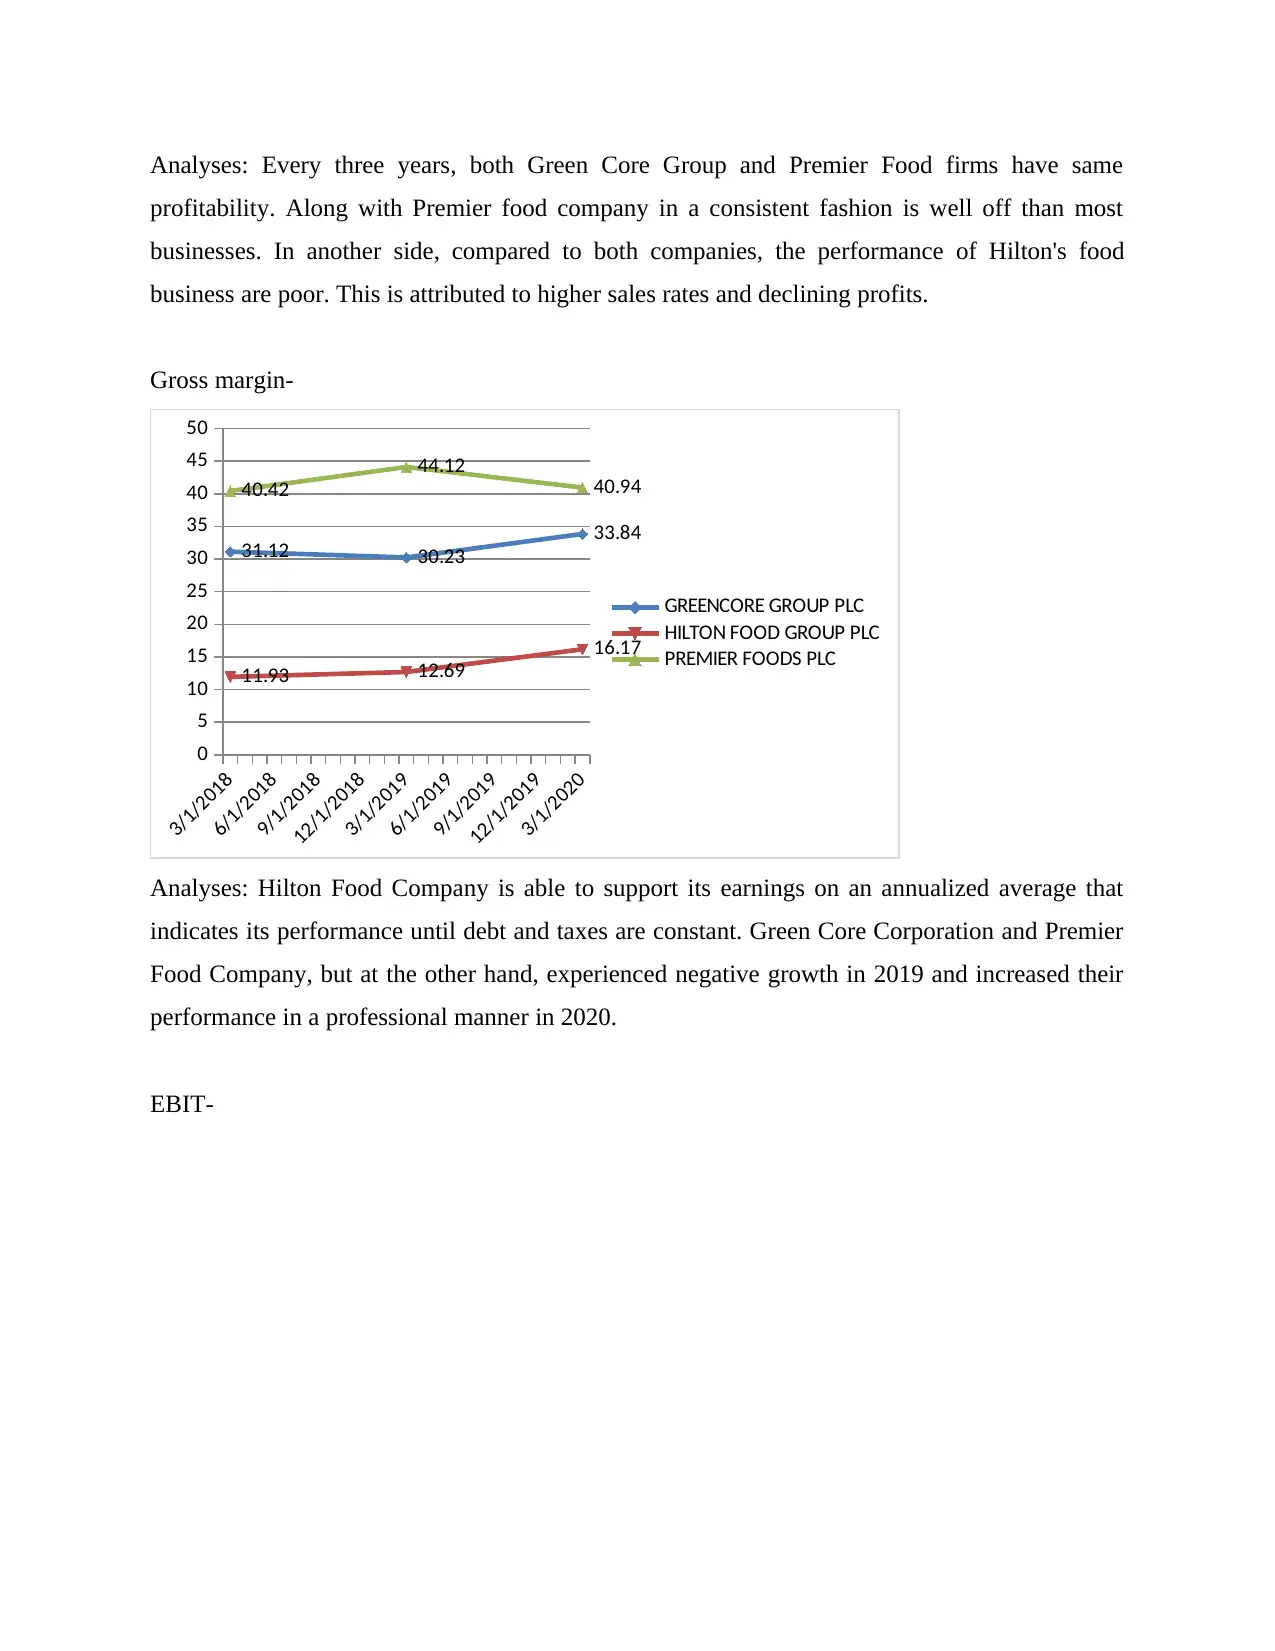
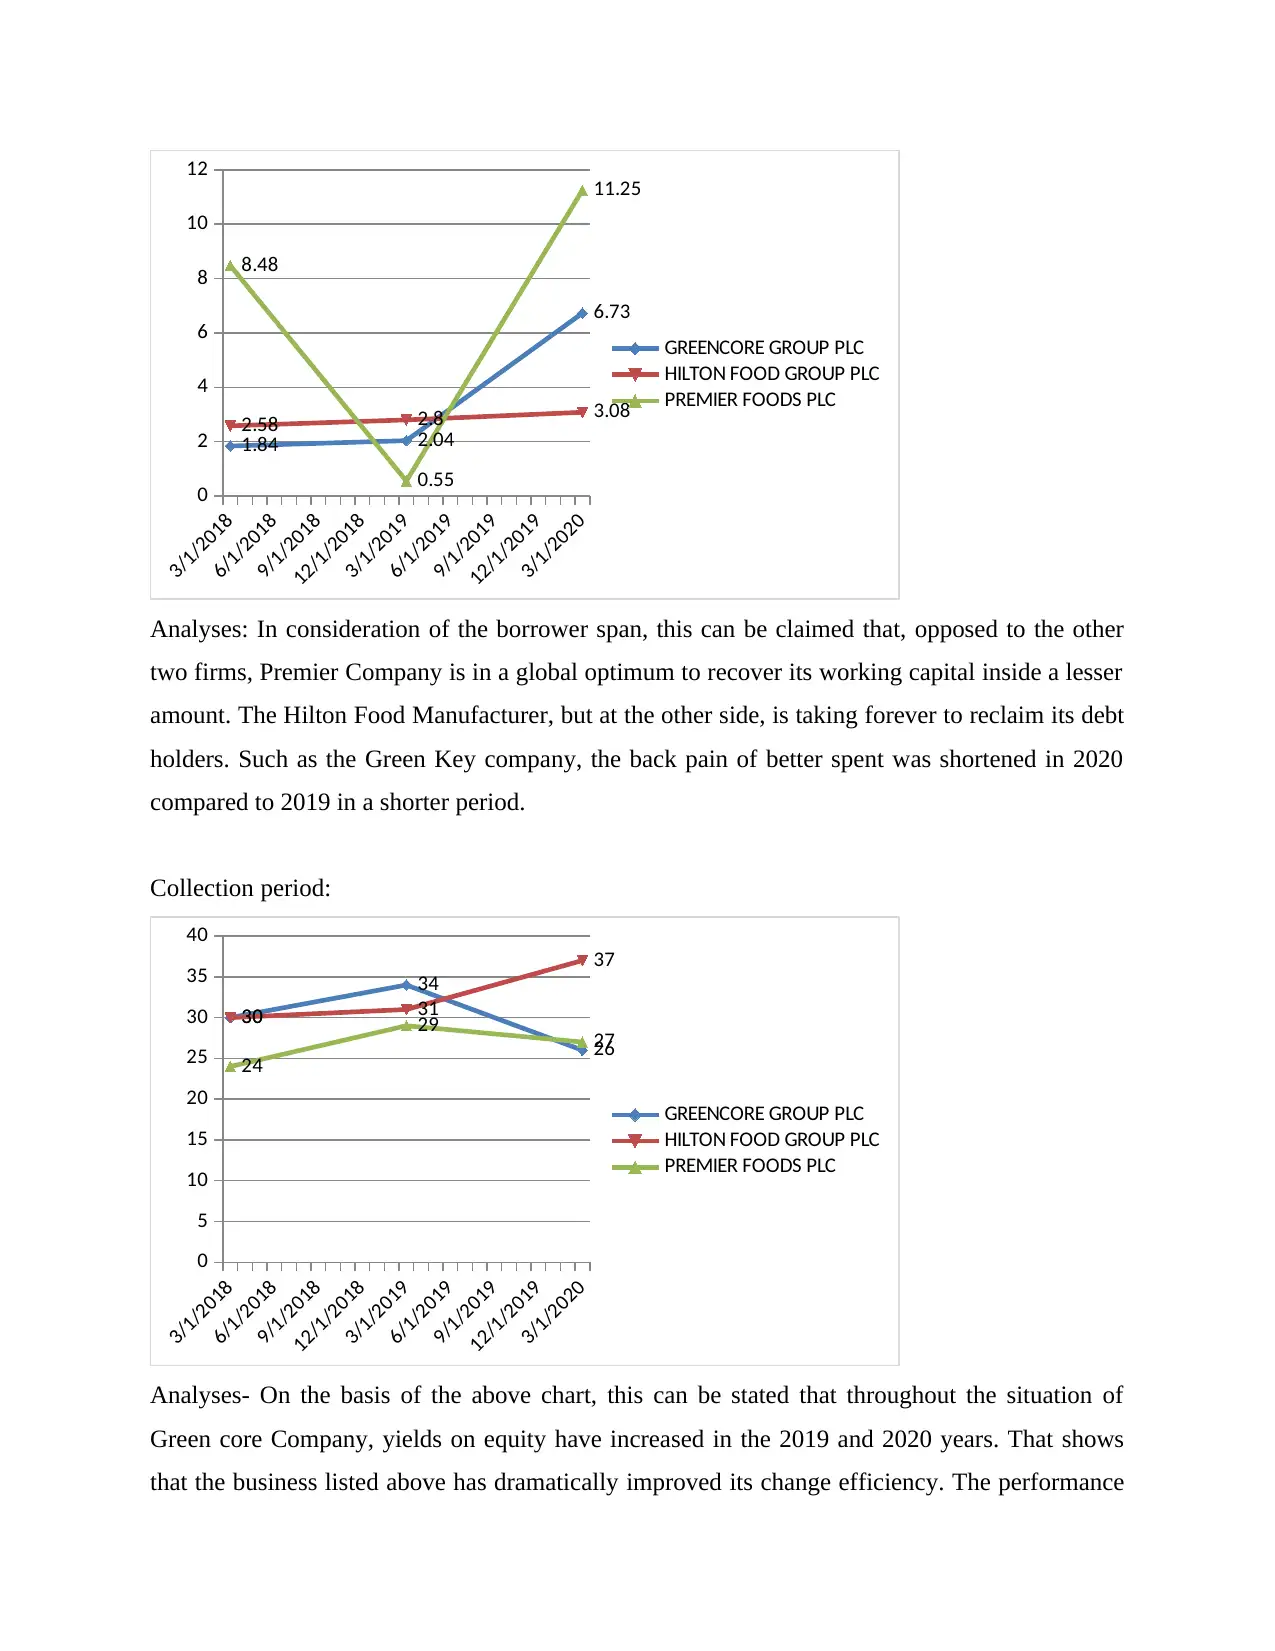
This report presents a comparative financial analysis of three major food industry companies: Green Core Group plc, Hilton Food Group plc, and Premier Foods Plc. It begins with an introduction that outlines the scope of the analysis, focusing on the companies' strategic objectives, marketing plans, and core values. The main body of the report is divided into two sections. Section A examines the companies' visions, missions, and strategic priorities. It also includes detailed financial and non-financial ratio analyses, including ROE, ROCE, profit margin, and current ratios, comparing the performance of the three companies over a three-year period. Section B delves into financing channels and the impact of financing on shareholders. The report includes graphical representations of key financial ratios for easy comparison and concludes with a summary of findings and key takeaways. The analysis highlights the relative strengths and weaknesses of each company, providing insights into their financial health and performance trends.
Document Page
Accounting and Finance for Managers
tabler-icon-diamond-filled.svg

Paraphrase This Document

Need a fresh take? Get an instant paraphrase of this document with our AI Paraphraser
Document Page
Contents
INTRODUCTION...........................................................................................................................3
MAIN BODY..................................................................................................................................3
SECTION A.....................................................................................................................................3
SECTION B...................................................................................................................................14
CONCLUSION..............................................................................................................................16
REFERENCES..............................................................................................................................17
Document Page
INTRODUCTION
The whole report depends on the critical integration of various firms: Green Core Group plc,
Hilton Food Group plc and Premier Food Plc that are top rivals in the same sector. The very first
chapter identifies the study of ratios and growth strategies, priorities and objectives of these
firms, whereas other sections address lengthy internally and externally financing channels and to
what degree deep origin financing impacts shareholders.
MAIN BODY
SECTION A
1a
Green core Group Plc: The vision of the company to raise competition throughout the
increasingly increasing food economy depends on two main facets: enhancing the service
portfolio and allowing customers to purchase more (Canziani,, 2014). The marketing plan is to
increasingly improve their importance to consumers by driving sales via a common value chain,
raising values through their portfolios, and make the customers' lives simpler. The achievement
of the strategic purpose of the Company relies on multiple main features: improved food safety,
core persons, Green core Reputation and Conservation Business. To adopt this plan, a large and
competent endeavour marked by a mutual contribution to the success of the Green core Route
organisation is required.
Hilton Food Group Plc: For a long time, the firm has been a creative corporation with sound
principles. What drives their consumers is the institution's reputation for growth. And their trust
in long-term partnerships has spurred our growth globally. The aim of the organisation is to
guarantee the profitability of the retailer leaders in the industry over their competitors. As a
company, the attainable mission is to rely on total teamwork. The determination, energy and
ability of the organisation to do all it can to help the partners of the business prosper. One
mission, one purpose, one goal that is shared. Organizational individuals are in the centre of
anything businesses do. The company's culture was always distinctive and significant. The
values of the organisation define the ways in which we perceive them as an organization and the
way in which we act as people. Company workers work as collaborators, focused on shared
goals and accepted priorities, to help stakeholders. These habits are the origin and fundamental
of our culture.
Document Page
Premier Foods Plc: The company's mission means that what they have to achieve here is to make
excellent food that their consumers love, tasty food that is easy to prepare and available in
diverse formats. This explains why in 94 percent of total British communities, buyers find their
brands (Brown, 2014). Company embraces its esteemed labels and excellent products, and its
aim is to illustrate how corporate food is at the heart of how good a partner does every day.
Company is committed to creating a truly wonderful workplace. The shared values of the
organisation provide individuals with a simple equation basis and help instruct them in the
manner they conduct stuff, as well as challenge each other to represent them every day.
Remarkable progress has been made over the last 3 years in implementing the Group's principles
and priorities around the company, increasing engagement in cooperation and contact with
workers, and strengthening training in field.
1b
Financial and non-financial ratios:
GREENCORE GROUP PLC 28-03-2020 30-03-2019 31-03-2018
ROE using Net income (%) 34.66 4.55 1.72
ROCE using Net income (%) 19.12 4.8 2.58
Profit margin (%) 7.48 0.75 0.53
Gross margin (%) 33.84 30.23 31.12
EBIT margin (%) 6.73 2.04 1.84
Collection period (days) 26 34 30
Credit period (days) 54 50 47
Current ratio (x) 0.69 2.01 0.75
Gearing (%) 156.67 90.47 119.39
Net assets turnover (x) 2.06 1.81 1.49
tabler-icon-diamond-filled.svg

Paraphrase This Document

Need a fresh take? Get an instant paraphrase of this document with our AI Paraphraser
Document Page
Non-financial ratios 28-03-2020 30-03-2019 31-03-2018
Shareholders’ funds per employee (th) 26 64 58
Total assets per employee (th) 100 173 167
HILTON FOOD GROUP PLC 28-03-2020 30-03-2019 31-03-2018
ROE using Net income (%) 17.23 17.95 15.2
∟ ROCE using Net income (%) 9.02 11.98 12.43
Profit margin (%) 2.38 2.63 2.52
∟ Gross margin (%) 16.17 12.69 11.93
EBIT margin (%) 3.08 2.8 2.58
Collection period (days) 37 31 30
∟ Credit period (days) 54 50 47
Current ratio (x) 1.05 1.23 1.2
Gearing (%) 175.87 66.57 36.16
Net assets turnover (x) 3.58 5.56 6.53
Non-financial ratios 28-03-2020 30-03-2019 31-03-2018
Document Page
Shareholders’ funds per employee (th) 38 38 44
Total assets per employee (th) 181 121 116
PREMIER FOODS PLC 28-03-2020 30-03-2019 31-03-2018
ROE using Net income (%) 2.77 -3.51 0.76
ROCE using Net income (%) 3.37 1.16 2.94
Profit margin (%) 6.33 -5.18 2.55
∟ Gross margin (%) 40.94 44.12 40.42
EBIT margin (%) 11.25 0.55 8.48
Collection period (days) 27 29 24
∟ Credit period (days) 65 65 59
Current ratio (x) 0.98 0.78 0.78
Gearing (%) 64.91 105.83 106.9
Net assets turnover (x) 0.32 0.42 0.42
Non-financial ratios 28-03-2020 30-03-2019 31-03-2018
Document Page
Shareholders’ funds per employee (th) 404 230 234
Total assets per employee (th) 729 533 540
ROE using Net income (%)-
3/1/2018
6/1/2018
9/1/2018
12/1/2018
3/1/2019
6/1/2019
9/1/2019
12/1/2019
3/1/2020
-10
-5
0
5
10
15
20
25
30
35
40
GREENCORE GROUP PLC
HILTON FOOD GROUP PLC
PREMIER FOODS PLC
Analyses- On the basis of the above table, it may be claimed that there is still a 19.12 percent rise
in revenues and profits spent in the situation of Green Core company compared to other
corporations. Excluding this the proportion of Hilton Corporation could be seen to have reduced
by 2.96% in 2020. The performance of Premier Company is poor compared to all businesses in
comparison to the above ratio; this is due to higher operational costs.
ROCE (%)
tabler-icon-diamond-filled.svg

Paraphrase This Document

Need a fresh take? Get an instant paraphrase of this document with our AI Paraphraser
Document Page
3/1/2018
5/1/2018
7/1/2018
9/1/2018
11/1/2018
1/1/2019
3/1/2019
5/1/2019
7/1/2019
9/1/2019
11/1/2019
1/1/2020
3/1/2020
0
5
10
15
20
25
2.58
4.8
19.12
12.43 11.98
9.02
2.94
1.16
3.37
GREENCORE GROUP PLC
HILTON FOOD GROUP PLC
PREMIER FOODS PLC
Analysis- As far as the Green-Core company is concerned, it can be estimated that its
performance has increased by a significant amount in the year 2020 compared from the year
2019. In contrast, due to higher prices, Premier Food Company suffered an unfavourable net
profit of about -5.18 percent. Together with the steady performance of this Hilton snack food
company over these three years, it will be a desirable situation (Frezatti, Carter and Barroso,
2014).
Net profit margin:
3/1/2018
6/1/2018
9/1/2018
12/1/2018
3/1/2019
6/1/2019
9/1/2019
12/1/2019
3/1/2020
-6
-4
-2
0
2
4
6
8
10
0.53 0.75
7.48
2.52 2.63 2.382.55
-5.18
6.33
GREENCORE GROUP PLC
HILTON FOOD GROUP PLC
PREMIER FOODS PLC
Document Page
Analyses: Every three years, both Green Core Group and Premier Food firms have same
profitability. Along with Premier food company in a consistent fashion is well off than most
businesses. In another side, compared to both companies, the performance of Hilton's food
business are poor. This is attributed to higher sales rates and declining profits.
Gross margin-
3/1/2018
6/1/2018
9/1/2018
12/1/2018
3/1/2019
6/1/2019
9/1/2019
12/1/2019
3/1/2020
0
5
10
15
20
25
30
35
40
45
50
31.12 30.23
33.84
11.93 12.69
16.17
40.42
44.12 40.94
GREENCORE GROUP PLC
HILTON FOOD GROUP PLC
PREMIER FOODS PLC
Analyses: Hilton Food Company is able to support its earnings on an annualized average that
indicates its performance until debt and taxes are constant. Green Core Corporation and Premier
Food Company, but at the other hand, experienced negative growth in 2019 and increased their
performance in a professional manner in 2020.
EBIT-
Document Page
3/1/2018
6/1/2018
9/1/2018
12/1/2018
3/1/2019
6/1/2019
9/1/2019
12/1/2019
3/1/2020
0
2
4
6
8
10
12
1.84 2.04
6.73
2.58 2.8 3.08
8.48
0.55
11.25
GREENCORE GROUP PLC
HILTON FOOD GROUP PLC
PREMIER FOODS PLC
Analyses: In consideration of the borrower span, this can be claimed that, opposed to the other
two firms, Premier Company is in a global optimum to recover its working capital inside a lesser
amount. The Hilton Food Manufacturer, but at the other side, is taking forever to reclaim its debt
holders. Such as the Green Key company, the back pain of better spent was shortened in 2020
compared to 2019 in a shorter period.
Collection period:
3/1/2018
6/1/2018
9/1/2018
12/1/2018
3/1/2019
6/1/2019
9/1/2019
12/1/2019
3/1/2020
0
5
10
15
20
25
30
35
40
30
34
26
30 31
37
24
29 27
GREENCORE GROUP PLC
HILTON FOOD GROUP PLC
PREMIER FOODS PLC
Analyses- On the basis of the above chart, this can be stated that throughout the situation of
Green core Company, yields on equity have increased in the 2019 and 2020 years. That shows
that the business listed above has dramatically improved its change efficiency. The performance
tabler-icon-diamond-filled.svg

Paraphrase This Document

Need a fresh take? Get an instant paraphrase of this document with our AI Paraphraser
Document Page
of Hilton Company in the years 2019 and 2020, but at the other side, is strong, which reveals that
they've been capable of generating decent returns on equities. In the situation of the Premier food
company, their productivity can be judged as being too low relative to all other companies.
Credit period:
3/1/2018
6/1/2018
9/1/2018
12/1/2018
3/1/2019
6/1/2019
9/1/2019
12/1/2019
3/1/2020
0
10
20
30
40
50
60
70
47 50 54
59
65 65
GREENCORE GROUP PLC
HILTON FOOD GROUP PLC
PREMIER FOODS PLC
Analyses- Both Green Core and Hilton Food have similar redemption cycles, which both clear
up their commitments within that amount of time. Since it takes extra time for Hilton Food plc to
resolve its responsibilities (Marquardts and Zur, 2015).
Current ratio:
3/1/2018
6/1/2018
9/1/2018
12/1/2018
3/1/2019
6/1/2019
9/1/2019
12/1/2019
3/1/2020
0
0.5
1
1.5
2
2.5
0.75
2.01
0.69
1.2 1.23
1.05
0.78 0.78
0.98 GREENCORE GROUP PLC
HILTON FOOD GROUP PLC
PREMIER FOODS PLC
Document Page
Analyses: The optimum current ratio is commonly assumed to be 2:1, but from the
aforementioned chart it can be viewed that certain Green Core plc is likely to retain this ratio
throughout the period-2019. Although the rest of the companies were hesitant to do so leading to
increased current commitments.
Net assets turnover ratio
3/1/2018
6/1/2018
9/1/2018
12/1/2018
3/1/2019
6/1/2019
9/1/2019
12/1/2019
3/1/2020
0
1
2
3
4
5
6
7
1.49 1.81 2.06
6.53
5.56
3.58
0.42 0.42 0.32
GREENCORE GROUP PLC
HILTON FOOD GROUP PLC
PREMIER FOODS PLC
Analysis- This can be seen on the basis of the above map that the Hilton Snack Food business
has a healthy ratio as it is prepared to handle its assets with less timeline and cost. Although
Premier nutrition has a lower proportion, it states that its cash cannot be regulated by the firm
(Samkin and Schneider, 2014).
Shareholder fund per employee-
chevron_up_icon
1 out of 17
circle_padding
hide_on_mobile
zoom_out_icon
[object Object]