Financial Performance Management and Variance Analysis Report
VerifiedAdded on 2022/12/28
|13
|2674
|79
Report
AI Summary
This report undertakes a detailed analysis of financial performance management, encompassing cost calculations, variance analysis, and budgeting techniques. The report begins by calculating cost per unit using both labor hours and activity-based costing approaches, followed by a comparative analysis of the results. Sensitivity analysis is applied to aid managers in dealing with uncertainties. The report then delves into variance calculations, including material usage, mix, and yield variances, while also addressing problems associated with the current system of calculating and reporting variances. Finally, it provides a critical discussion of zero-based budgeting (ZBB) and incremental budgeting (IB) to determine their effectiveness in planning, coordination, and control. The report concludes by assessing the suitability of these methods for financial planning.

Financial Performance
Management
Management
Paraphrase This Document
Need a fresh take? Get an instant paraphrase of this document with our AI Paraphraser
Table of Contents
INTRODUCTION...........................................................................................................................1
QUESTION 1...................................................................................................................................1
(a) Calculate cost per unit on basis of labour hours....................................................................1
(b) Calculate cost per unit on basis of activity based costing approach......................................2
(c) Analysis results on basis of labour hours and activity based costing approach....................4
(d) Sensitivity analysis help managers to cope with uncertainties..............................................5
QUESTION 2...................................................................................................................................6
(a) Calculation of variances........................................................................................................6
(b) Problems with current system of calculating and reporting variances..................................7
QUESTION 3...................................................................................................................................8
Critically discussed neither ZBB nor the IB provides the perfect toll for planning coordination
and control...................................................................................................................................8
CONCLUSION ...............................................................................................................................8
REFERENCES..............................................................................................................................10
INTRODUCTION
Financial performance management is a continuous cycle of business and essential at
every step for growth & success. It is a subjective measurement that conduct by the every
organisation to effective run their business activities in proper manner. The management use this
term to measure overall efficiency and financial health in specified period of time. There are
various ways to analysis the financial performance and should be taken in aggregated. Moreover
analyst and investors wish to look deeper into financial reports and declining debt (Ye, Xiao and
Zhou, 2019). This report based on the calculation of cost as per the method of activity based
costing and absorption costing. In this report consist of apply sensitivity analysis to support
managers and calculate different material variances. Along with analysis the problems with
current system and variances for analysing the performance. At the end of the report, critically
discuss about the ZBB and incremental budgeting for perfect planning.
QUESTION 1
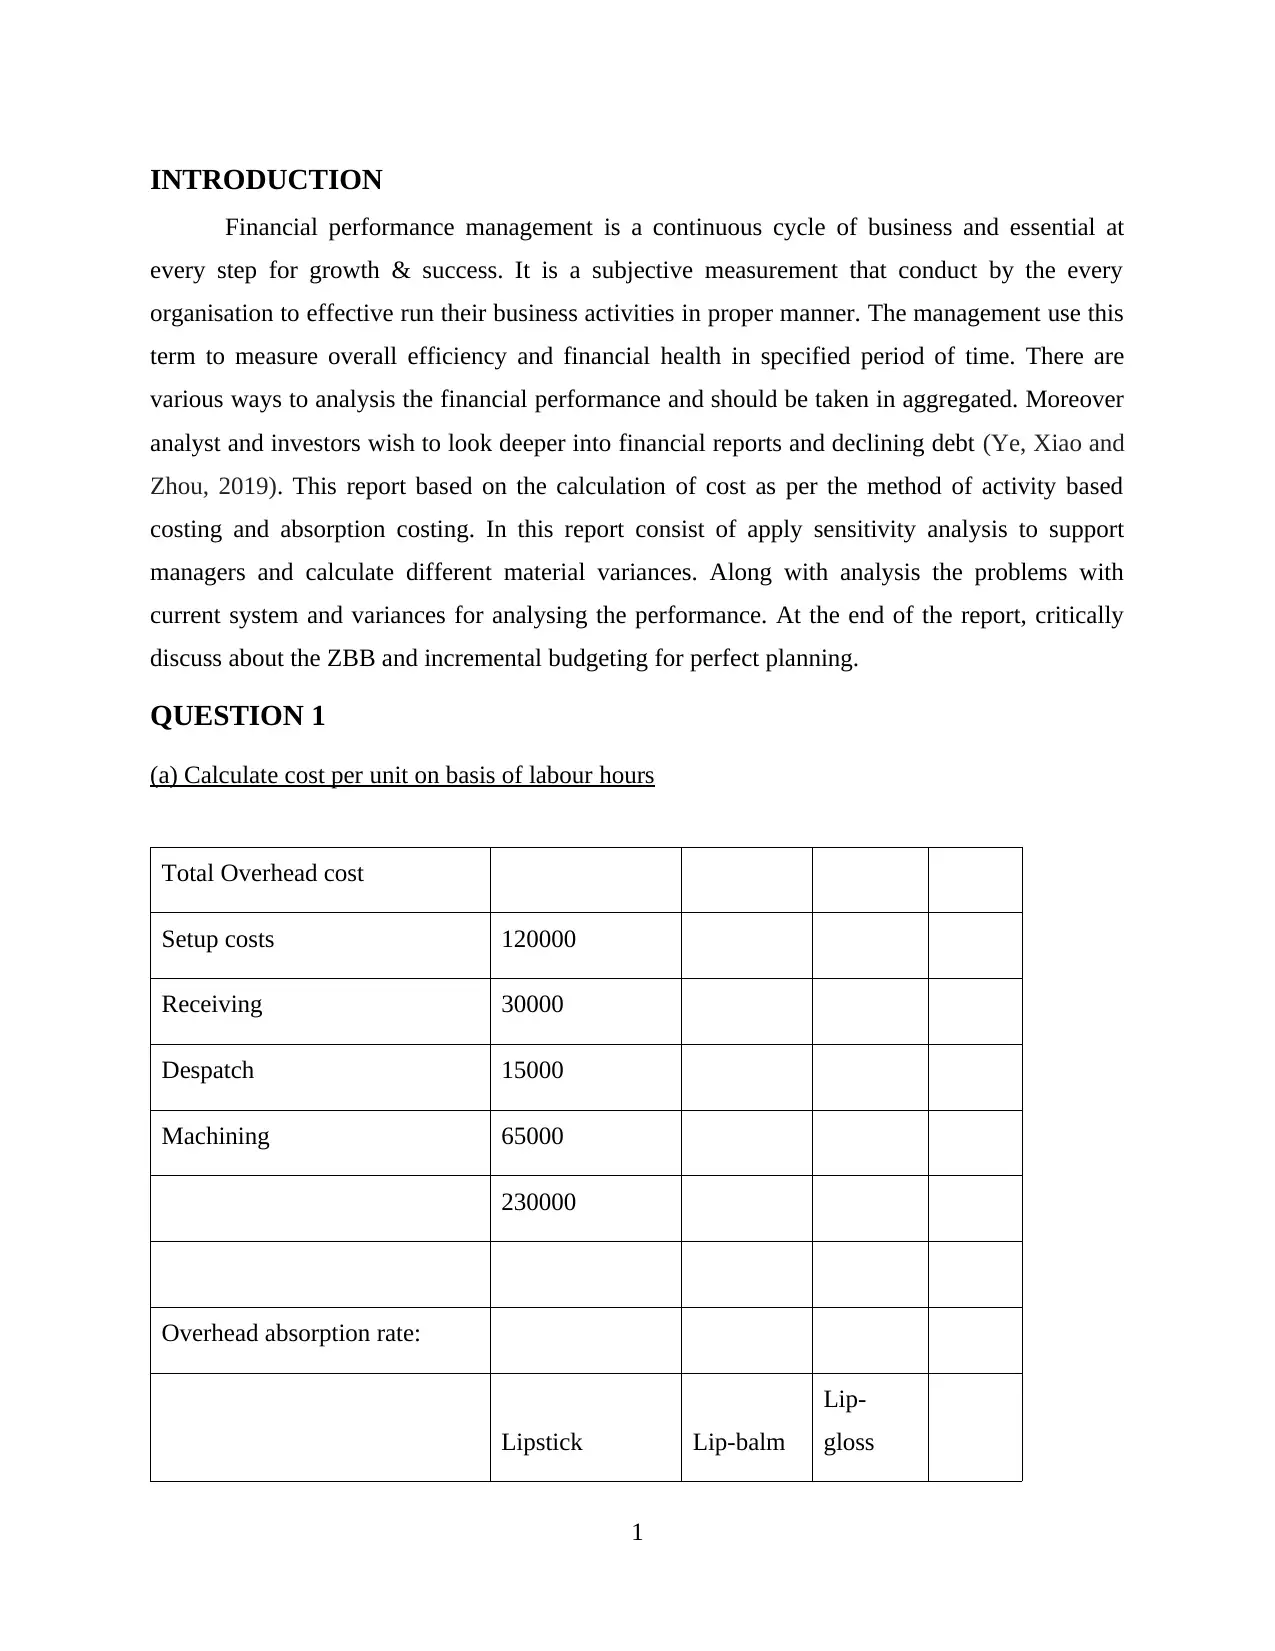
(a) Calculate cost per unit on basis of labour hours
Total Overhead cost
Setup costs 120000
Receiving 30000
Despatch 15000
Machining 65000
230000
Overhead absorption rate:
Lipstick Lip-balm
Lip-
gloss
1
Financial performance management is a continuous cycle of business and essential at
every step for growth & success. It is a subjective measurement that conduct by the every
organisation to effective run their business activities in proper manner. The management use this
term to measure overall efficiency and financial health in specified period of time. There are
various ways to analysis the financial performance and should be taken in aggregated. Moreover
analyst and investors wish to look deeper into financial reports and declining debt (Ye, Xiao and
Zhou, 2019). This report based on the calculation of cost as per the method of activity based
costing and absorption costing. In this report consist of apply sensitivity analysis to support
managers and calculate different material variances. Along with analysis the problems with
current system and variances for analysing the performance. At the end of the report, critically
discuss about the ZBB and incremental budgeting for perfect planning.
QUESTION 1
(a) Calculate cost per unit on basis of labour hours
Total Overhead cost
Setup costs 120000
Receiving 30000
Despatch 15000
Machining 65000
230000
Overhead absorption rate:
Lipstick Lip-balm
Lip-
gloss
1
⊘ This is a preview!⊘
Do you want full access?
Subscribe today to unlock all pages.
Trusted by 1+ million students worldwide
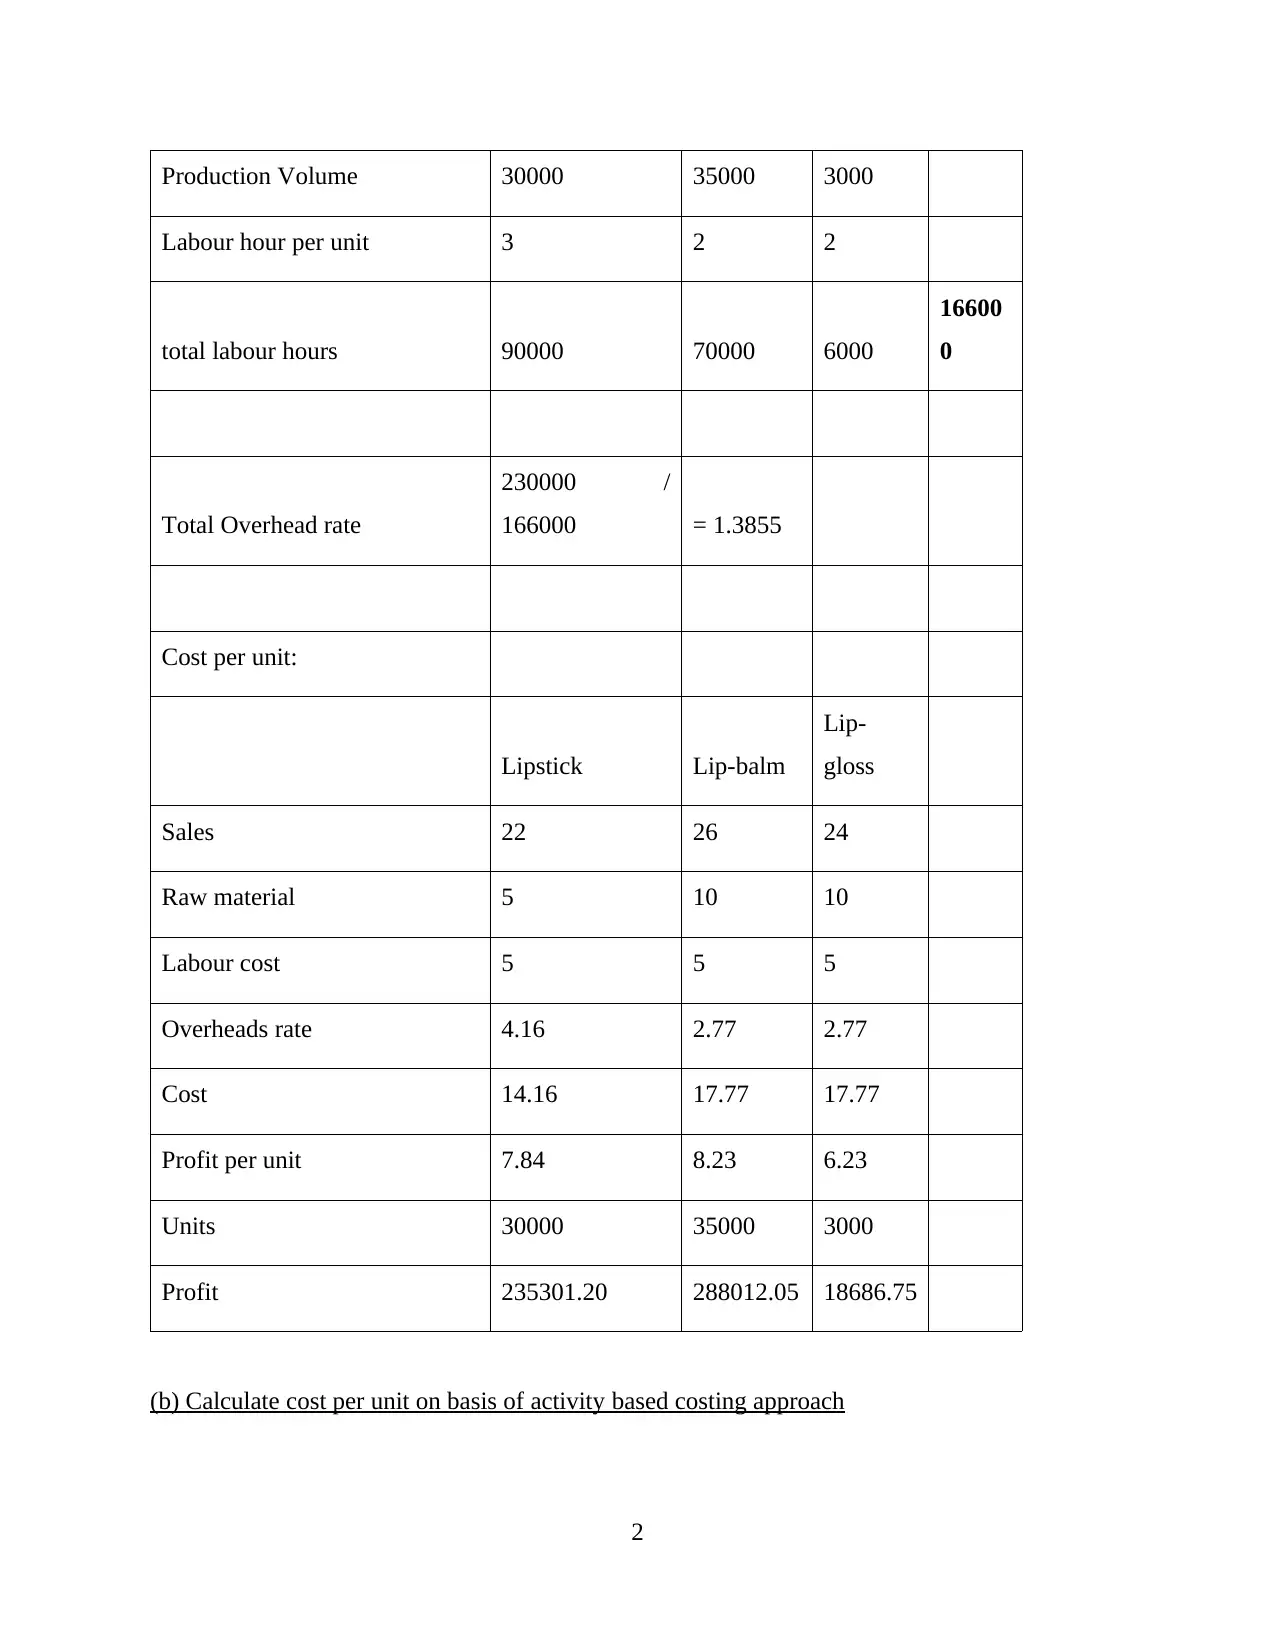
Production Volume 30000 35000 3000
Labour hour per unit 3 2 2
total labour hours 90000 70000 6000
16600
0
Total Overhead rate
230000 /
166000 = 1.3855
Cost per unit:
Lipstick Lip-balm
Lip-
gloss
Sales 22 26 24
Raw material 5 10 10
Labour cost 5 5 5
Overheads rate 4.16 2.77 2.77
Cost 14.16 17.77 17.77
Profit per unit 7.84 8.23 6.23
Units 30000 35000 3000
Profit 235301.20 288012.05 18686.75
(b) Calculate cost per unit on basis of activity based costing approach
2
Paraphrase This Document
Need a fresh take? Get an instant paraphrase of this document with our AI Paraphraser
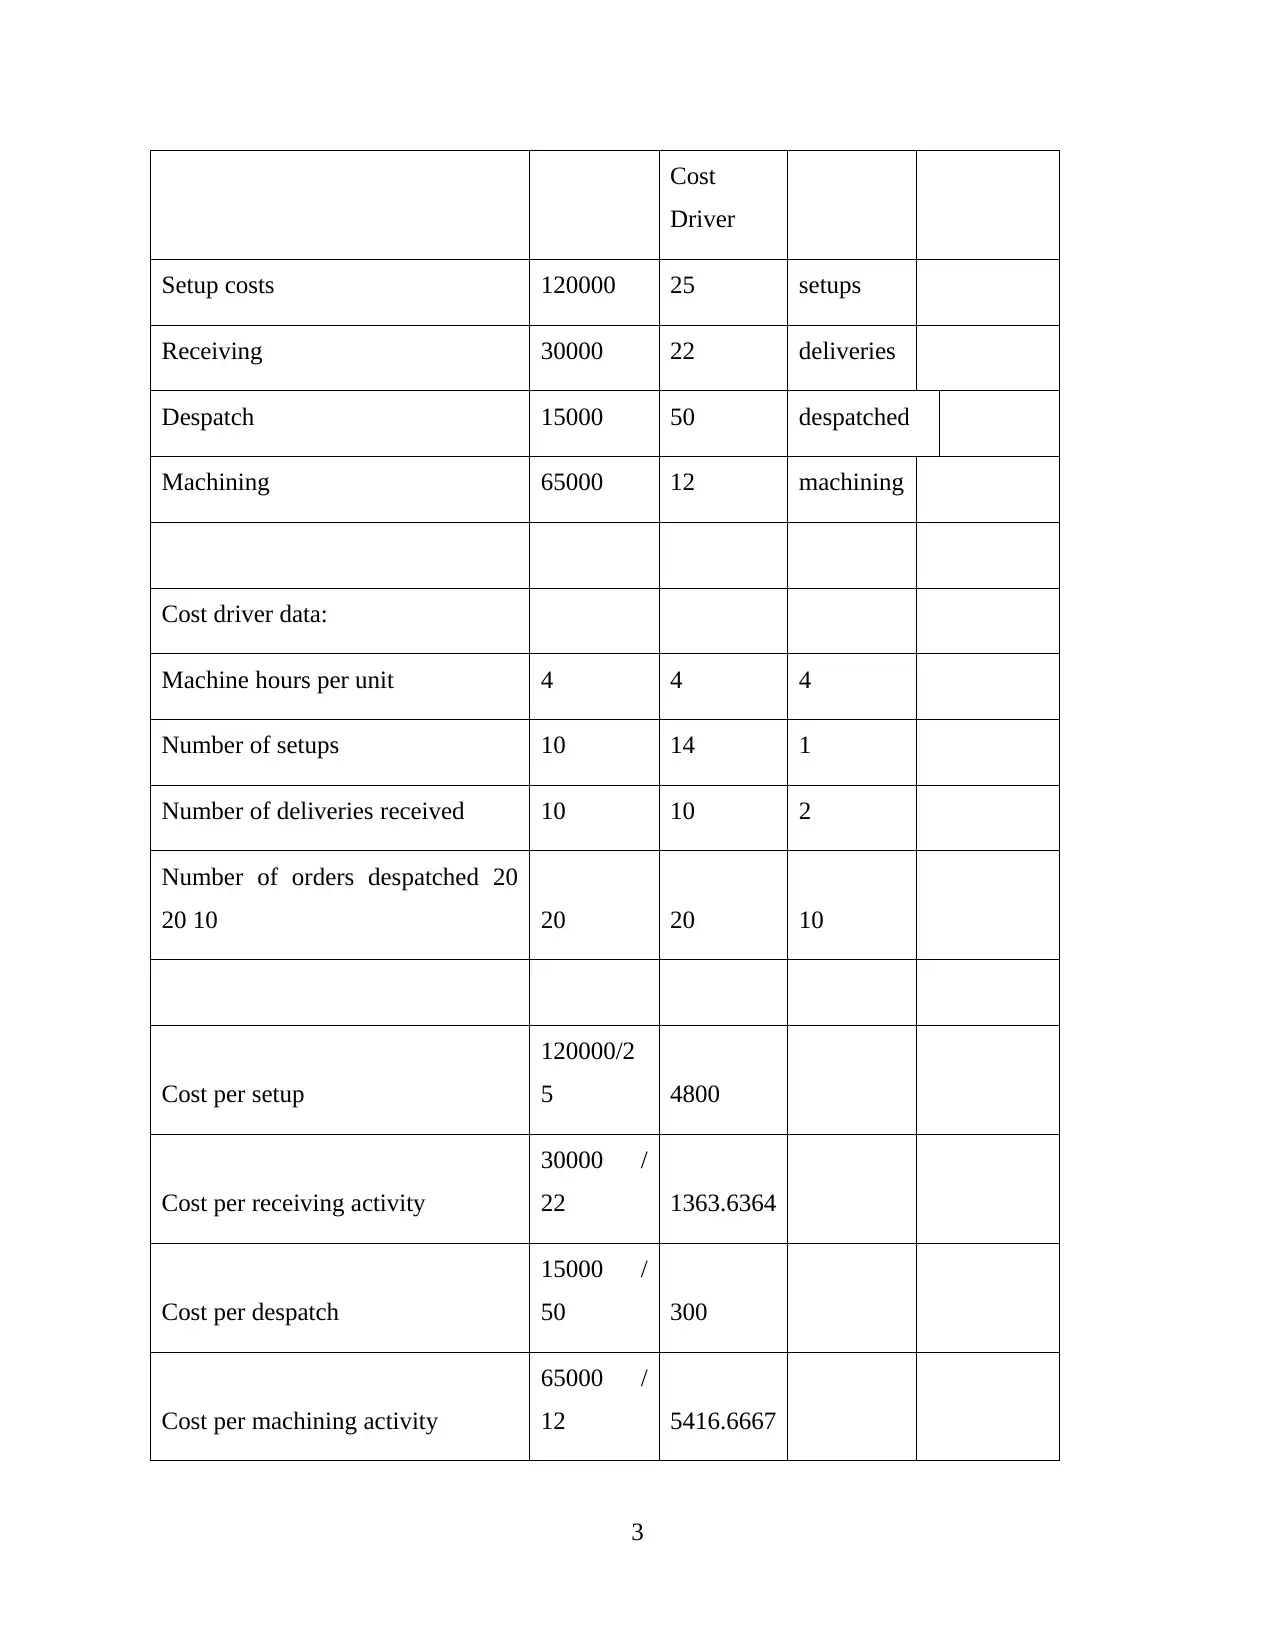
Cost
Driver
Setup costs 120000 25 setups
Receiving 30000 22 deliveries
Despatch 15000 50 despatched
Machining 65000 12 machining
Cost driver data:
Machine hours per unit 4 4 4
Number of setups 10 14 1
Number of deliveries received 10 10 2
Number of orders despatched 20
20 10 20 20 10
Cost per setup
120000/2
5 4800
Cost per receiving activity
30000 /
22 1363.6364
Cost per despatch
15000 /
50 300
Cost per machining activity
65000 /
12 5416.6667
3
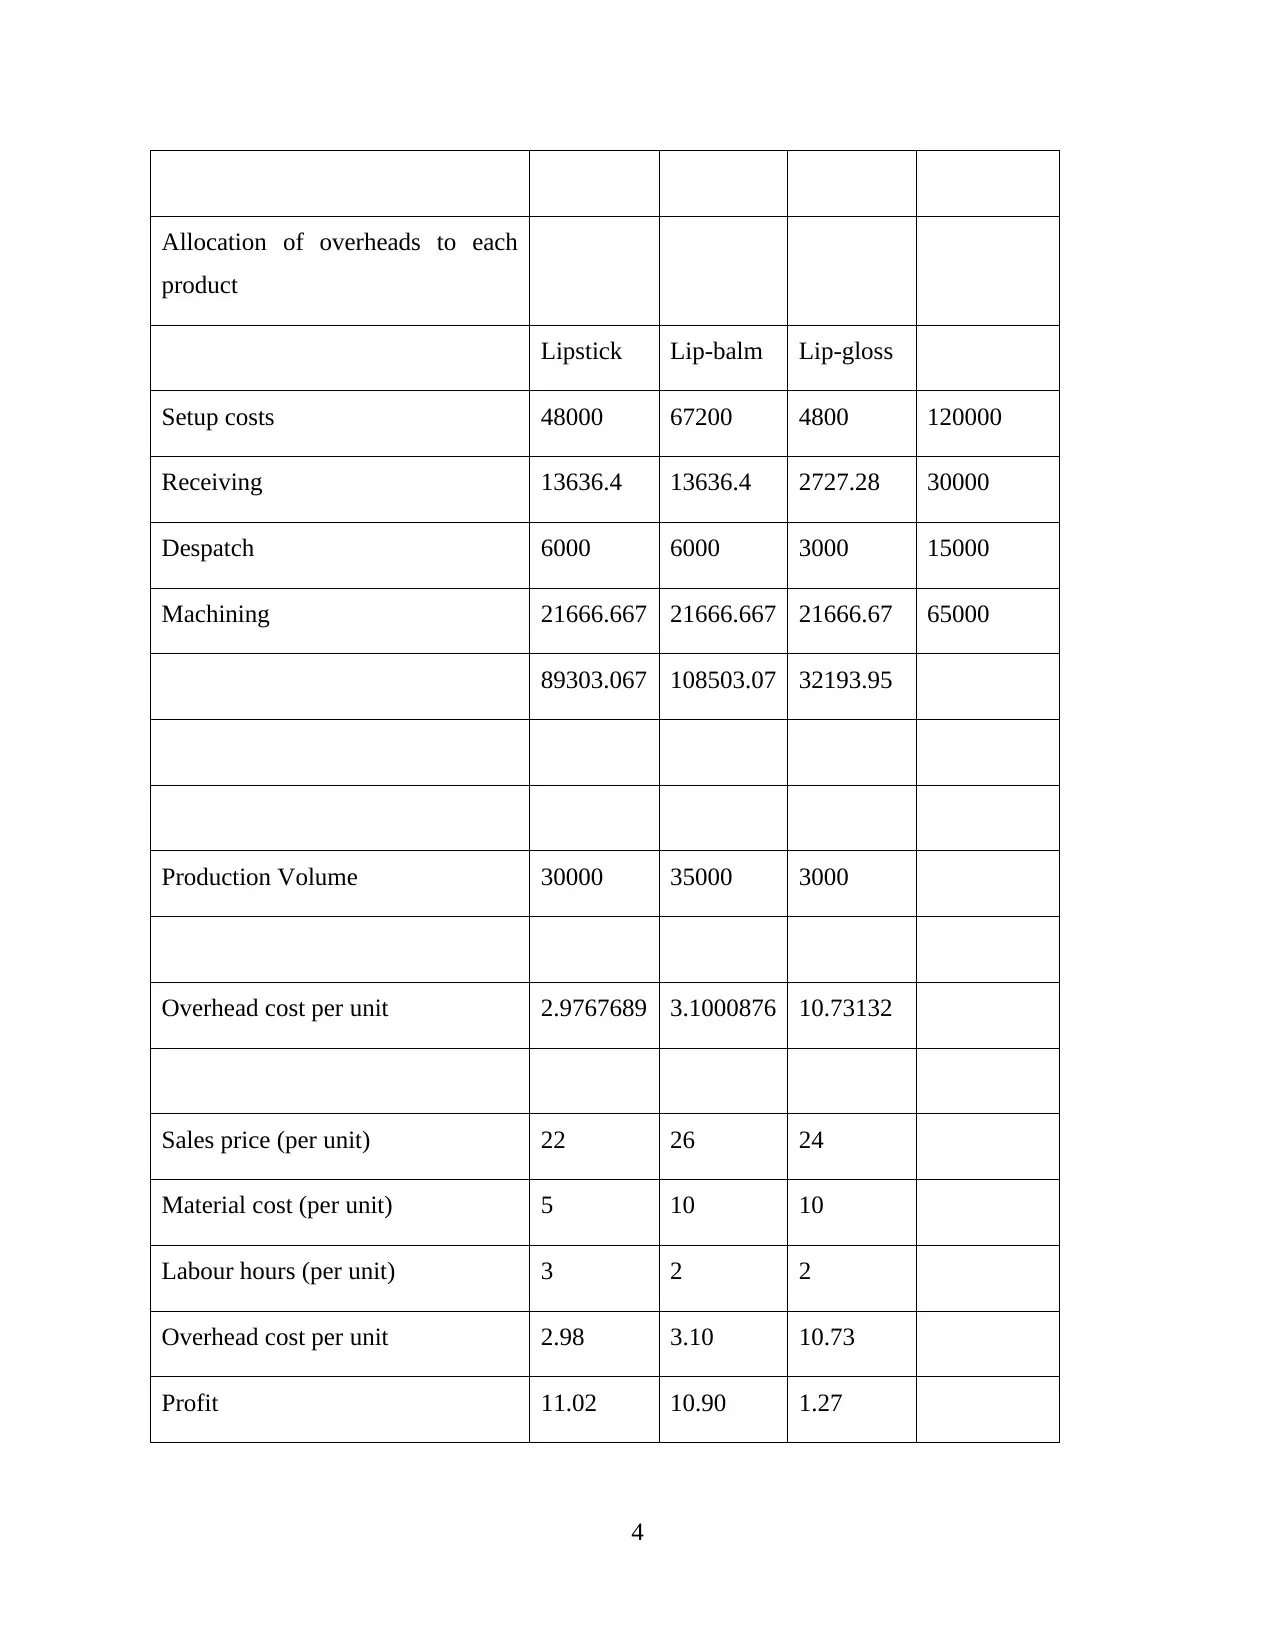
Allocation of overheads to each
product
Lipstick Lip-balm Lip-gloss
Setup costs 48000 67200 4800 120000
Receiving 13636.4 13636.4 2727.28 30000
Despatch 6000 6000 3000 15000
Machining 21666.667 21666.667 21666.67 65000
89303.067 108503.07 32193.95
Production Volume 30000 35000 3000
Overhead cost per unit 2.9767689 3.1000876 10.73132
Sales price (per unit) 22 26 24
Material cost (per unit) 5 10 10
Labour hours (per unit) 3 2 2
Overhead cost per unit 2.98 3.10 10.73
Profit 11.02 10.90 1.27
4
⊘ This is a preview!⊘
Do you want full access?
Subscribe today to unlock all pages.
Trusted by 1+ million students worldwide
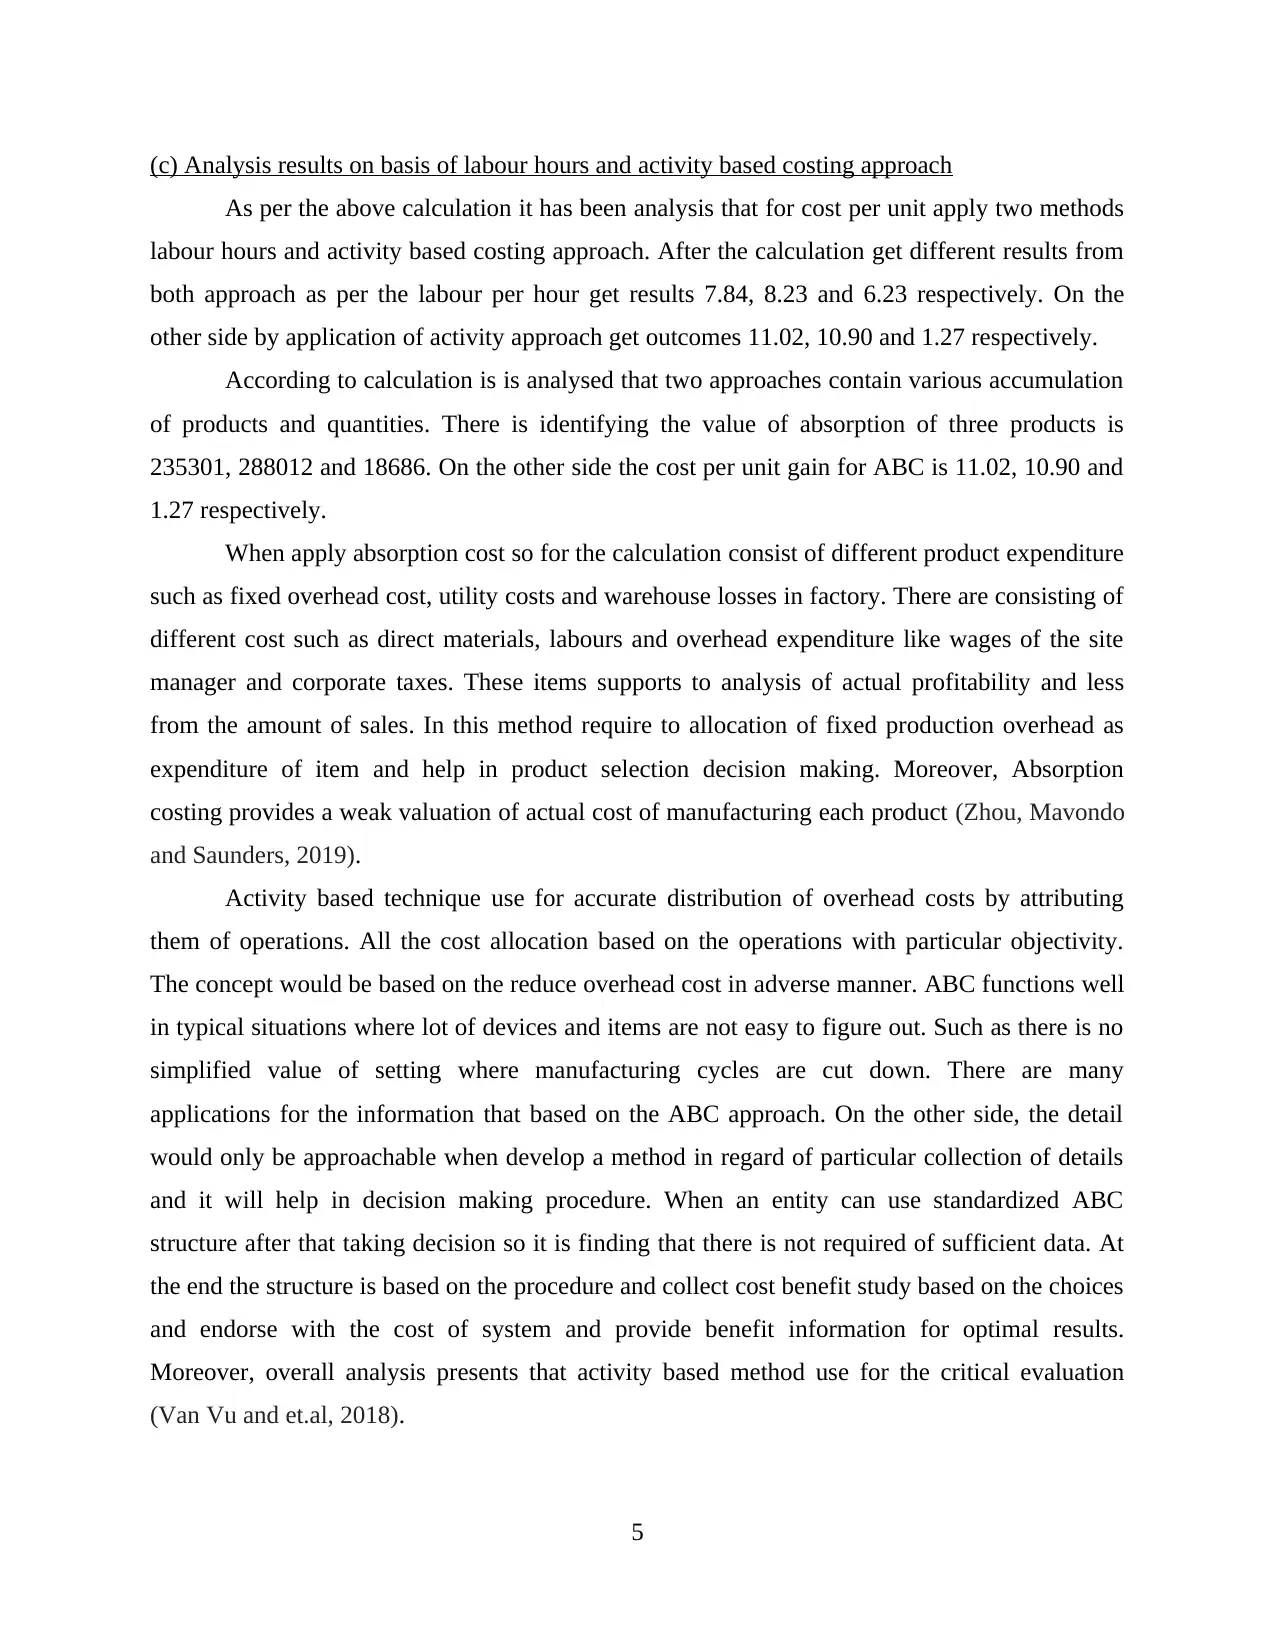
(c) Analysis results on basis of labour hours and activity based costing approach
As per the above calculation it has been analysis that for cost per unit apply two methods
labour hours and activity based costing approach. After the calculation get different results from
both approach as per the labour per hour get results 7.84, 8.23 and 6.23 respectively. On the
other side by application of activity approach get outcomes 11.02, 10.90 and 1.27 respectively.
According to calculation is is analysed that two approaches contain various accumulation
of products and quantities. There is identifying the value of absorption of three products is
235301, 288012 and 18686. On the other side the cost per unit gain for ABC is 11.02, 10.90 and
1.27 respectively.
When apply absorption cost so for the calculation consist of different product expenditure
such as fixed overhead cost, utility costs and warehouse losses in factory. There are consisting of
different cost such as direct materials, labours and overhead expenditure like wages of the site
manager and corporate taxes. These items supports to analysis of actual profitability and less
from the amount of sales. In this method require to allocation of fixed production overhead as
expenditure of item and help in product selection decision making. Moreover, Absorption
costing provides a weak valuation of actual cost of manufacturing each product (Zhou, Mavondo
and Saunders, 2019).
Activity based technique use for accurate distribution of overhead costs by attributing
them of operations. All the cost allocation based on the operations with particular objectivity.
The concept would be based on the reduce overhead cost in adverse manner. ABC functions well
in typical situations where lot of devices and items are not easy to figure out. Such as there is no
simplified value of setting where manufacturing cycles are cut down. There are many
applications for the information that based on the ABC approach. On the other side, the detail
would only be approachable when develop a method in regard of particular collection of details
and it will help in decision making procedure. When an entity can use standardized ABC
structure after that taking decision so it is finding that there is not required of sufficient data. At
the end the structure is based on the procedure and collect cost benefit study based on the choices
and endorse with the cost of system and provide benefit information for optimal results.
Moreover, overall analysis presents that activity based method use for the critical evaluation
(Van Vu and et.al, 2018).
5
Paraphrase This Document
Need a fresh take? Get an instant paraphrase of this document with our AI Paraphraser
(d) Sensitivity analysis help managers to cope with uncertainties
Sensitivity analysis is a model of outcomes to shift input details and forecast of potential
cash flows that mainly depend on the future activities, revenues, behaviours, payments. The flow
in particular calculations will impact on the importance on the predication. Some input data can
be deducted on the basis of research and conduct more data collection as well as analysis. Before
spending amount and time to collect extra data for the development and estimate system
performance for the reduction in the uncertainty and it is related with the outcomes when all data
and model uncertainties could be deducted if not necessitate. This analysis define about the
different independent variables that impact on single factor activities. For the analysis require a
prepare a strategy that use for target parameters are impacted on the outer expression
modification known as input consideration (Jaskyte, 2020).
The particular model is categorised into mathematical model and a manner of analysing
results that depend on the parameters number. This analytical method analysis on basis of
various variables that impact on the outcomes through developing a series of variables. The
observer investigate about the major modification and output signal impact on the objective.
Sensitivity can be analysed the values of shares of public organisations and consist of
market profits, portfolio figures, number of competing competitors on the sector and various
variables impacts on the equity prices. There are study about the assets values can be refined by
selecting different assumptions and adding more multiple parameters. The evaluation helps to
management to determine the different elements that will impact on the outcomes as reduction in
cost of investment. As a result it will impact on the net profitability and analysis to put up with
risks carry out in new business entity after conducting sensitivity analysis. It is a way of analysis
circumstances that different from the centre anticipate. It is intended to observing of degree of
risks of the activity that enable to analysis the results that based on the consistency of inputs
(Wang, Akbar and Akbar, 2020).
QUESTION 2
(a) Calculation of variances
(i) the material usage variance for each ingredient and in total
Should use
(KG)
Did use
(KG)
Difference(KG
)
Standard
cost/kg
Variance($)
6
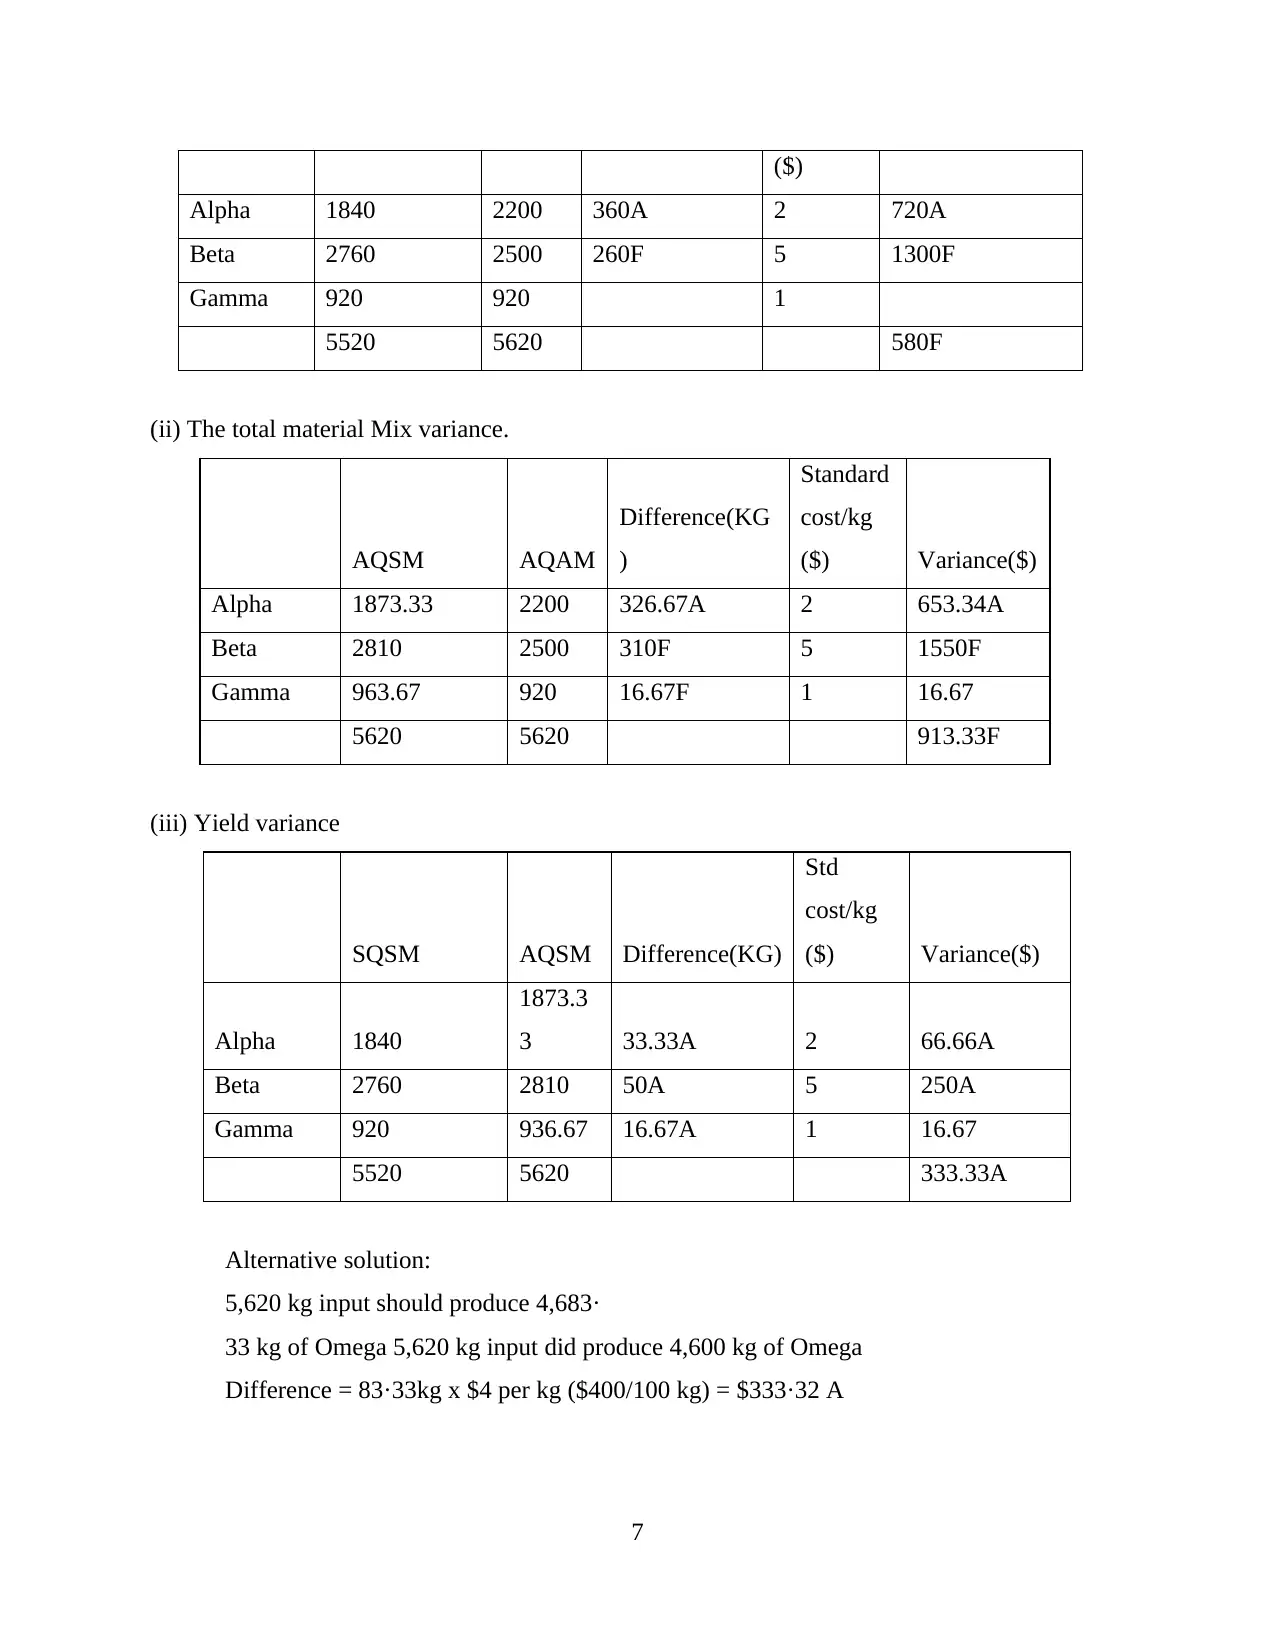
($)
Alpha 1840 2200 360A 2 720A
Beta 2760 2500 260F 5 1300F
Gamma 920 920 1
5520 5620 580F
(ii) The total material Mix variance.
AQSM AQAM
Difference(KG
)
Standard
cost/kg
($) Variance($)
Alpha 1873.33 2200 326.67A 2 653.34A
Beta 2810 2500 310F 5 1550F
Gamma 963.67 920 16.67F 1 16.67
5620 5620 913.33F
(iii) Yield variance
SQSM AQSM Difference(KG)
Std
cost/kg
($) Variance($)
Alpha 1840
1873.3
3 33.33A 2 66.66A
Beta 2760 2810 50A 5 250A
Gamma 920 936.67 16.67A 1 16.67
5520 5620 333.33A
Alternative solution:
5,620 kg input should produce 4,683·
33 kg of Omega 5,620 kg input did produce 4,600 kg of Omega
Difference = 83·33kg x $4 per kg ($400/100 kg) = $333·32 A
7
⊘ This is a preview!⊘
Do you want full access?
Subscribe today to unlock all pages.
Trusted by 1+ million students worldwide
(b) Problems with current system of calculating and reporting variances
As per the analysis it is defined that raw material variances outsider range of
manufacturing and for this mainly responsible purchase manager. Along with production
manager of the organisation is not consideration in regard of the daily blend. For the
administration is is require to analysis different variances but can not observing. It is required for
the planning variations as they can not analysis. Price levels and efficiency of three items is
being variable and the use of prices as per the necessities for mixing yield.
For the improvements in quality and prices of materials based on basic mixture and
substance has not increased in 5 years. It is becoming the reason of undertake control activity
that based on the different variances and set outdated standards. Since kappa company does not
currently have any reviews and comments due to less true images and become the reason of
success of manufacturing manager. Although Kappa co doesn't put and impact on different
variations to capable for the observing cost and becoming complacent (Mishra and Mohanty,
2018).
It is indicating that overall utilisation of variances stated that favourable variances are
$580 that presents effective efficiency of the business. Along with presents variation in more
depth means mixture and yielding measurement can be found as per the motivation of the shirt in
mix. There is presenting clear relation in between material mixture variation as well as yield
variation.
QUESTION 3
Critically discussed neither ZBB nor the IB provides the perfect toll for planning coordination
and control
Zero-based budgeting is a budget which starts from zero and this is not related to past
budget. The purpose of this budgeting is to calculate the actual expenses to be incurred in the
period. It helps the company to look on the present number not on the past number. It involves
the employees to make decision and improve the collaboration and communication in the
organisation. It helps the company to save money and generate profit for the period by evaluating
the unneeded expenses in the business which can be terminated.
On the other side, Incremental budgeting is the budget which is prepared from the current
budget as a base and add the increment amount in the new budget period. In this budget,
8
Paraphrase This Document
Need a fresh take? Get an instant paraphrase of this document with our AI Paraphraser
companies can terminate competitors or create the value of equal opportunities among the units
and same amount to enhance from the past year (Cherian and et.al, 2019).
Zero based budgeting do not consider the past year budget, it starts from zero and funds
assigned to each units are justified related to the expenses of that period whereas incremental
budgeting is prepared for the current year from taking the base of the previous year budget.
Zero-based budgeting prepared by assigning the highest funds to those business activities which
benefit the company. Zero-based budgeting is time consuming because this budget is starts from
zero and takes time to prepare the budget from current activities. Incremental budgeting takes
less time to prepare because current budget is computed from previous budget.
Zero based budgeting requires knowledge and skills to prepare the budget and in
incremental it is easy to prepare because it does not require training for preparing budget. Zero
based budgeting takes incurred cost to formulate the budget because it is prepared from starting
and incremental does not require any cost to formulate the budget. Zero based budgeting
decrease the possibility of threat and misconception in the activities because it evaluates the
budget from the base and in incremental does not apply much attention to the process in an
activity because it add or subtract from the past budget (Gao, Yang and Hafsi, 2019).
CONCLUSION
As per the above report it has been concluded that financial management performance is
a way in which manage and analysis the financial outcomes across an entity. The main reason of
the management to compare real values for budgets and estimate and make adjustments
accordingly. In this report analysis of material variances and labour variances on the basis of
different approach after that get different results effectively.
9

10
⊘ This is a preview!⊘
Do you want full access?
Subscribe today to unlock all pages.
Trusted by 1+ million students worldwide
1 out of 13
Related Documents


Your All-in-One AI-Powered Toolkit for Academic Success.
+13062052269
info@desklib.com
Available 24*7 on WhatsApp / Email
![[object Object]](/_next/static/media/star-bottom.7253800d.svg)
Unlock your academic potential
Copyright © 2020–2026 A2Z Services. All Rights Reserved. Developed and managed by ZUCOL.