Introduction to Accounting and Finance: Performance Analysis Report

Verified

Added on  2022/12/19

|23
|4739
|88
Report
AI Summary
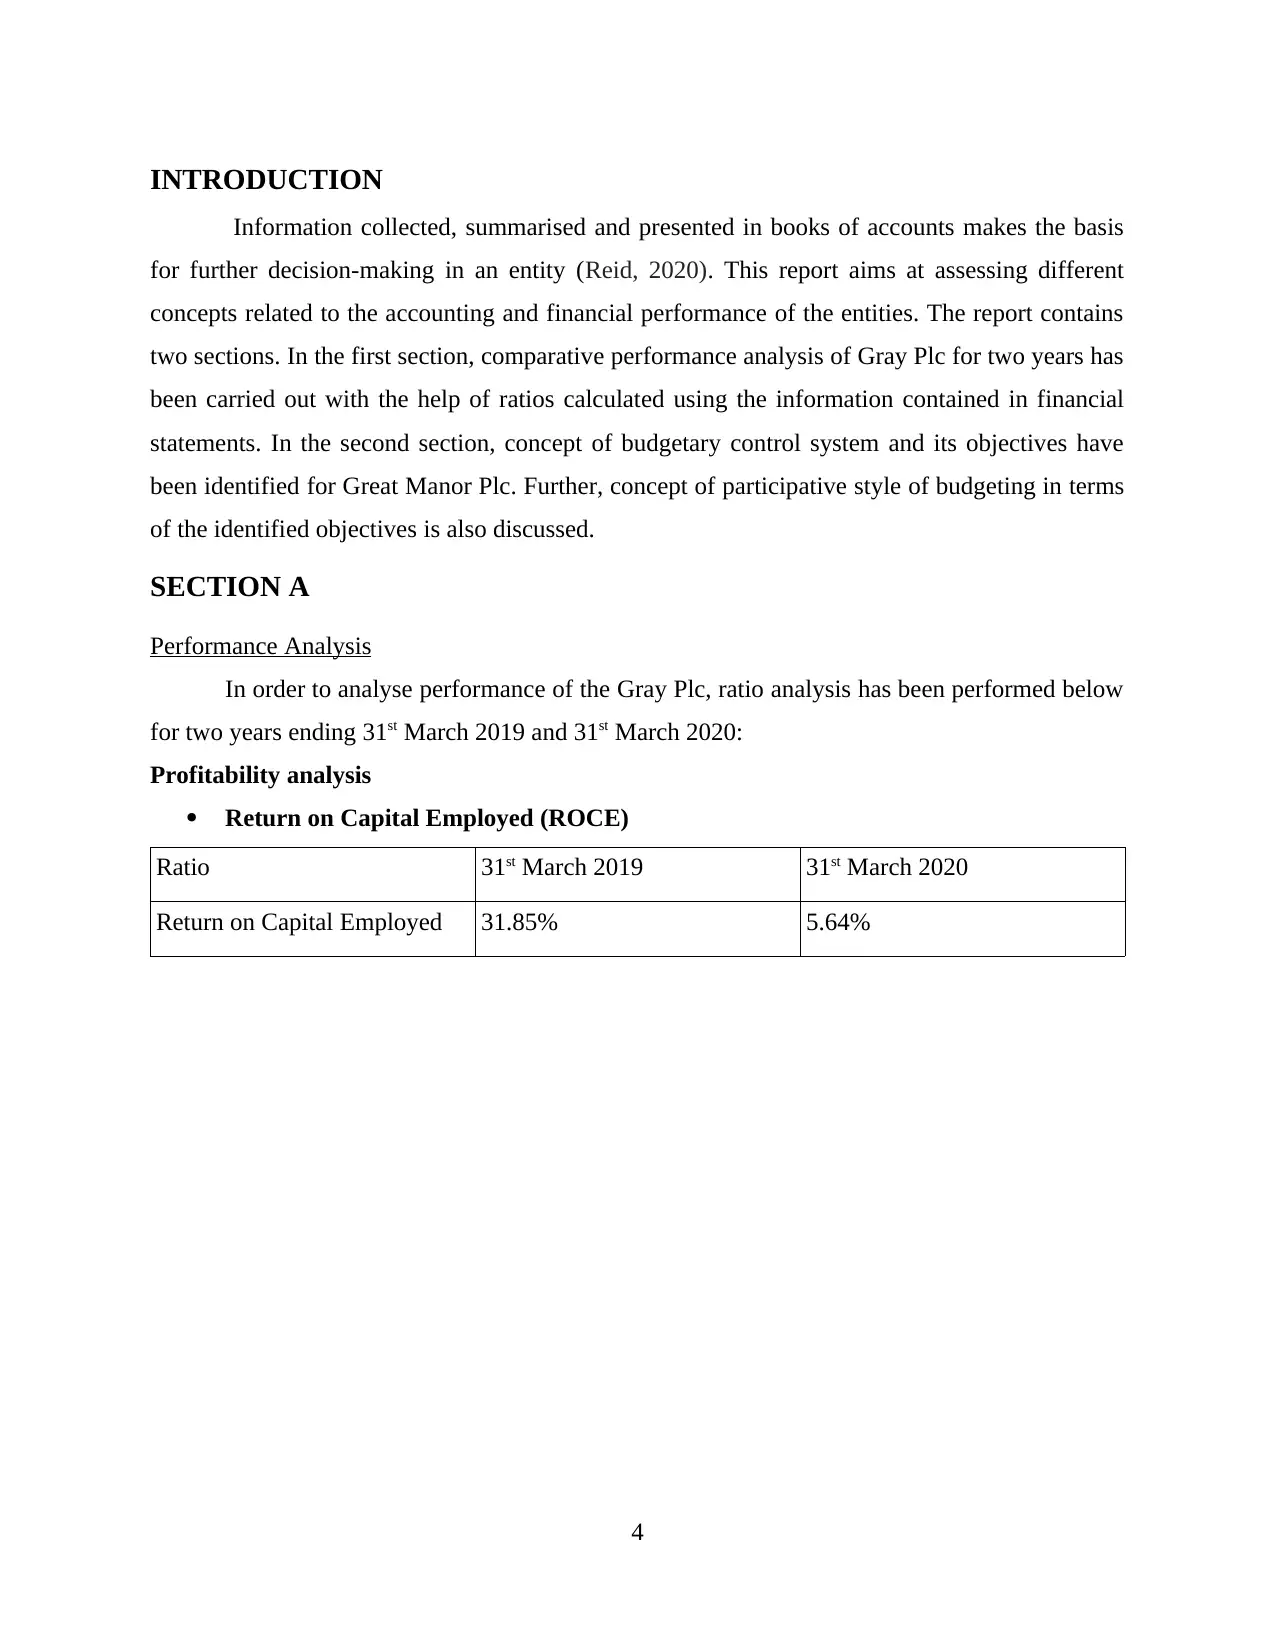
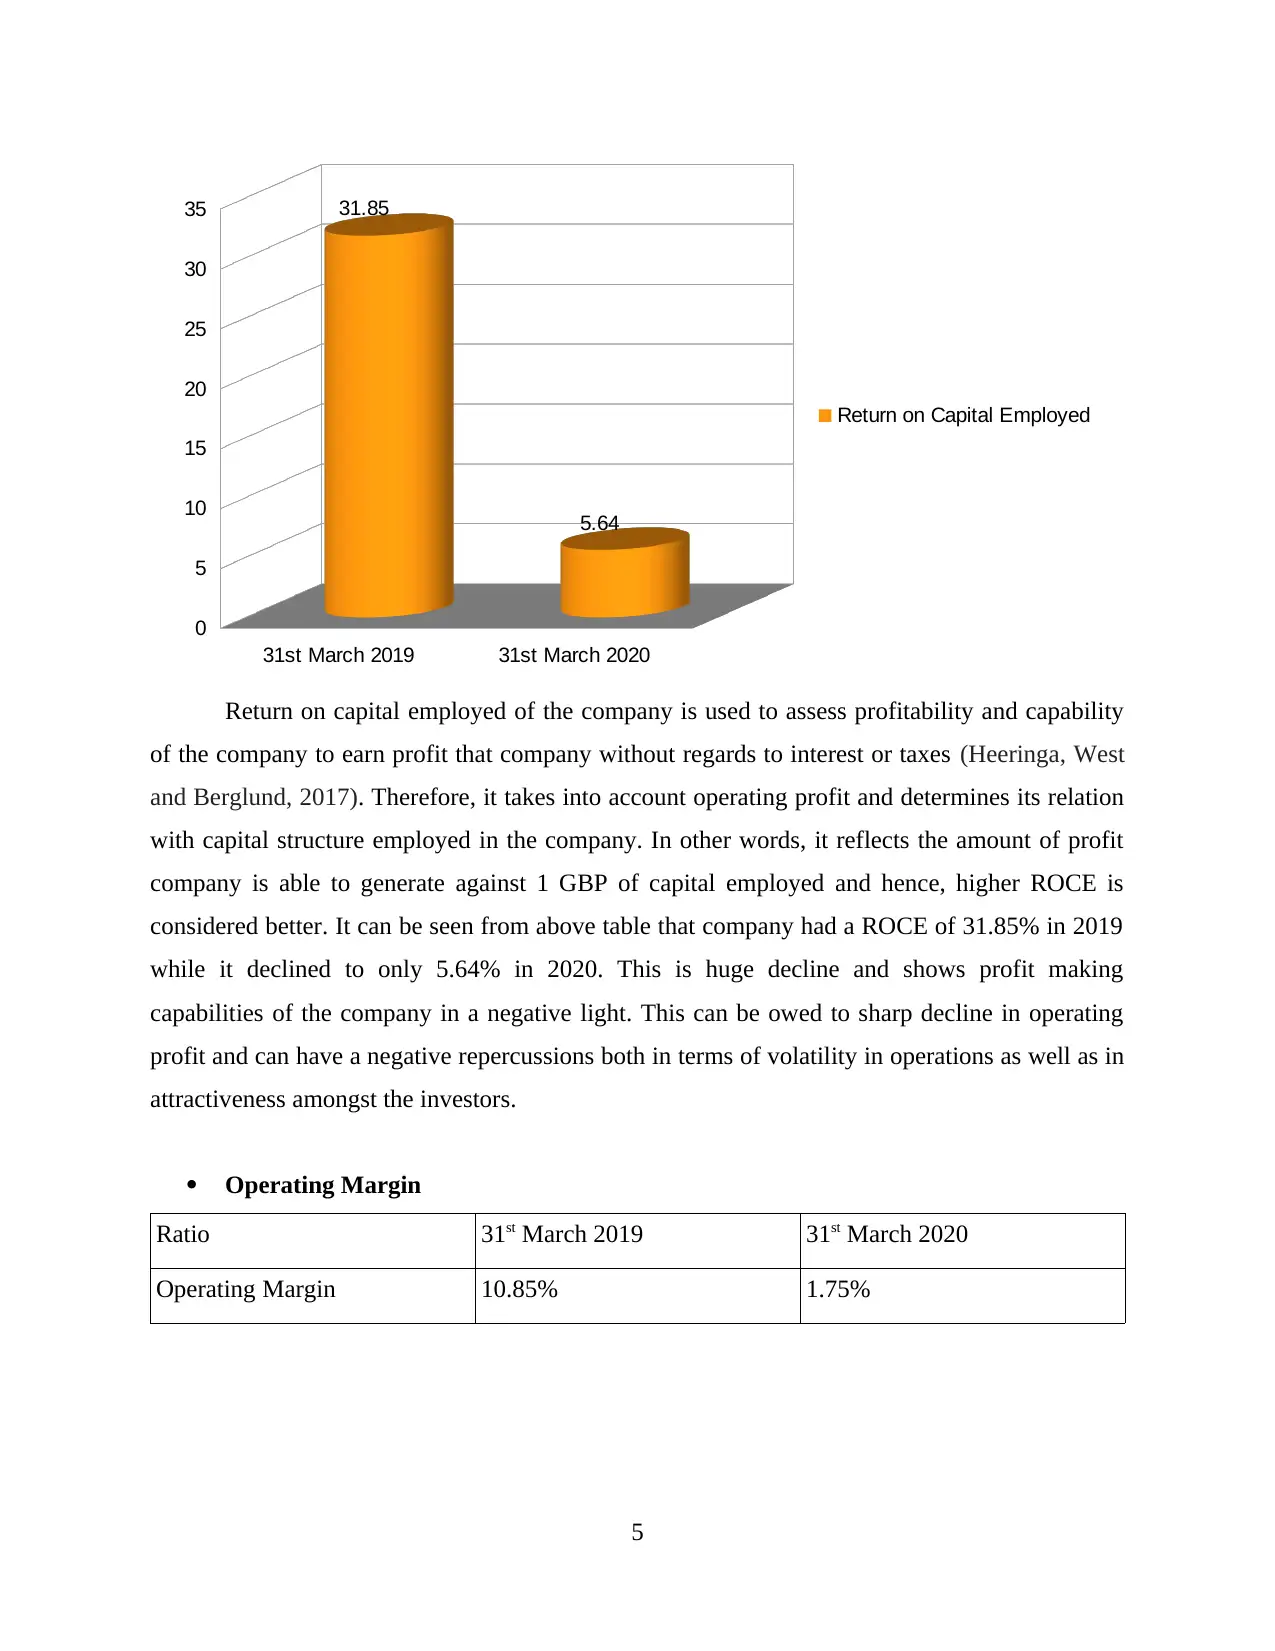
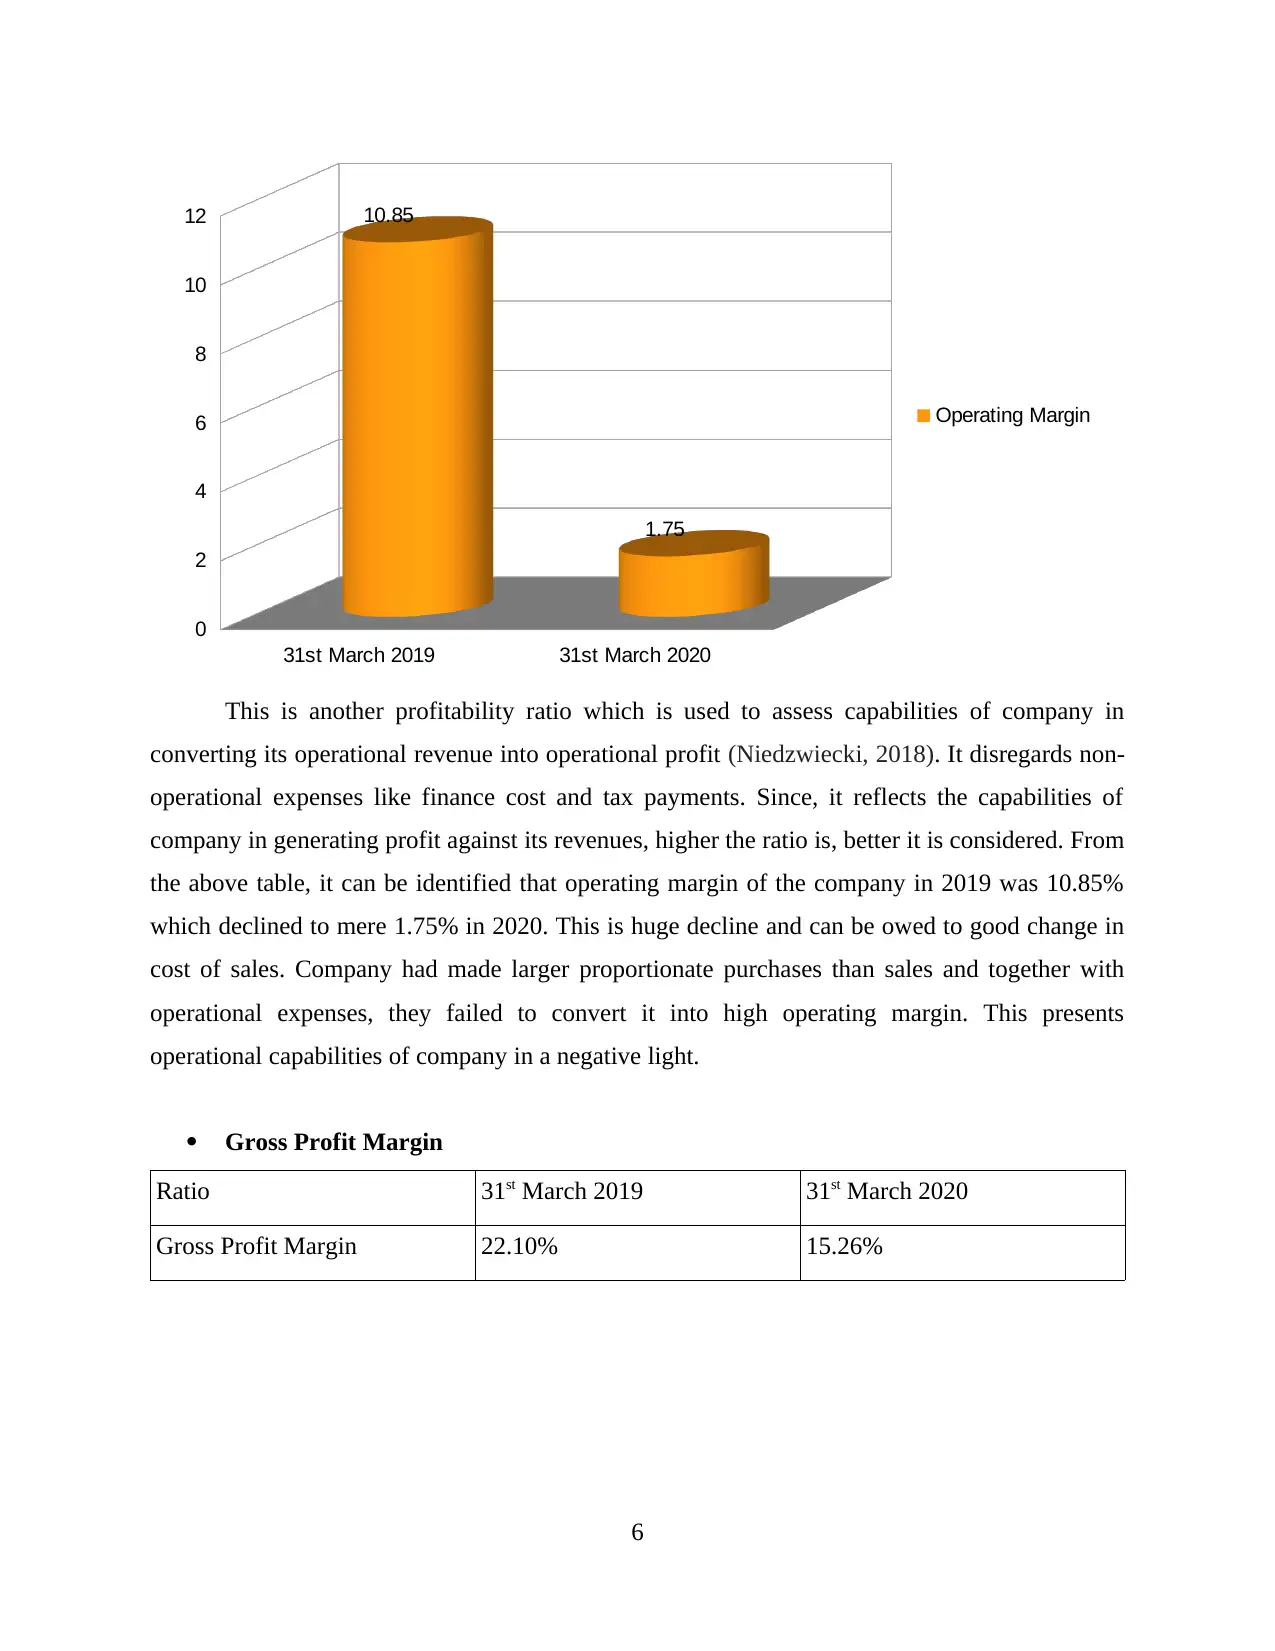
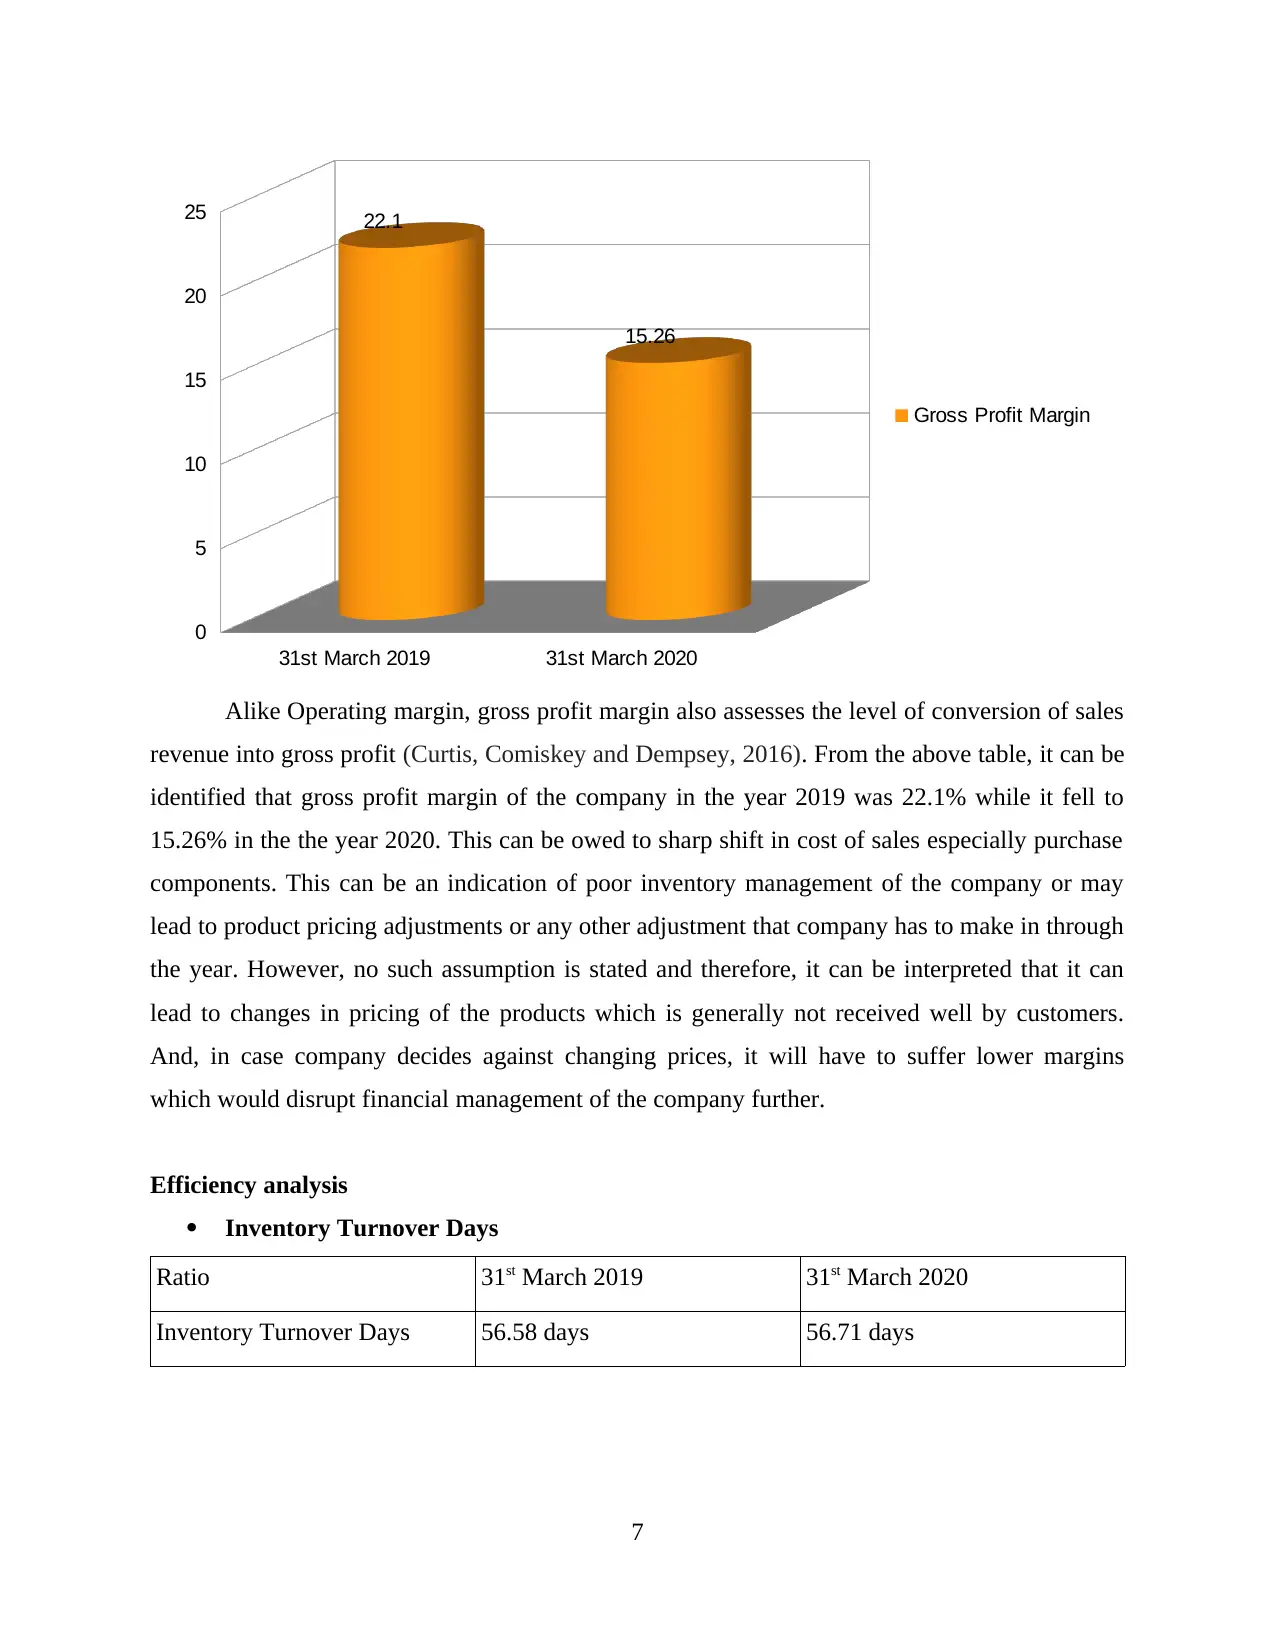
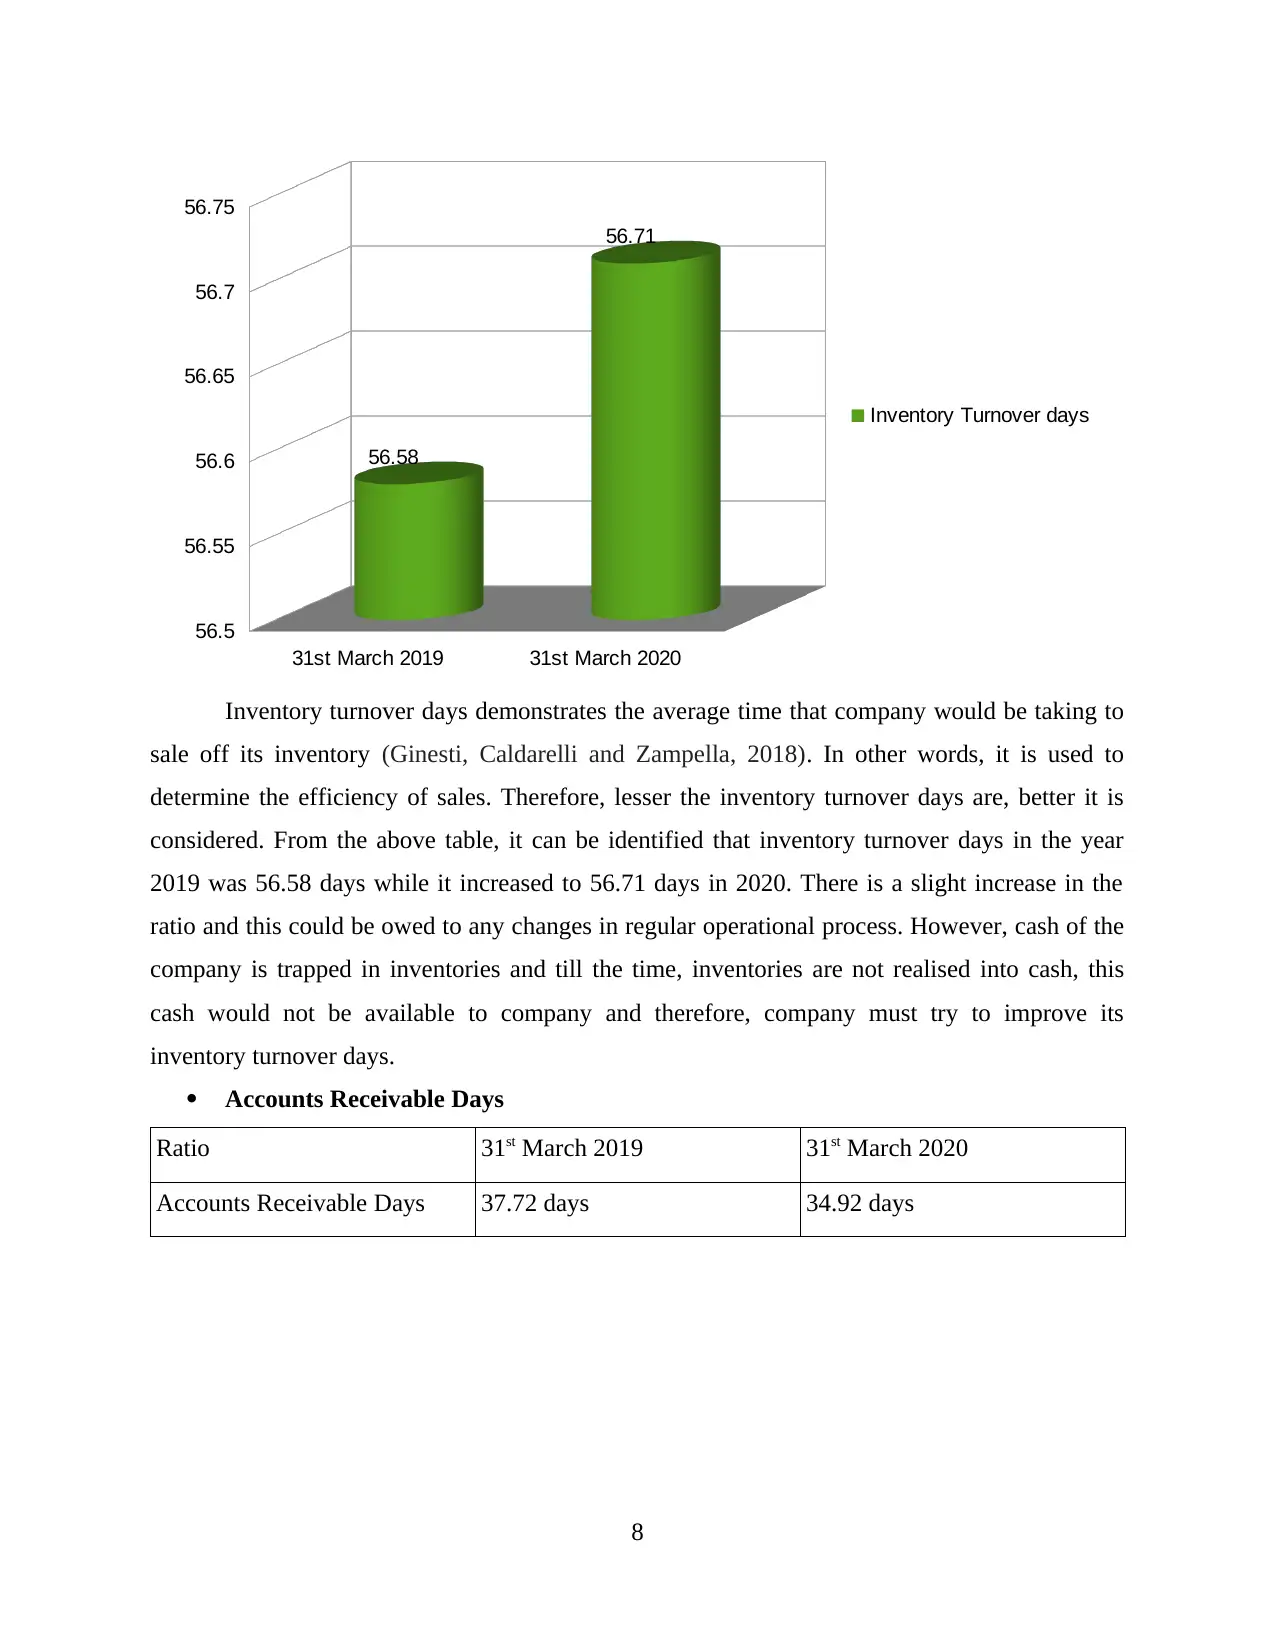
This report provides a comprehensive analysis of financial performance using ratio analysis, focusing on the financial statements of Gray Plc. It examines profitability, efficiency, liquidity, and investment abilities through various ratios, including ROCE, operating margin, gross profit margin, inventory turnover, accounts receivable and payable days, current and acid-test ratios, earnings per share, and price-earnings ratio. The report also includes a section on budgetary control systems, identifying their objectives and exploring the concept of participative budgeting in relation to these objectives for Great Manor Plc. The analysis covers the years 2019 and 2020, offering insights into the financial health and operational efficiency of the companies, and assessing the impact of changes in financial metrics. The report concludes by summarizing the key findings and implications of the financial analysis and budgetary control systems.
Document Page
Introduction to Accounting
& Finance
1
tabler-icon-diamond-filled.svg

Paraphrase This Document

Need a fresh take? Get an instant paraphrase of this document with our AI Paraphraser
Document Page
ABSTRACT
Accounting deals with the financial information of an entity to make an observation about its
financial performance and position. This information is further used for making informed
decision by both internal stakeholder like management of the entity and external stakeholders
like shareholders and investors. In the report below the assessment of different ratios is
conducted in order to learn about the on-going performance of the company. Along with it the
report also revolves around the concept of budgetary control system and examined it objectives
in relation with participative style of budgeting.
2
Document Page
Table of Contents
ABSTRACT.....................................................................................................................................2
INTRODUCTION...........................................................................................................................4
SECTION A.....................................................................................................................................4
Performance Analysis.................................................................................................................4
SECTION B...................................................................................................................................16
Budgetary Control System........................................................................................................16
Concept of participative style of budgeting..............................................................................18
CONCLUSION..............................................................................................................................19
REFERENCES..............................................................................................................................20
APPENDIX....................................................................................................................................21
Ratio Calculation.......................................................................................................................21
3
Document Page
INTRODUCTION
Information collected, summarised and presented in books of accounts makes the basis
for further decision-making in an entity (Reid, 2020). This report aims at assessing different
concepts related to the accounting and financial performance of the entities. The report contains
two sections. In the first section, comparative performance analysis of Gray Plc for two years has
been carried out with the help of ratios calculated using the information contained in financial
statements. In the second section, concept of budgetary control system and its objectives have
been identified for Great Manor Plc. Further, concept of participative style of budgeting in terms
of the identified objectives is also discussed.
SECTION A
Performance Analysis
In order to analyse performance of the Gray Plc, ratio analysis has been performed below
for two years ending 31st March 2019 and 31st March 2020:
Profitability analysis
Return on Capital Employed (ROCE)
Ratio 31st March 2019 31st March 2020
Return on Capital Employed 31.85% 5.64%
4
tabler-icon-diamond-filled.svg

Paraphrase This Document

Need a fresh take? Get an instant paraphrase of this document with our AI Paraphraser
Document Page
Return on capital employed of the company is used to assess profitability and capability
of the company to earn profit that company without regards to interest or taxes (Heeringa, West
and Berglund, 2017). Therefore, it takes into account operating profit and determines its relation
with capital structure employed in the company. In other words, it reflects the amount of profit
company is able to generate against 1 GBP of capital employed and hence, higher ROCE is
considered better. It can be seen from above table that company had a ROCE of 31.85% in 2019
while it declined to only 5.64% in 2020. This is huge decline and shows profit making
capabilities of the company in a negative light. This can be owed to sharp decline in operating
profit and can have a negative repercussions both in terms of volatility in operations as well as in
attractiveness amongst the investors.
Operating Margin
Ratio 31st March 2019 31st March 2020
Operating Margin 10.85% 1.75%
5
31st March 2019 31st March 2020
0
5
10
15
20
25
30
35 31.85
5.64
Return on Capital Employed
Document Page
This is another profitability ratio which is used to assess capabilities of company in
converting its operational revenue into operational profit (Niedzwiecki, 2018). It disregards non-
operational expenses like finance cost and tax payments. Since, it reflects the capabilities of
company in generating profit against its revenues, higher the ratio is, better it is considered. From
the above table, it can be identified that operating margin of the company in 2019 was 10.85%
which declined to mere 1.75% in 2020. This is huge decline and can be owed to good change in
cost of sales. Company had made larger proportionate purchases than sales and together with
operational expenses, they failed to convert it into high operating margin. This presents
operational capabilities of company in a negative light.
Gross Profit Margin
Ratio 31st March 2019 31st March 2020
Gross Profit Margin 22.10% 15.26%
6
31st March 2019 31st March 2020
0
2
4
6
8
10
12 10.85
1.75
Operating Margin
Document Page
Alike Operating margin, gross profit margin also assesses the level of conversion of sales
revenue into gross profit (Curtis, Comiskey and Dempsey, 2016). From the above table, it can be
identified that gross profit margin of the company in the year 2019 was 22.1% while it fell to
15.26% in the the year 2020. This can be owed to sharp shift in cost of sales especially purchase
components. This can be an indication of poor inventory management of the company or may
lead to product pricing adjustments or any other adjustment that company has to make in through
the year. However, no such assumption is stated and therefore, it can be interpreted that it can
lead to changes in pricing of the products which is generally not received well by customers.
And, in case company decides against changing prices, it will have to suffer lower margins
which would disrupt financial management of the company further.
Efficiency analysis
Inventory Turnover Days
Ratio 31st March 2019 31st March 2020
Inventory Turnover Days 56.58 days 56.71 days
7
31st March 2019 31st March 2020
0
5
10
15
20
25 22.1
15.26
Gross Profit Margin
tabler-icon-diamond-filled.svg

Paraphrase This Document

Need a fresh take? Get an instant paraphrase of this document with our AI Paraphraser
Document Page
Inventory turnover days demonstrates the average time that company would be taking to
sale off its inventory (Ginesti, Caldarelli and Zampella, 2018). In other words, it is used to
determine the efficiency of sales. Therefore, lesser the inventory turnover days are, better it is
considered. From the above table, it can be identified that inventory turnover days in the year
2019 was 56.58 days while it increased to 56.71 days in 2020. There is a slight increase in the
ratio and this could be owed to any changes in regular operational process. However, cash of the
company is trapped in inventories and till the time, inventories are not realised into cash, this
cash would not be available to company and therefore, company must try to improve its
inventory turnover days.
Accounts Receivable Days
Ratio 31st March 2019 31st March 2020
Accounts Receivable Days 37.72 days 34.92 days
8
31st March 2019 31st March 2020
56.5
56.55
56.6
56.65
56.7
56.75
56.58
56.71
Inventory Turnover days
Document Page
Accounts receivable days demonstrates the average time that company would be taking to
collect payment from its trade debtors (Lamon, 2020). It is a part of the cash conversion cycle of
the company. Shorter the time debtors would take to make payment, better would be the position
of the company. Therefore, lesser the accounts receivable days are, better it is considered. From
the above table, it can be identified that accounts receivable days in the year 2019 was 37.72
days while it improved to 34.92 days in 2020. This shows improvement in the performance of
the company in collecting cash from its debtors. This is a positive sign for the cash conversion
cycle of the company and needs to be maintained such performance steadily.
Accounts Payable Days
Ratio 31st March 2019 31st March 2020
Accounts Payable Days 46.44 days 49.40 days
9
31st March 2019 31st March 2020
33.5
34
34.5
35
35.5
36
36.5
37
37.5
38 37.72
34.92
Accounts Receivable days
Document Page
Accounts payable days demonstrates the average time that company would be taking to
pay off its trade creditors. It is a part of the cash conversion cycle of the company (Tian and Yu,
2017). Longer the time company can hold payments of creditors within business, better would be
the position of the company. Therefore, higher the accounts payable days are, better it is
considered. From the above table, it can be identified that accounts payable days in the year 2019
were 46.44 days while it improved to further 49.40 days in 2020. This shows improvement in the
performance of the company in retaining cash within business. However, it is important that
company maintains such performance and has achieved this improvement with revised
negotiations with creditors so that they can be admitted into the system.
Liquidity analysis
Current Ratio
Ratio 31st March 2019 31st March 2020
Current Ratio 1.86 : 1 1.57 : 1
10
31st March 2019 31st March 2020
44.5
45
45.5
46
46.5
47
47.5
48
48.5
49
49.5
46.44
49.4
Accounts Payable Days
tabler-icon-diamond-filled.svg

Paraphrase This Document

Need a fresh take? Get an instant paraphrase of this document with our AI Paraphraser
Document Page
Current Ratio of a company helps determine its short term liquidity i.e. it assesses the
capabilities of current assets of company to finance its current liabilities (Kruis, Speklé and
Widener, 2016). Current ratio of 2:1 is considered as ideal as it reflects a comfortable position
that company has twice current assets than its current liabilities to finance. From the above table,
it can be analysed that company had a current ratio of 1.86 in 2019 and 1.57 in 2020. In absolute
terms, company does not have bad current ratio however, in comparative terms, its performance
has negatively slid. This can be owed to greater change in current liabilities than current assets
and can lead to disruptions in the working capital management of the company.
Acid Test Ratio
Ratio 31st March 2019 31st March 2020
Acid Test Ratio 0.84 : 1 0.63 : 1
11
31st March 2019 31st March 2020
1.4
1.45
1.5
1.55
1.6
1.65
1.7
1.75
1.8
1.85
1.9 1.86
1.57
Current Ratio
Document Page
Acid Test Ratio of a company also helps in determining short term liquidity of the
company i.e. it assesses the capabilities of quick assets of company to finance its current
liabilities (Jones, 2017). It is also known as quick ratio. Quick assets refers to those current assets
which can be converted to cash very quickly. Therefore, inventories are reduced from current
assets to arrive at figure of quick assets. Acid Test ratio of 1:1 is considered as ideal as it reflects
a comfortable position that company has sufficient quick assets that it can convert into cash to
finance its current liabilities. From the above table, it can be analysed that company had a current
ratio of 0.84 in 2019 and 0.63 in 2020. In absolute terms, company does not have bad quick ratio
however, in comparative terms, its performance has negatively slid. This can be owed to greater
change in current liabilities than quick assets and can lead to disruptions in the working capital
management of the company.
Investment ability analysis
Earnings per share
Ratio 31st March 2019 31st March 2020
Earnings per share 0.28 0.02
12
31st March 2019 31st March 2020
0
0.1
0.2
0.3
0.4
0.5
0.6
0.7
0.8
0.9 0.84
0.63
Acid-Test Ratio
chevron_up_icon
1 out of 23
circle_padding
hide_on_mobile
zoom_out_icon
[object Object]