Managerial Finance Report: Ratio Analysis of Tesco & Sainsbury
VerifiedAdded on 2022/12/29
|18
|3418
|69
Report
AI Summary
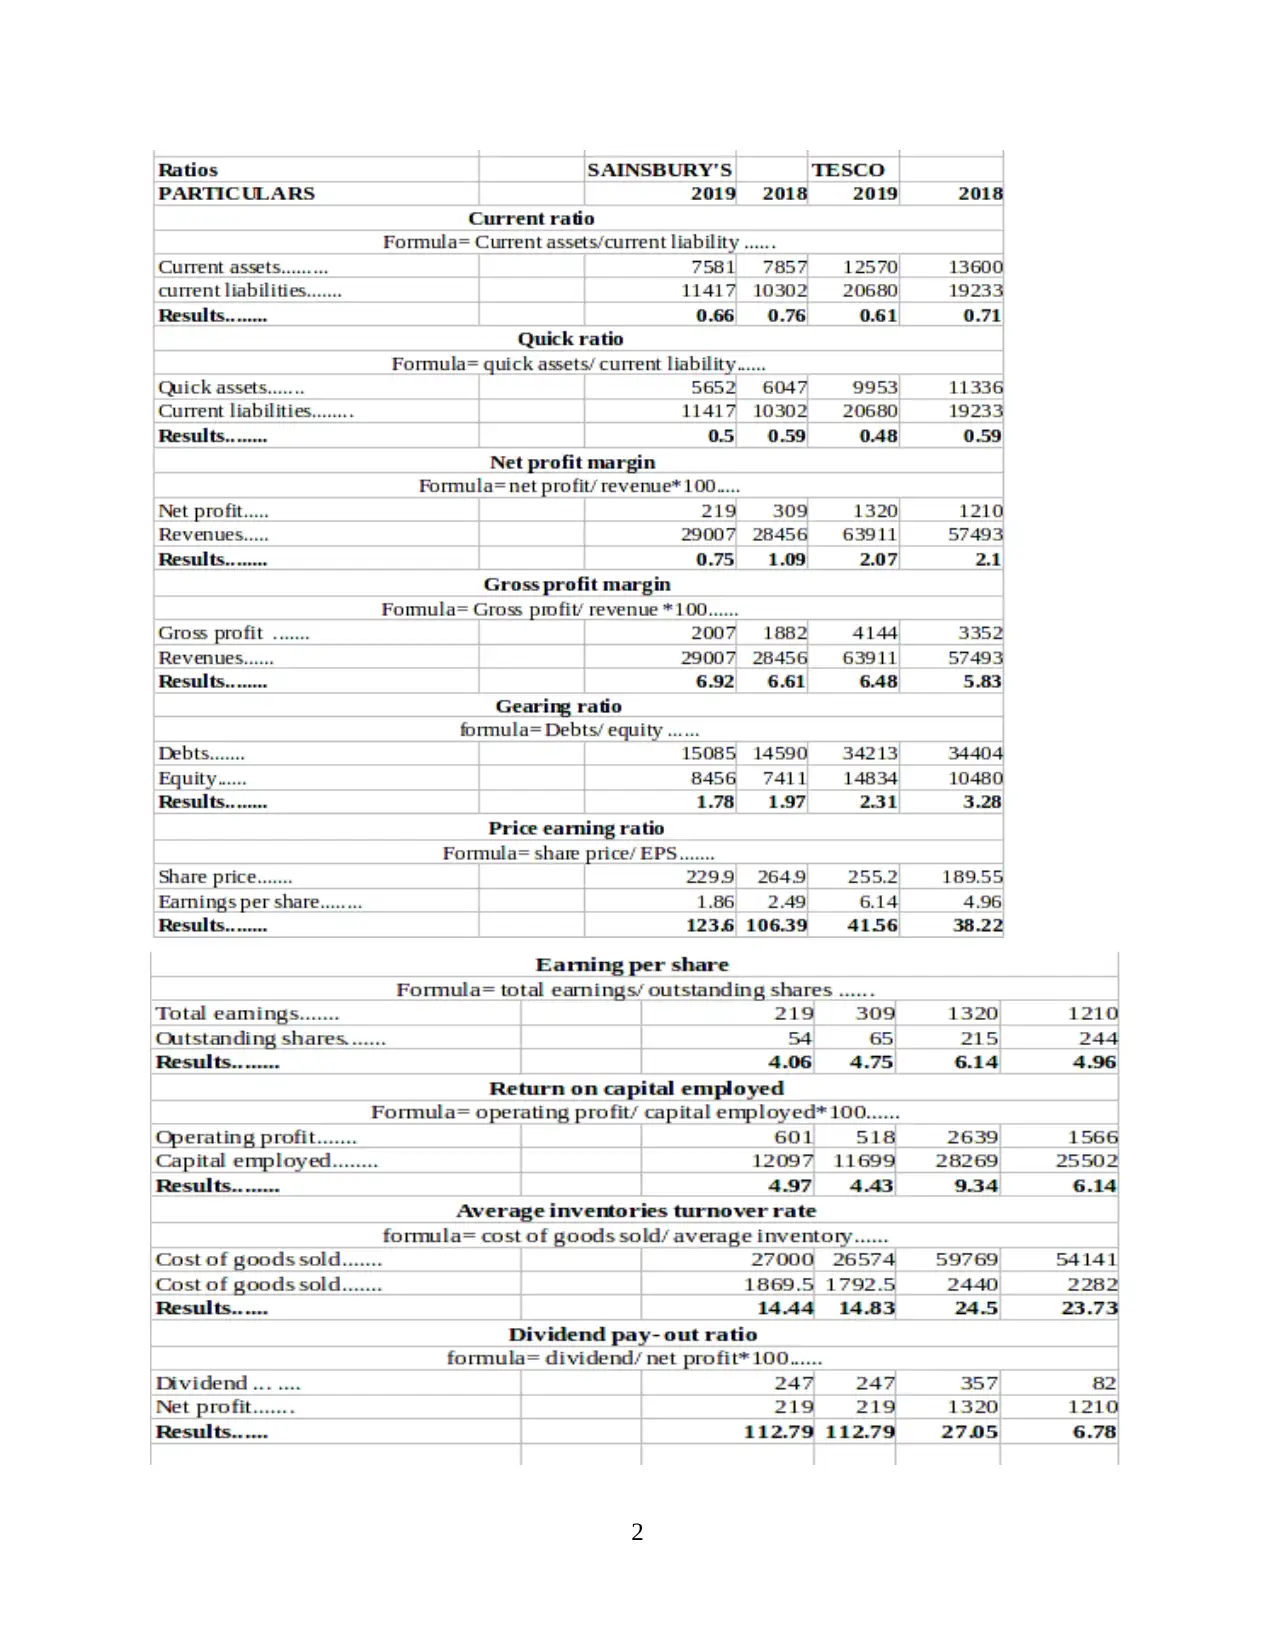
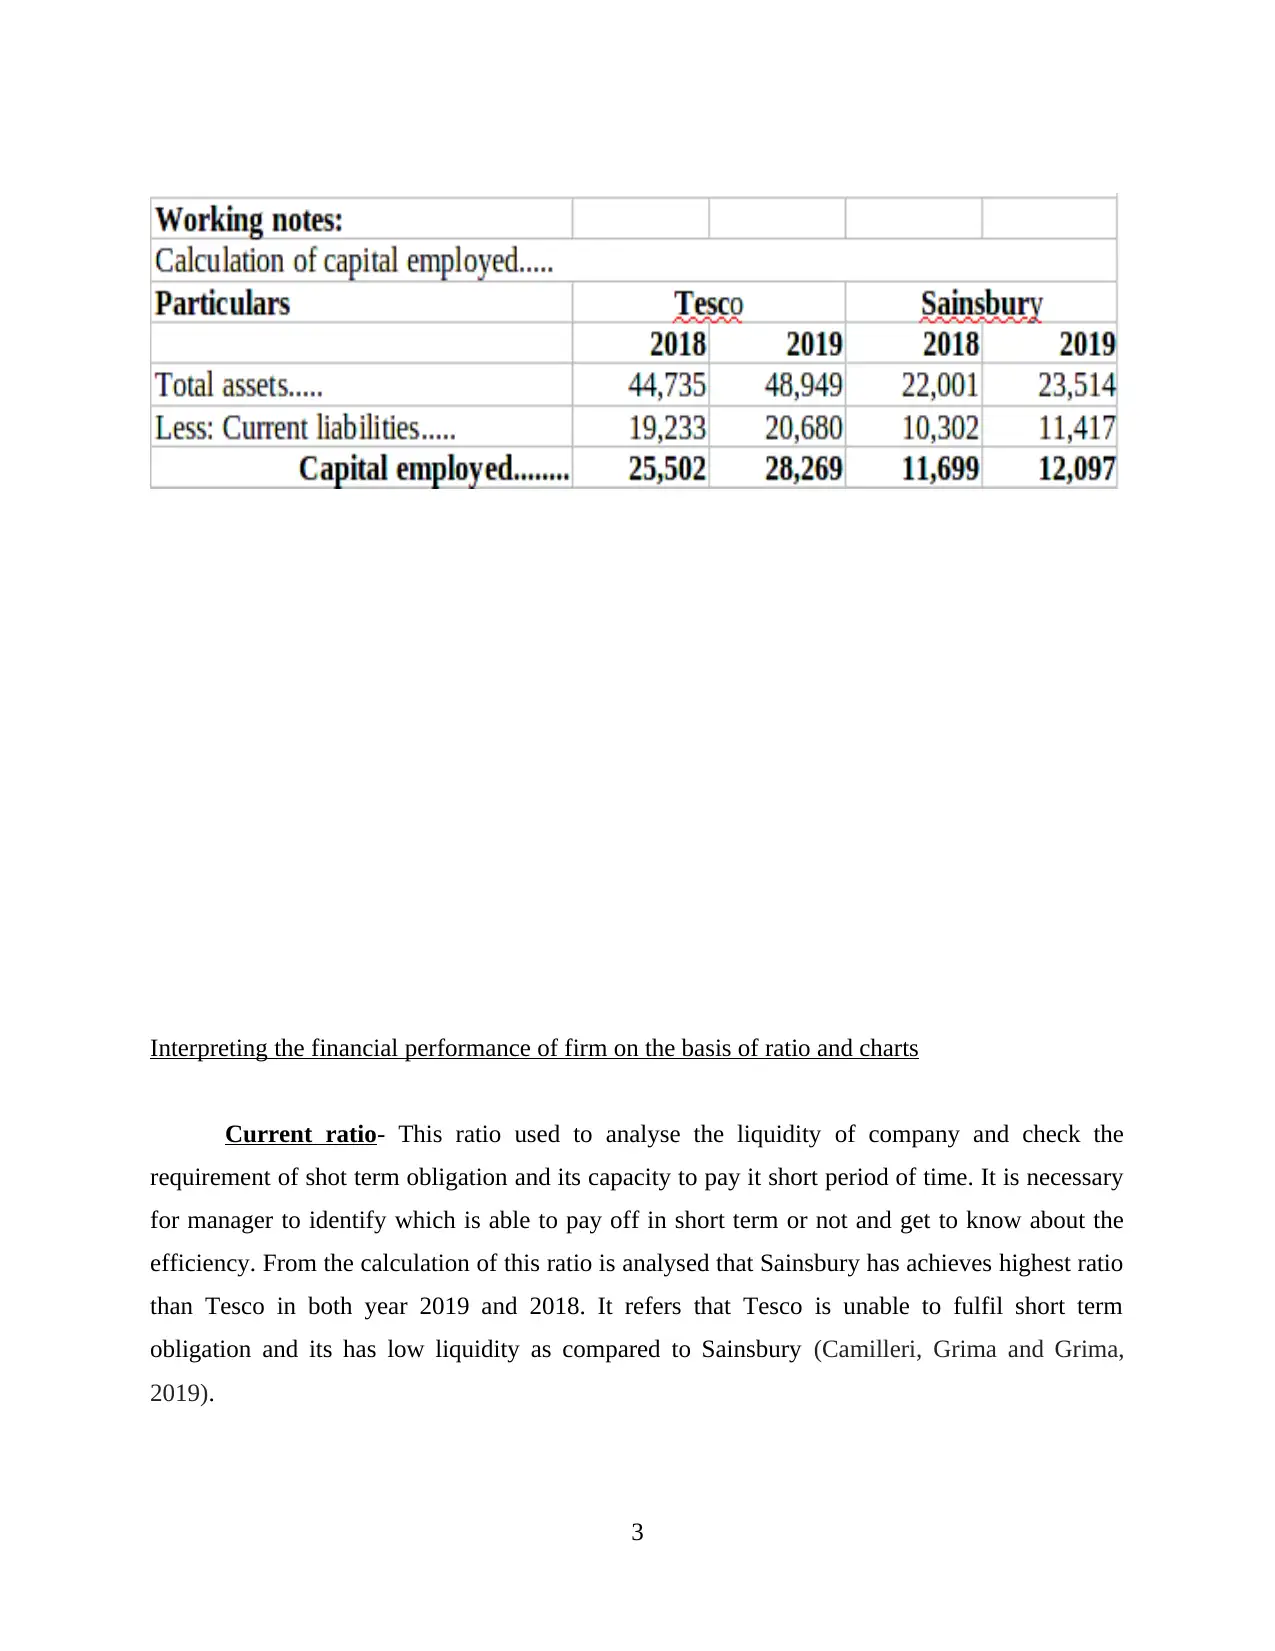
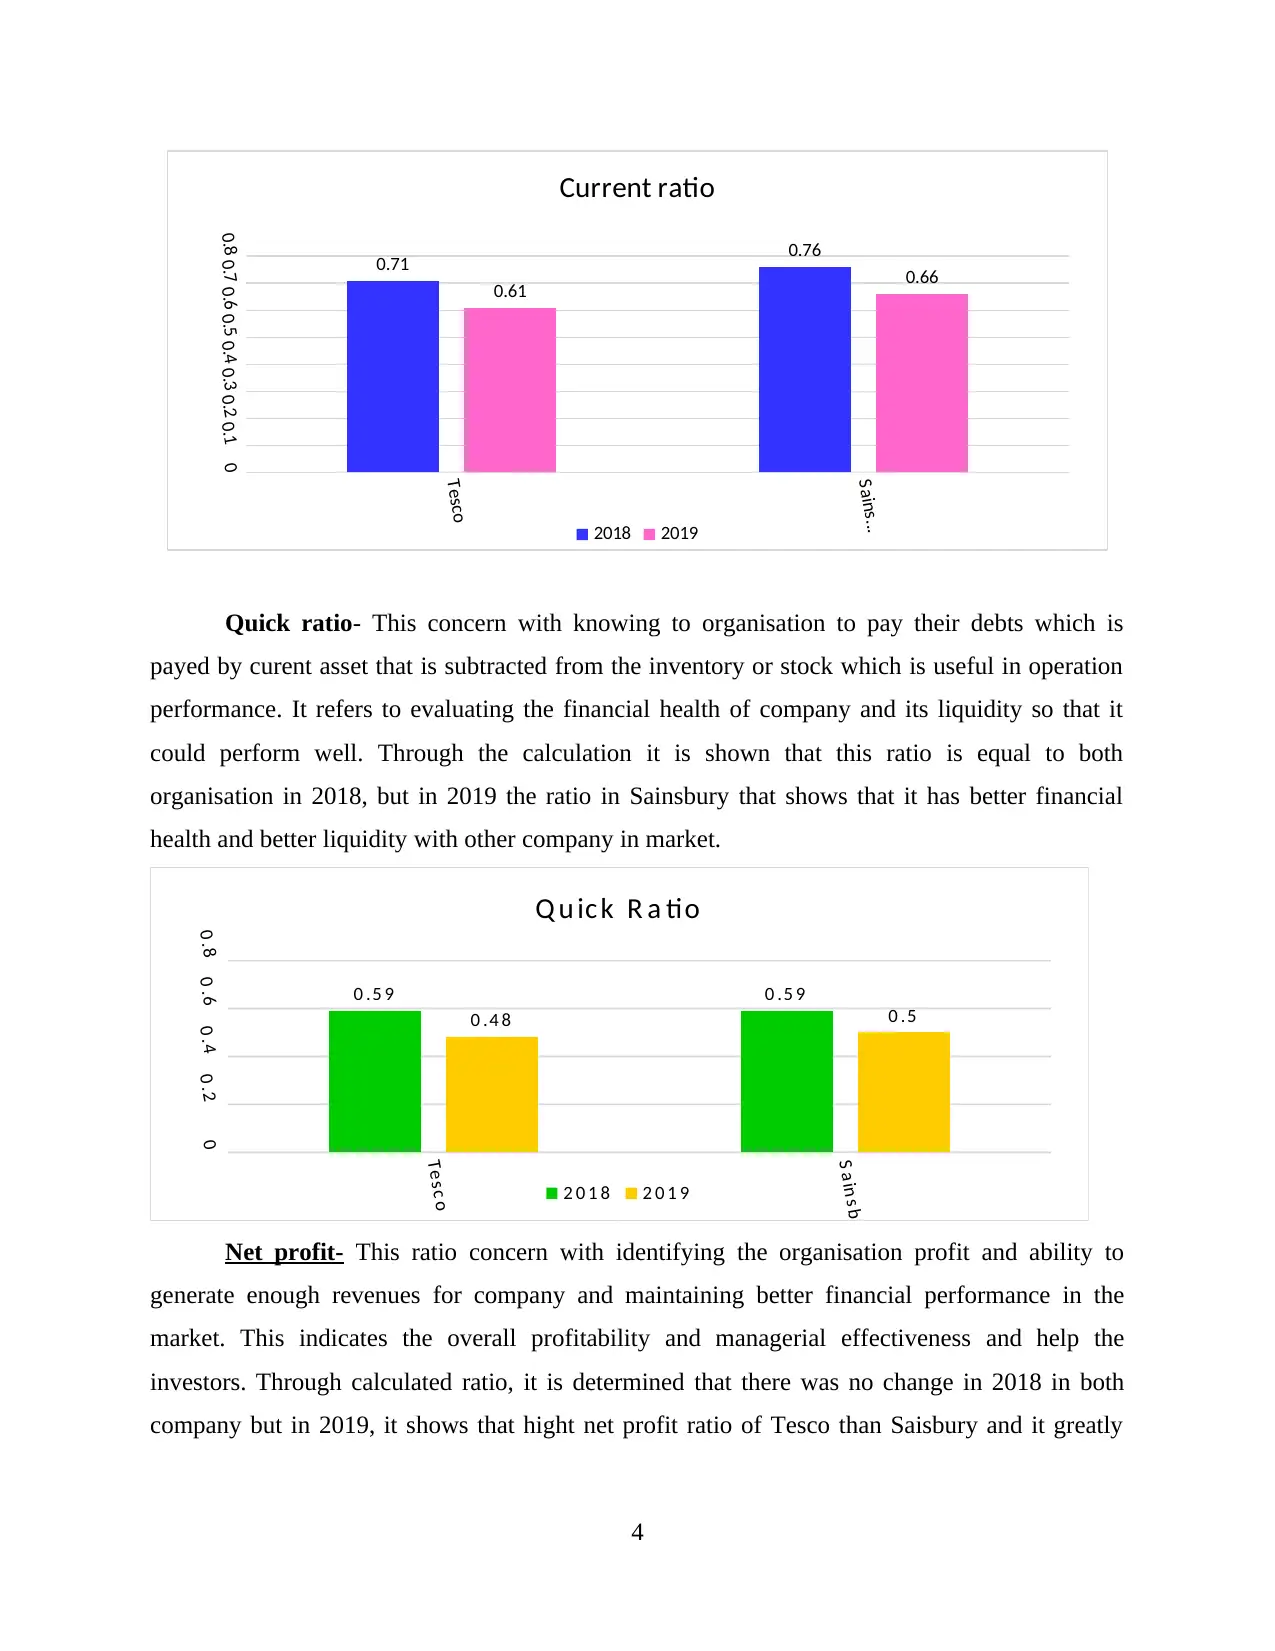
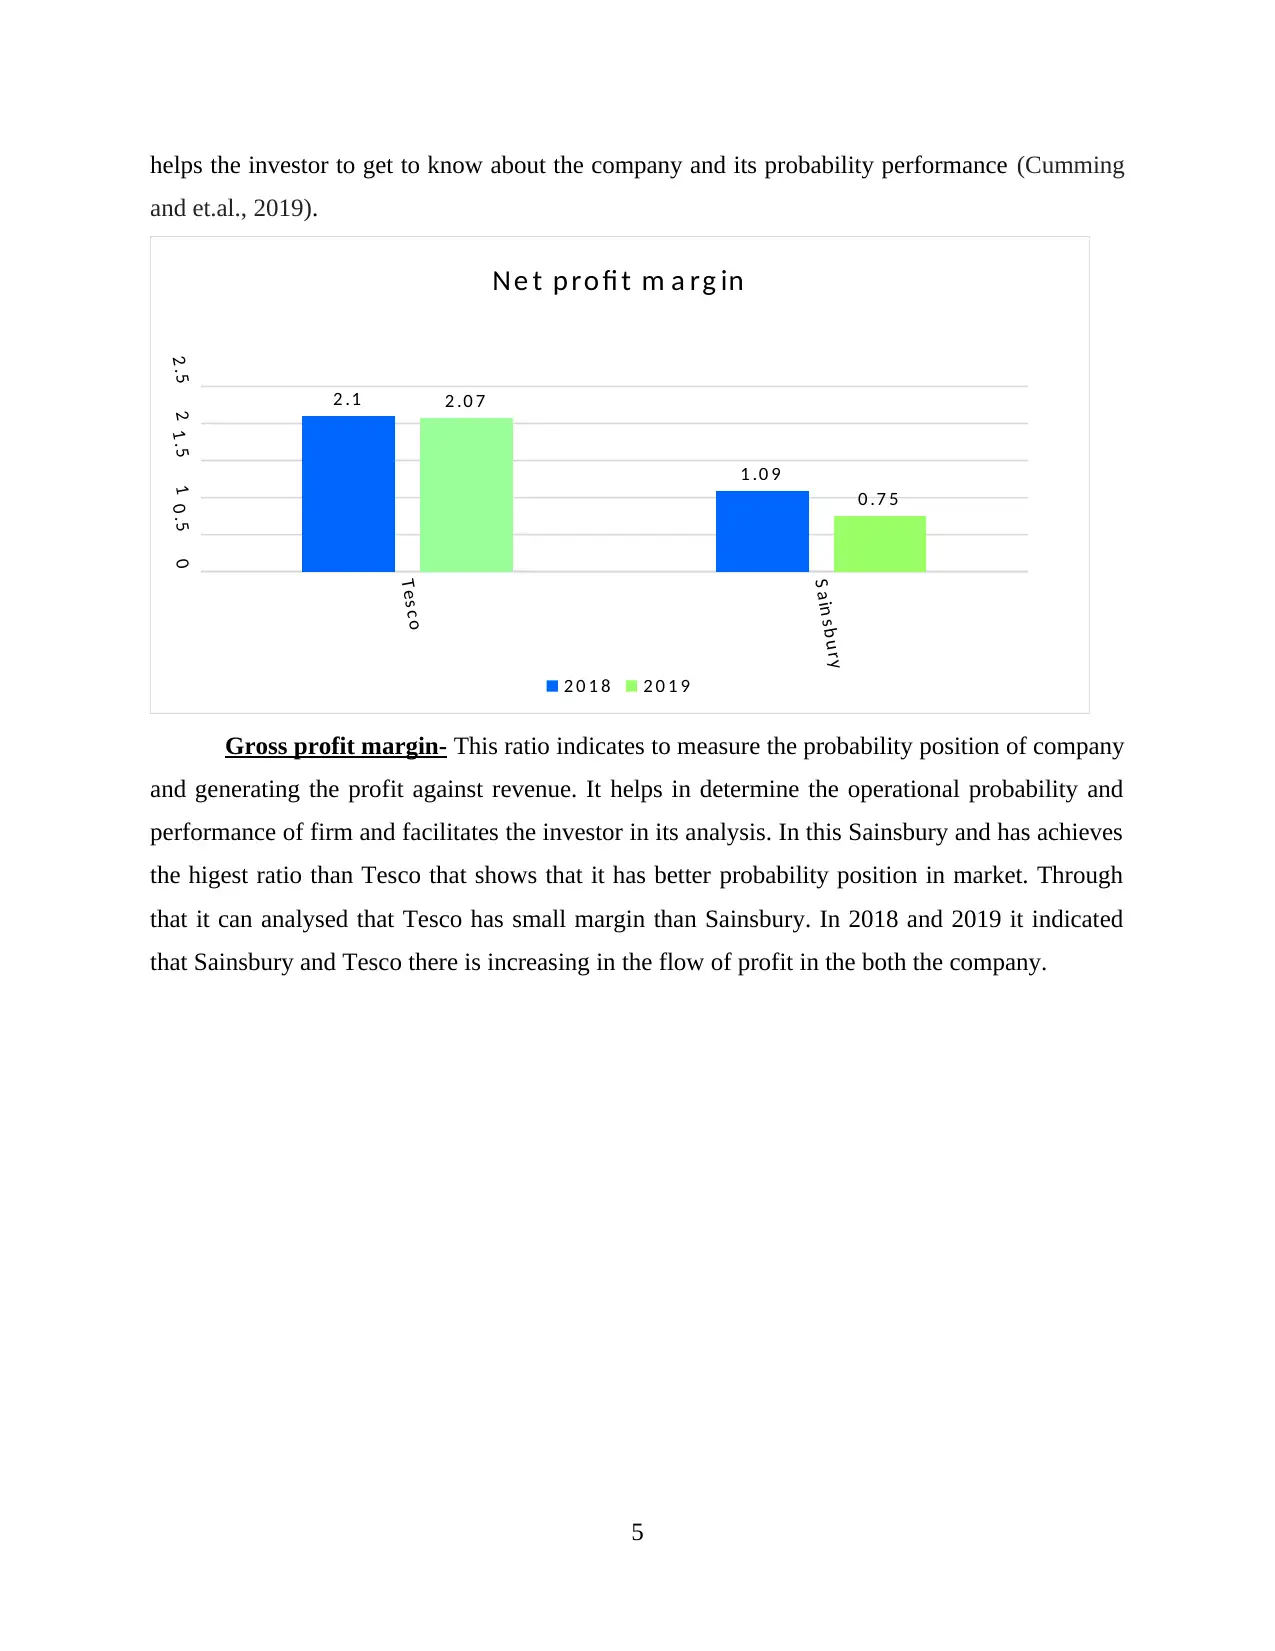
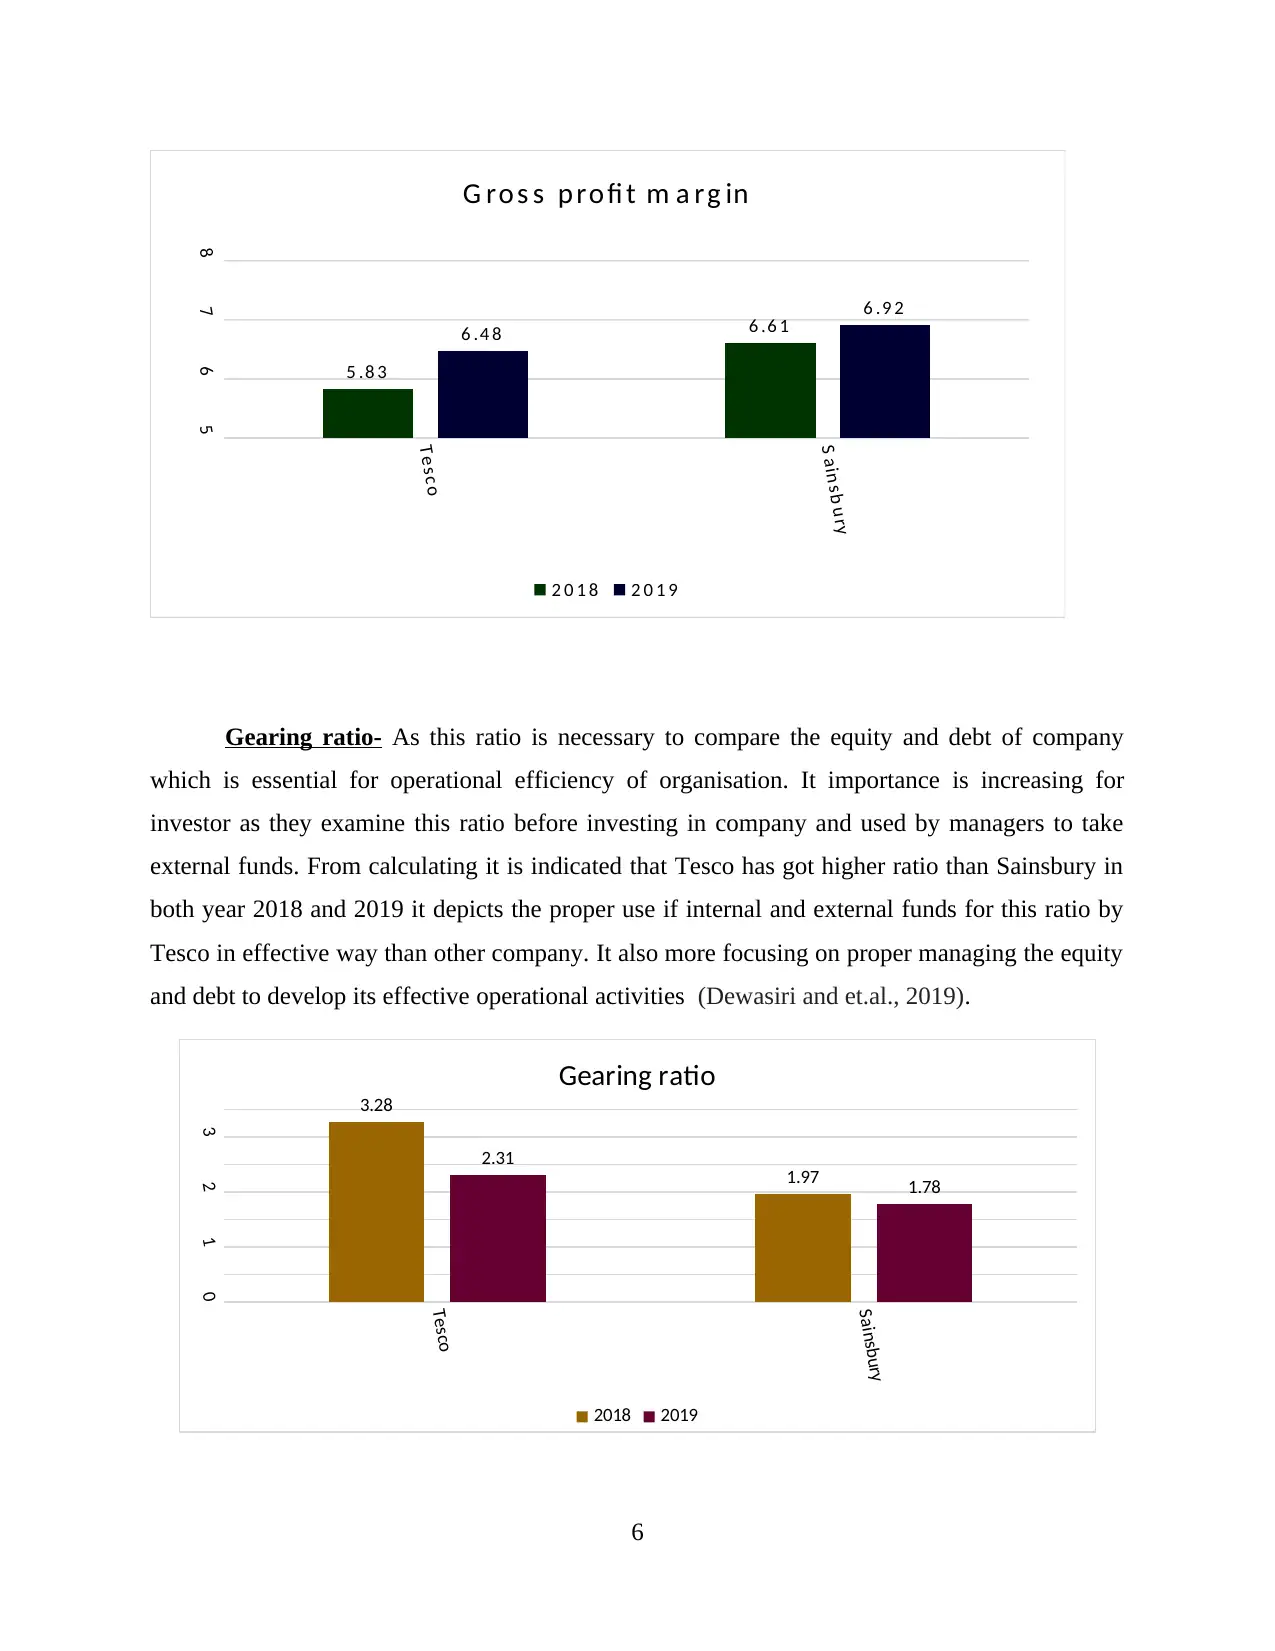
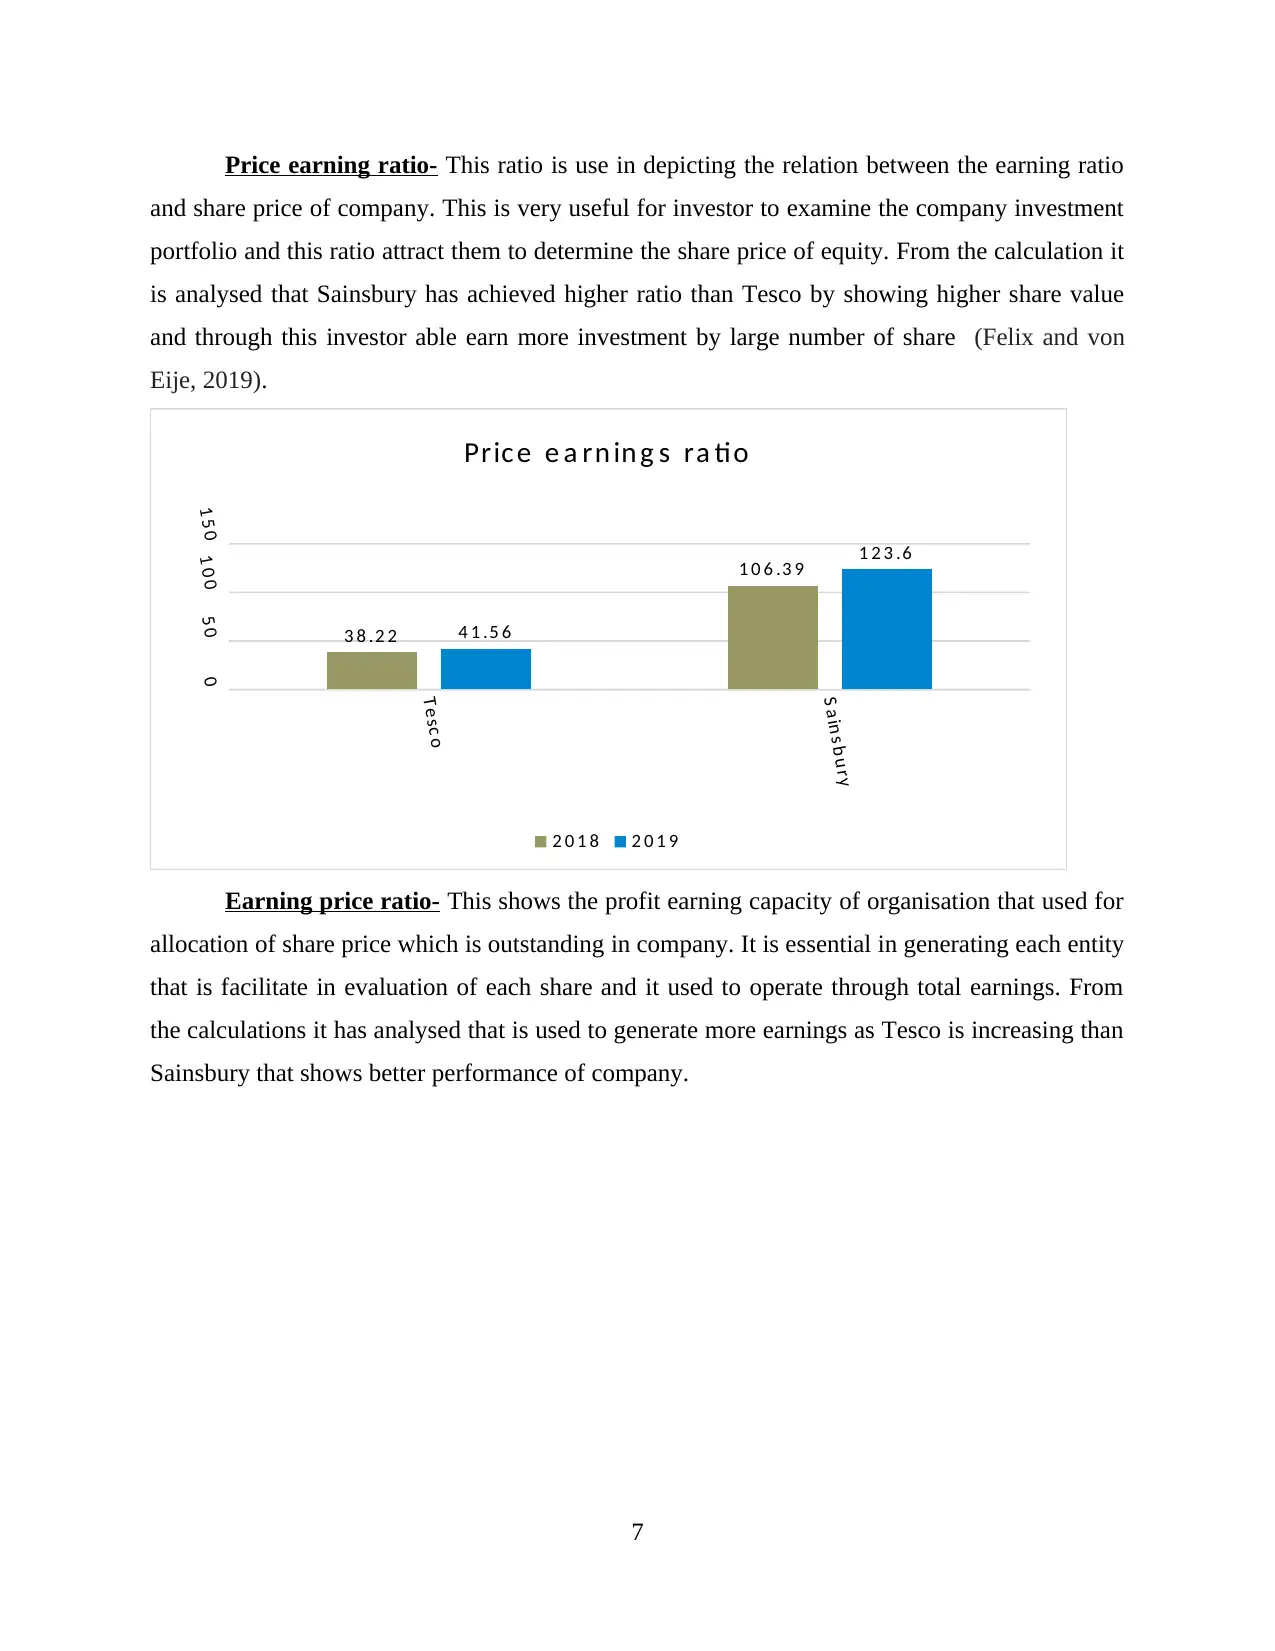
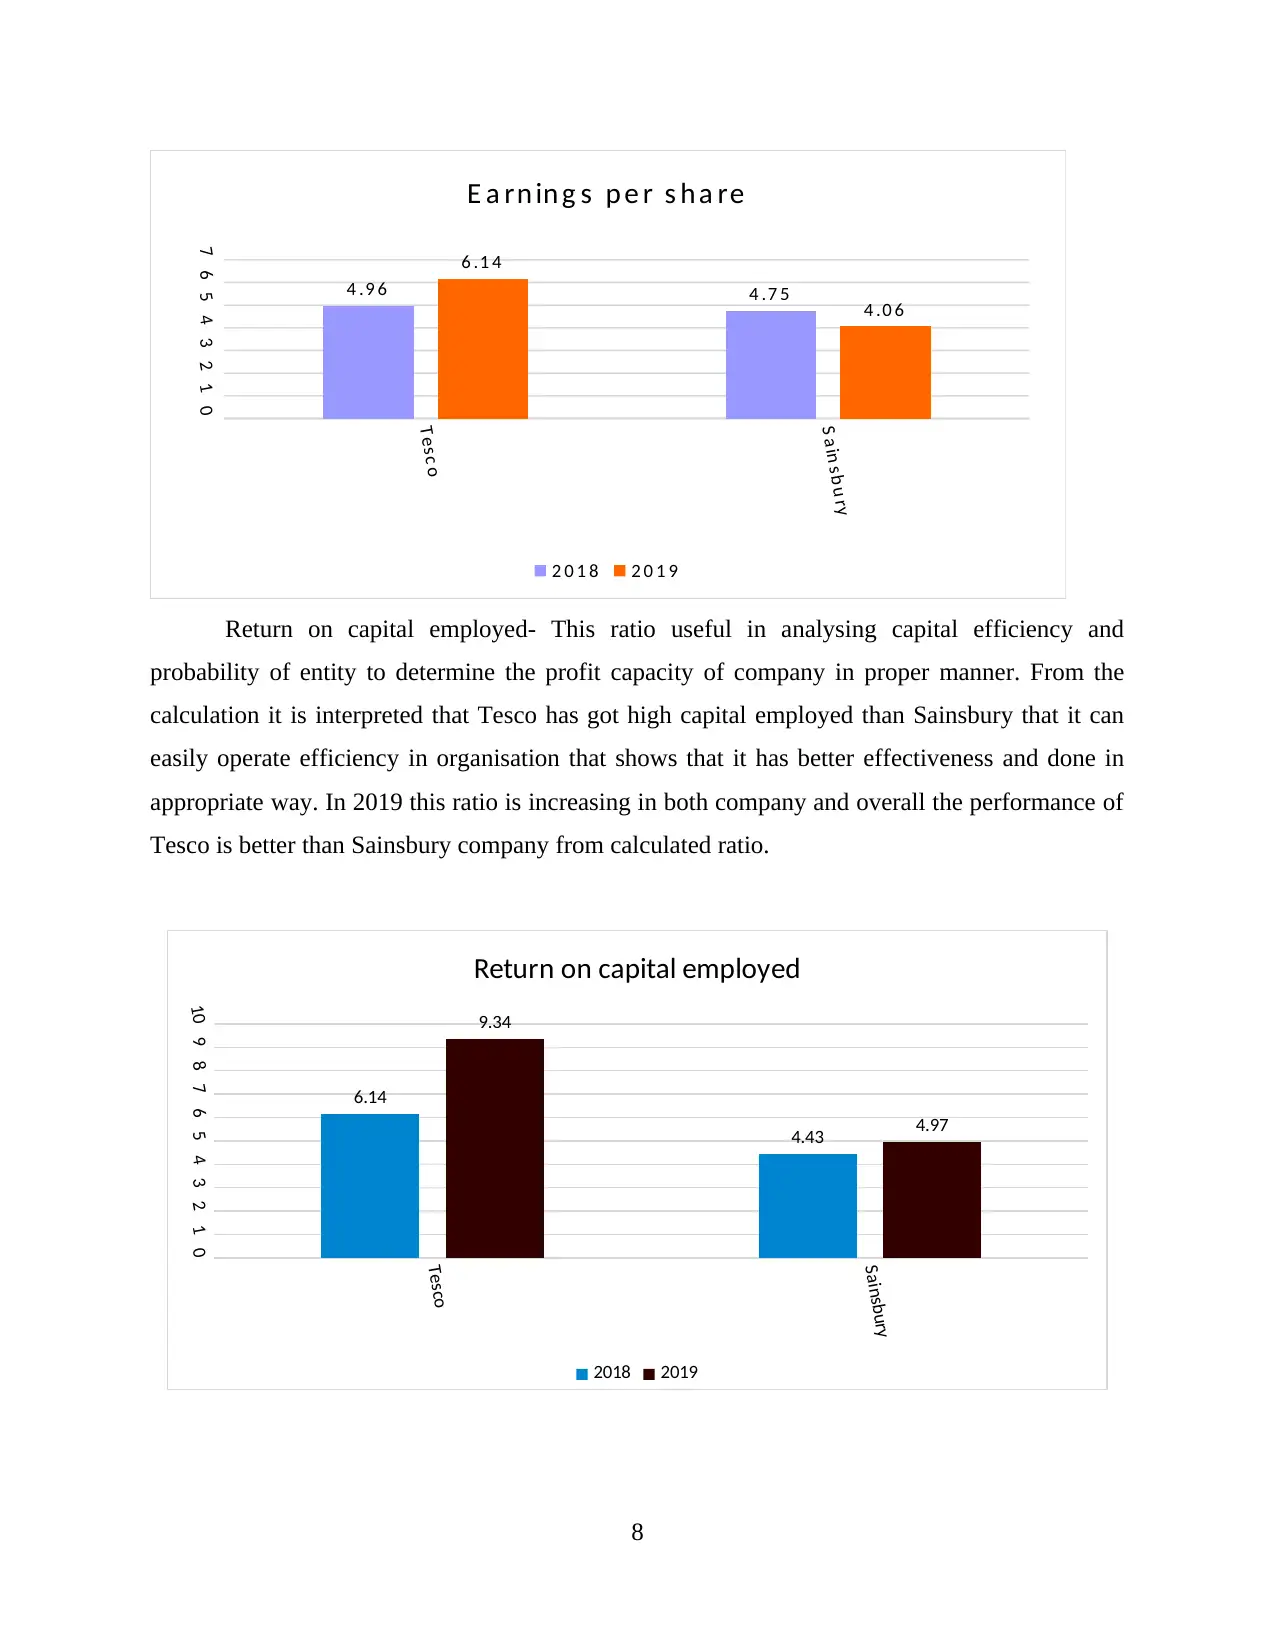
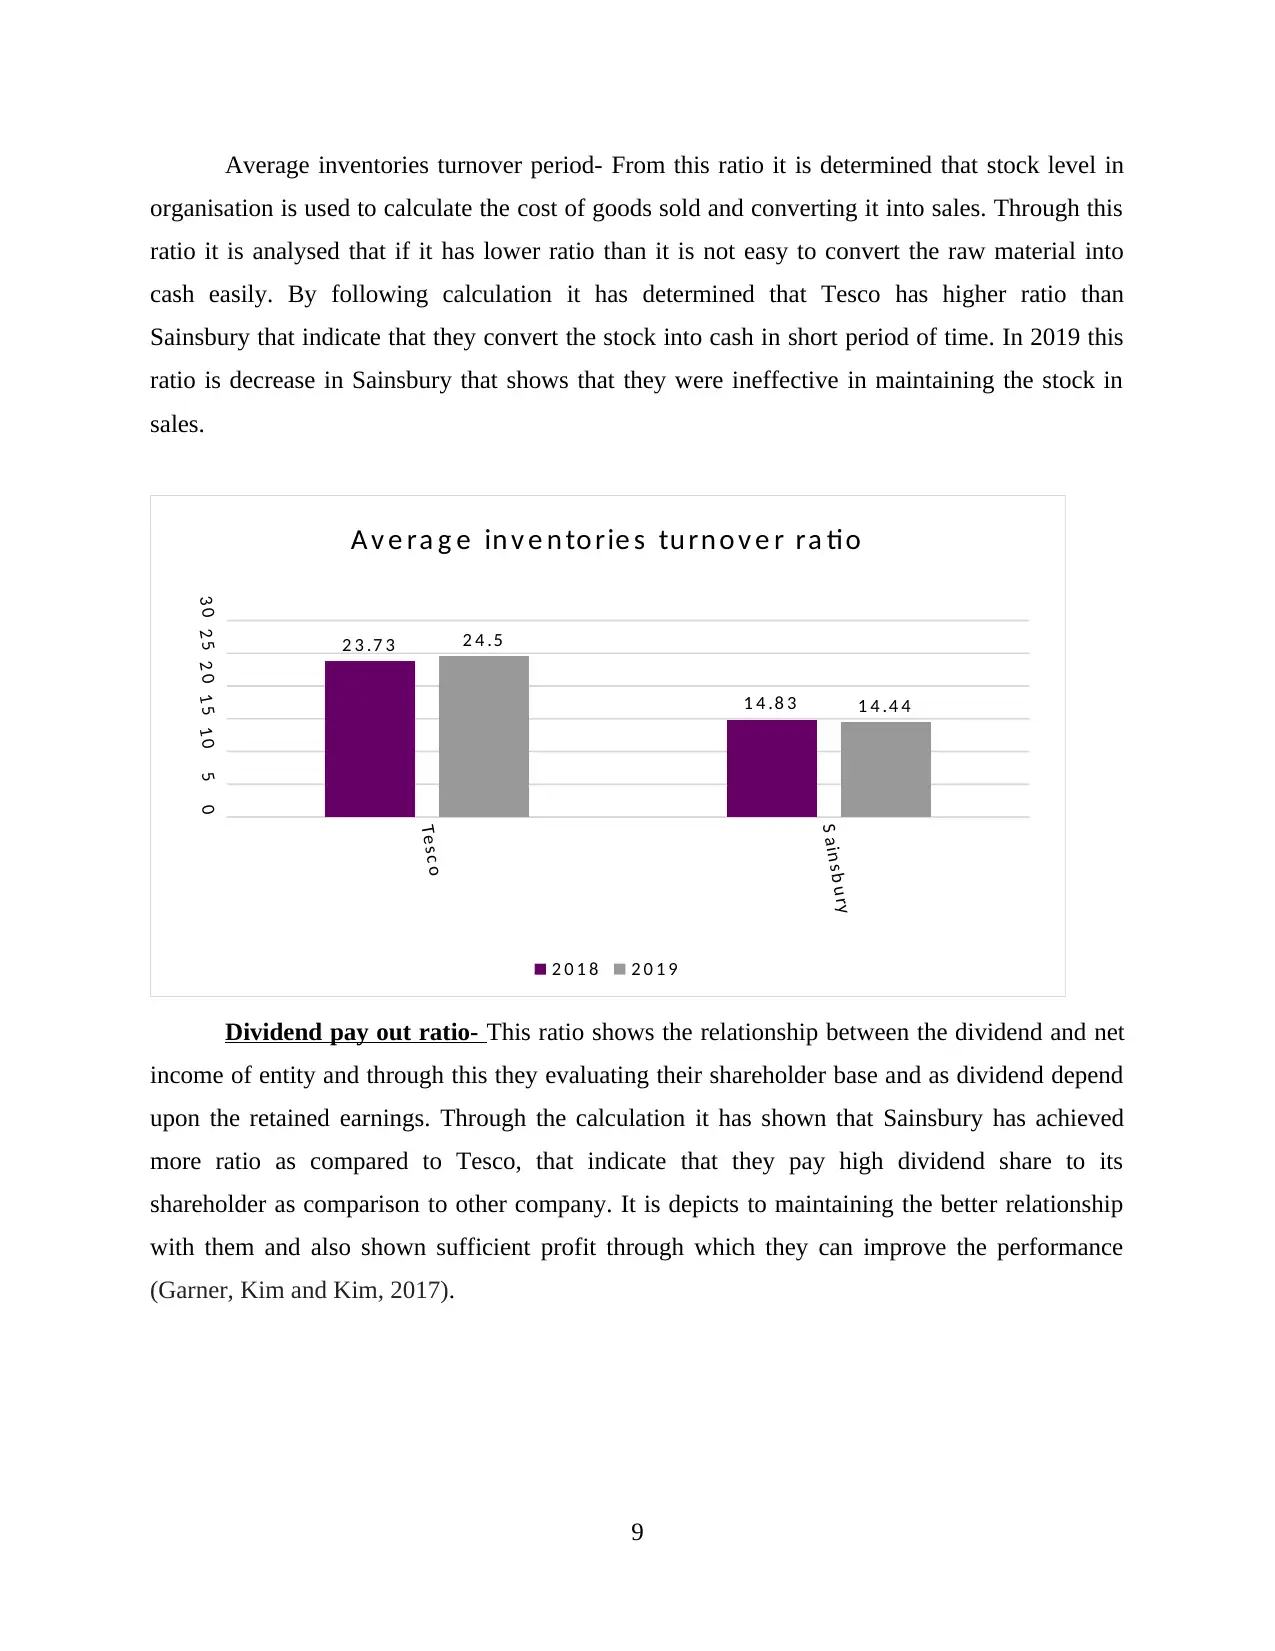
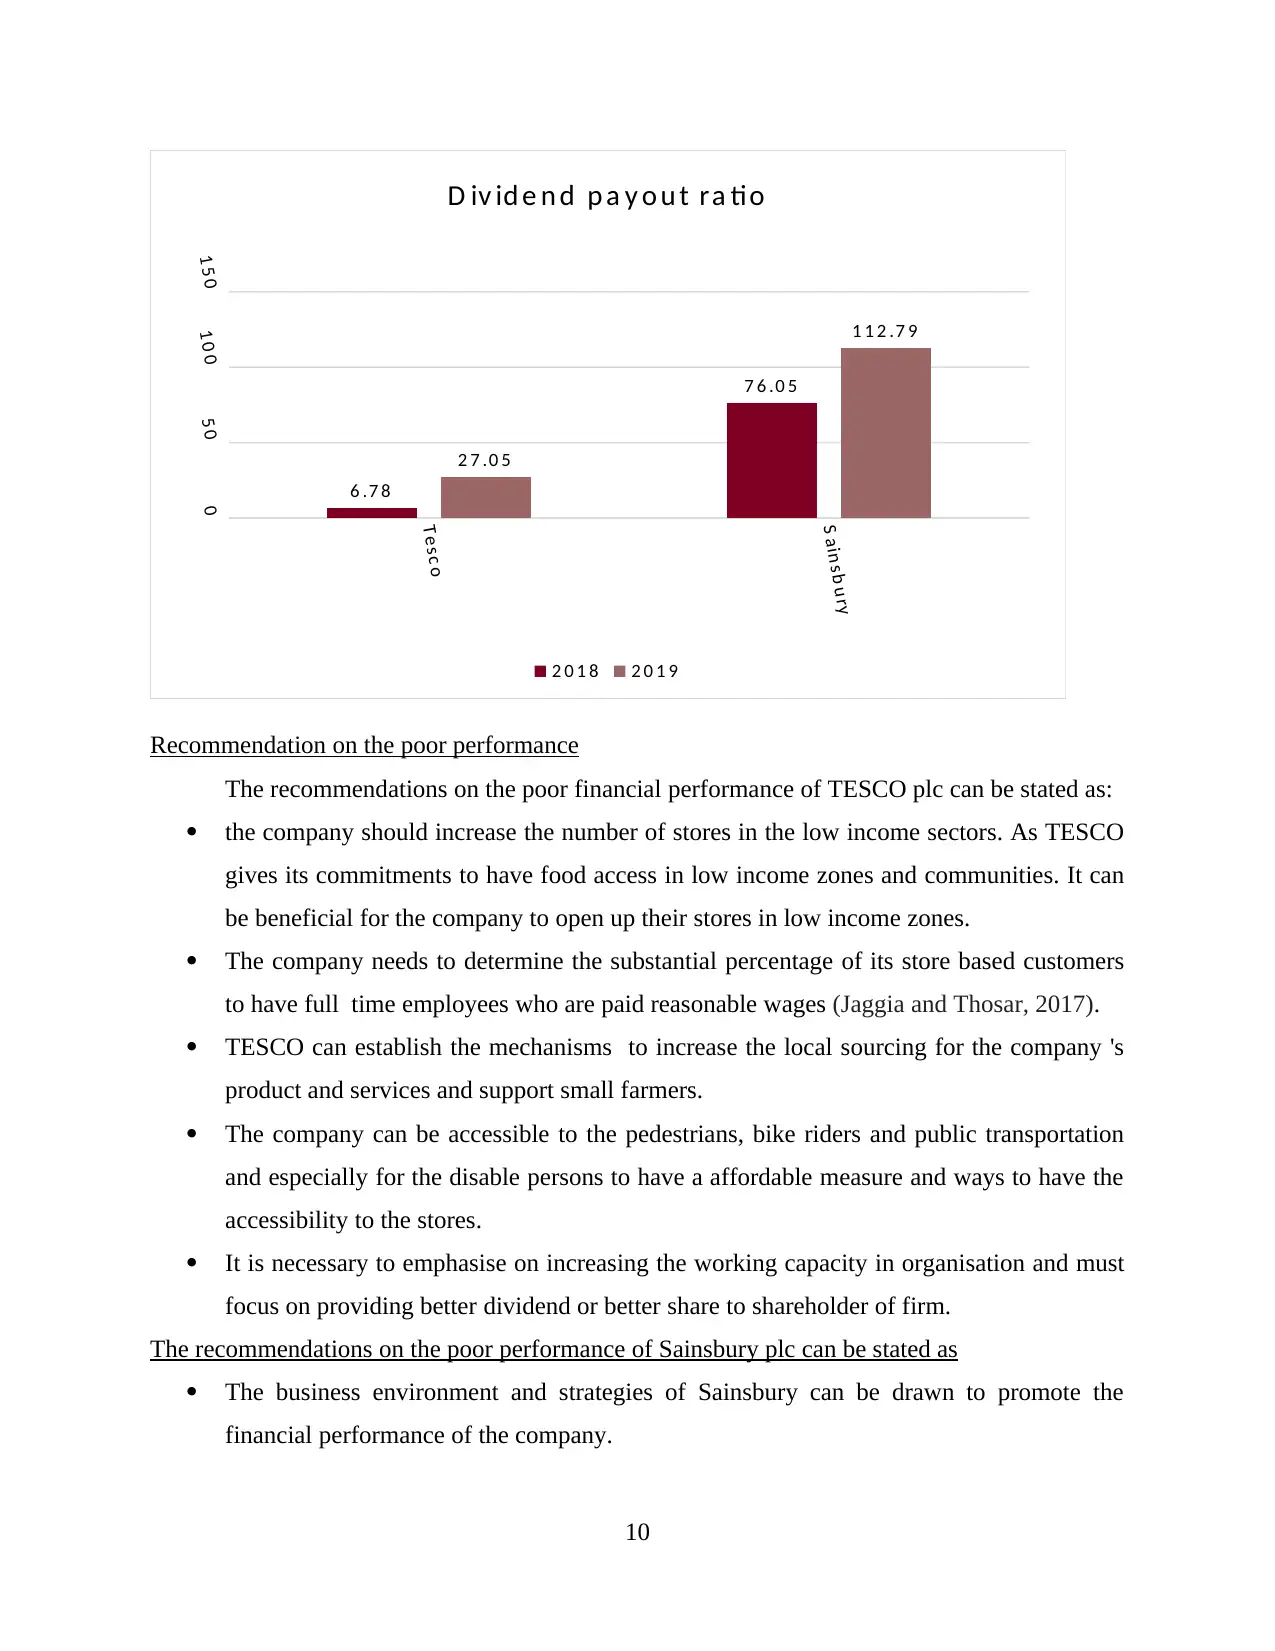
This report provides a comprehensive managerial finance analysis of Tesco PLC and Sainsbury PLC. It begins with an introduction to managerial finance and its applications, followed by a detailed examination of the financial performance of both companies using ratio analysis over two years. The report calculates and interprets various financial ratios, including current ratio, quick ratio, net profit margin, gross profit margin, gearing ratio, price-earnings ratio, earnings per share, return on capital employed, average inventories turnover period, and dividend payout ratio. Charts and graphs are used to visually represent the data. Based on the analysis, the report offers recommendations for improving the financial performance of both companies, addressing areas such as store expansion, employee wages, local sourcing, and efficient resource allocation. The report also discusses the limitations of ratio analysis and concludes with an overview of the findings. Additionally, it explores investment appraisal techniques and their limitations, providing a well-rounded assessment of the financial health and investment potential of the two companies.

Managerial Finance
Paraphrase This Document
Need a fresh take? Get an instant paraphrase of this document with our AI Paraphraser

Table of Contents
INTRODUCTION...........................................................................................................................1
PORTFOLIO 1 ................................................................................................................................1
Calculation of financial ratios for two years................................................................................1
Interpreting the financial performance of firm on the basis of ratio and charts..........................4
Recommendation on the poor performance...............................................................................11
Limitations of ratio analysis.......................................................................................................12
Portfolio 2 .....................................................................................................................................13
Investment appraisal techniques for adoption of two alternatives.............................................13
Evaluating Limitation of investment appraisal techniques........................................................16
CONCLUSION .............................................................................................................................16
REFERENCES..............................................................................................................................17

INTRODUCTION
The term “managerial finance” is referred to the branch of finance which concerns the
different managerial financial applications of finance techniques. The sound financial
management leads to create the value through the allocation of the scarce and optimum resources
among the competitive business opportunities (Aabo, Hvistendahl and Kring, 2020). It is referred
to the aid to the implementation and monitoring of business strategies and helps the business
companies to achieve their goals and objectives of the business company. The report is based on
the managerial financial position of TESCO plc and Sainsbury plc. The report below includes
the financial ratios, the analysis of financial position and investment potential of the companies,
recommendations for the poor performance, limitation of the ratio analysis along with its
conclusion.
PORTFOLIO 1
Calculation of financial ratios for two years
Ratio analysis refers to measuring and analysing the performance of financial statements
of companies and it is done by investor and analyst to make better decision in future (Al-
Malkawi and Pillai, 2018). It helps in identify the liquidity, efficiency and probability of
organisation. Its importance is increasing day by day in operation of company and helpful in
deep analysis of firm.
The ratio analysis of two entity Tesco and Sainsbury to determine from the view of point
of investor and able to analyse the higher profit in long run and efficiency in company.
1
⊘ This is a preview!⊘
Do you want full access?
Subscribe today to unlock all pages.

Trusted by 1+ million students worldwide

2
Paraphrase This Document
Need a fresh take? Get an instant paraphrase of this document with our AI Paraphraser

Interpreting the financial performance of firm on the basis of ratio and charts
Current ratio- This ratio used to analyse the liquidity of company and check the
requirement of shot term obligation and its capacity to pay it short period of time. It is necessary
for manager to identify which is able to pay off in short term or not and get to know about the
efficiency. From the calculation of this ratio is analysed that Sainsbury has achieves highest ratio
than Tesco in both year 2019 and 2018. It refers that Tesco is unable to fulfil short term
obligation and its has low liquidity as compared to Sainsbury (Camilleri, Grima and Grima,
2019).
3

Quick ratio- This concern with knowing to organisation to pay their debts which is
payed by curent asset that is subtracted from the inventory or stock which is useful in operation
performance. It refers to evaluating the financial health of company and its liquidity so that it
could perform well. Through the calculation it is shown that this ratio is equal to both
organisation in 2018, but in 2019 the ratio in Sainsbury that shows that it has better financial
health and better liquidity with other company in market.
Tes c o
S ain s b u ry
00 .20 .40 .60 .8
0 .5 9 0 .5 9
0 .4 8 0 .5
Q u ic k R a tio
2 0 1 8 2 0 1 9
Net profit- This ratio concern with identifying the organisation profit and ability to
generate enough revenues for company and maintaining better financial performance in the
market. This indicates the overall profitability and managerial effectiveness and help the
investors. Through calculated ratio, it is determined that there was no change in 2018 in both
company but in 2019, it shows that hight net profit ratio of Tesco than Saisbury and it greatly
4
Tesco
Sains...
00.10.20.30.40.50.60.70.8 0.71 0.76
0.61 0.66
Current ratio
2018 2019
⊘ This is a preview!⊘
Do you want full access?
Subscribe today to unlock all pages.

Trusted by 1+ million students worldwide

helps the investor to get to know about the company and its probability performance (Cumming
and et.al., 2019).
Tes c o
S a in s b u ry
00 .511 .522 .5
2 .1
1 .0 9
2 .0 7
0 .7 5
Ne t p ro fi t m a rg in
2 0 1 8 2 0 1 9
Gross profit margin- This ratio indicates to measure the probability position of company
and generating the profit against revenue. It helps in determine the operational probability and
performance of firm and facilitates the investor in its analysis. In this Sainsbury and has achieves
the higest ratio than Tesco that shows that it has better probability position in market. Through
that it can analysed that Tesco has small margin than Sainsbury. In 2018 and 2019 it indicated
that Sainsbury and Tesco there is increasing in the flow of profit in the both the company.
5
Paraphrase This Document
Need a fresh take? Get an instant paraphrase of this document with our AI Paraphraser

Tes c o
S ain s b u ry
5
6
7
8
5 .8 3
6 .6 16 .4 8
6 .9 2
G ro s s p ro fi t m a rg in
2 0 1 8 2 0 1 9
Gearing ratio- As this ratio is necessary to compare the equity and debt of company
which is essential for operational efficiency of organisation. It importance is increasing for
investor as they examine this ratio before investing in company and used by managers to take
external funds. From calculating it is indicated that Tesco has got higher ratio than Sainsbury in
both year 2018 and 2019 it depicts the proper use if internal and external funds for this ratio by
Tesco in effective way than other company. It also more focusing on proper managing the equity
and debt to develop its effective operational activities (Dewasiri and et.al., 2019).
6
Tesco
Sainsbury
0
1
2
3
3.28
1.97
2.31
1.78
Gearing ratio
2018 2019

Price earning ratio- This ratio is use in depicting the relation between the earning ratio
and share price of company. This is very useful for investor to examine the company investment
portfolio and this ratio attract them to determine the share price of equity. From the calculation it
is analysed that Sainsbury has achieved higher ratio than Tesco by showing higher share value
and through this investor able earn more investment by large number of share (Felix and von
Eije, 2019).
Tesc o
S ain s b u ry
05 01 0 01 5 0
3 8 .2 2
1 0 6 .3 9
4 1 .5 6
1 2 3 .6
Pric e e a rn in g s ra tio
2 0 1 8 2 0 1 9
Earning price ratio- This shows the profit earning capacity of organisation that used for
allocation of share price which is outstanding in company. It is essential in generating each entity
that is facilitate in evaluation of each share and it used to operate through total earnings. From
the calculations it has analysed that is used to generate more earnings as Tesco is increasing than
Sainsbury that shows better performance of company.
7
⊘ This is a preview!⊘
Do you want full access?
Subscribe today to unlock all pages.

Trusted by 1+ million students worldwide

Tes c o
S ain s b u ry
01234567
4 .9 6 4 .7 5
6 .1 4
4 .0 6
E a rn in g s p e r s h a re
2 0 1 8 2 0 1 9
Return on capital employed- This ratio useful in analysing capital efficiency and
probability of entity to determine the profit capacity of company in proper manner. From the
calculation it is interpreted that Tesco has got high capital employed than Sainsbury that it can
easily operate efficiency in organisation that shows that it has better effectiveness and done in
appropriate way. In 2019 this ratio is increasing in both company and overall the performance of
Tesco is better than Sainsbury company from calculated ratio.
8
Tesco
Sainsbury
012345678910
6.14
4.43
9.34
4.97
Return on capital employed
2018 2019
Paraphrase This Document
Need a fresh take? Get an instant paraphrase of this document with our AI Paraphraser

Average inventories turnover period- From this ratio it is determined that stock level in
organisation is used to calculate the cost of goods sold and converting it into sales. Through this
ratio it is analysed that if it has lower ratio than it is not easy to convert the raw material into
cash easily. By following calculation it has determined that Tesco has higher ratio than
Sainsbury that indicate that they convert the stock into cash in short period of time. In 2019 this
ratio is decrease in Sainsbury that shows that they were ineffective in maintaining the stock in
sales.
Tes c o
S a in s b u ry
051 01 52 02 53 0
2 3 .7 3
1 4 .8 3
2 4 .5
1 4 .4 4
A v e ra g e in v e n to rie s tu rn o v e r ra tio
2 0 1 8 2 0 1 9
Dividend pay out ratio- This ratio shows the relationship between the dividend and net
income of entity and through this they evaluating their shareholder base and as dividend depend
upon the retained earnings. Through the calculation it has shown that Sainsbury has achieved
more ratio as compared to Tesco, that indicate that they pay high dividend share to its
shareholder as comparison to other company. It is depicts to maintaining the better relationship
with them and also shown sufficient profit through which they can improve the performance
(Garner, Kim and Kim, 2017).
9

Tes c o
S ain s b u ry
0
5 0
1 0 0
1 5 0
6 .7 8
7 6 .0 5
2 7 .0 5
1 1 2 .7 9
D iv id e n d p a y o u t ra tio
2 0 1 8 2 0 1 9
Recommendation on the poor performance
The recommendations on the poor financial performance of TESCO plc can be stated as:
the company should increase the number of stores in the low income sectors. As TESCO
gives its commitments to have food access in low income zones and communities. It can
be beneficial for the company to open up their stores in low income zones.
The company needs to determine the substantial percentage of its store based customers
to have full time employees who are paid reasonable wages (Jaggia and Thosar, 2017).
TESCO can establish the mechanisms to increase the local sourcing for the company 's
product and services and support small farmers.
The company can be accessible to the pedestrians, bike riders and public transportation
and especially for the disable persons to have a affordable measure and ways to have the
accessibility to the stores.
It is necessary to emphasise on increasing the working capacity in organisation and must
focus on providing better dividend or better share to shareholder of firm.
The recommendations on the poor performance of Sainsbury plc can be stated as
The business environment and strategies of Sainsbury can be drawn to promote the
financial performance of the company.
10
⊘ This is a preview!⊘
Do you want full access?
Subscribe today to unlock all pages.

Trusted by 1+ million students worldwide
1 out of 18
Related Documents

Your All-in-One AI-Powered Toolkit for Academic Success.
+13062052269
info@desklib.com
Available 24*7 on WhatsApp / Email
Unlock your academic potential
Copyright © 2020–2025 A2Z Services. All Rights Reserved. Developed and managed by ZUCOL.