Financial Analysis of Good Spirits Hospitality Limited: Report
VerifiedAdded on 2022/08/13
|9
|1624
|28
Report
AI Summary
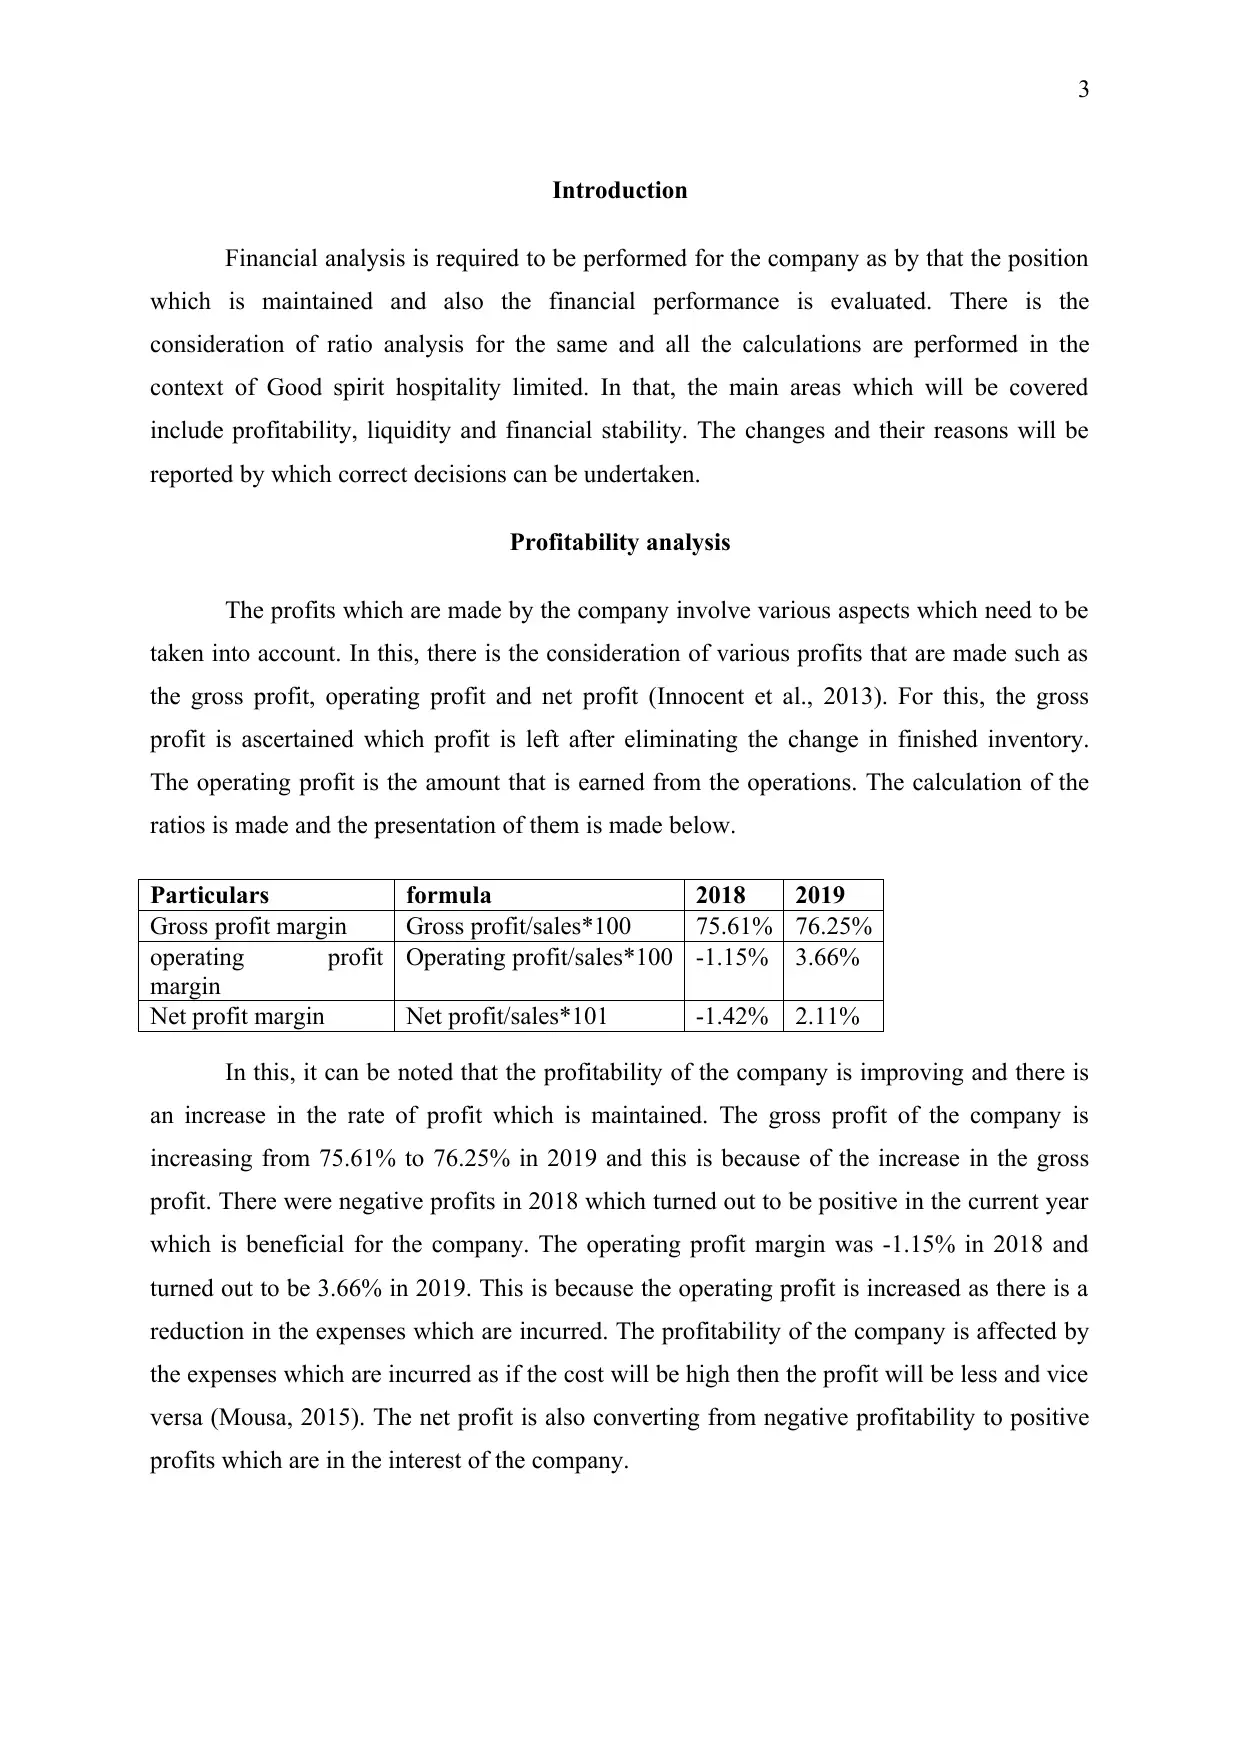
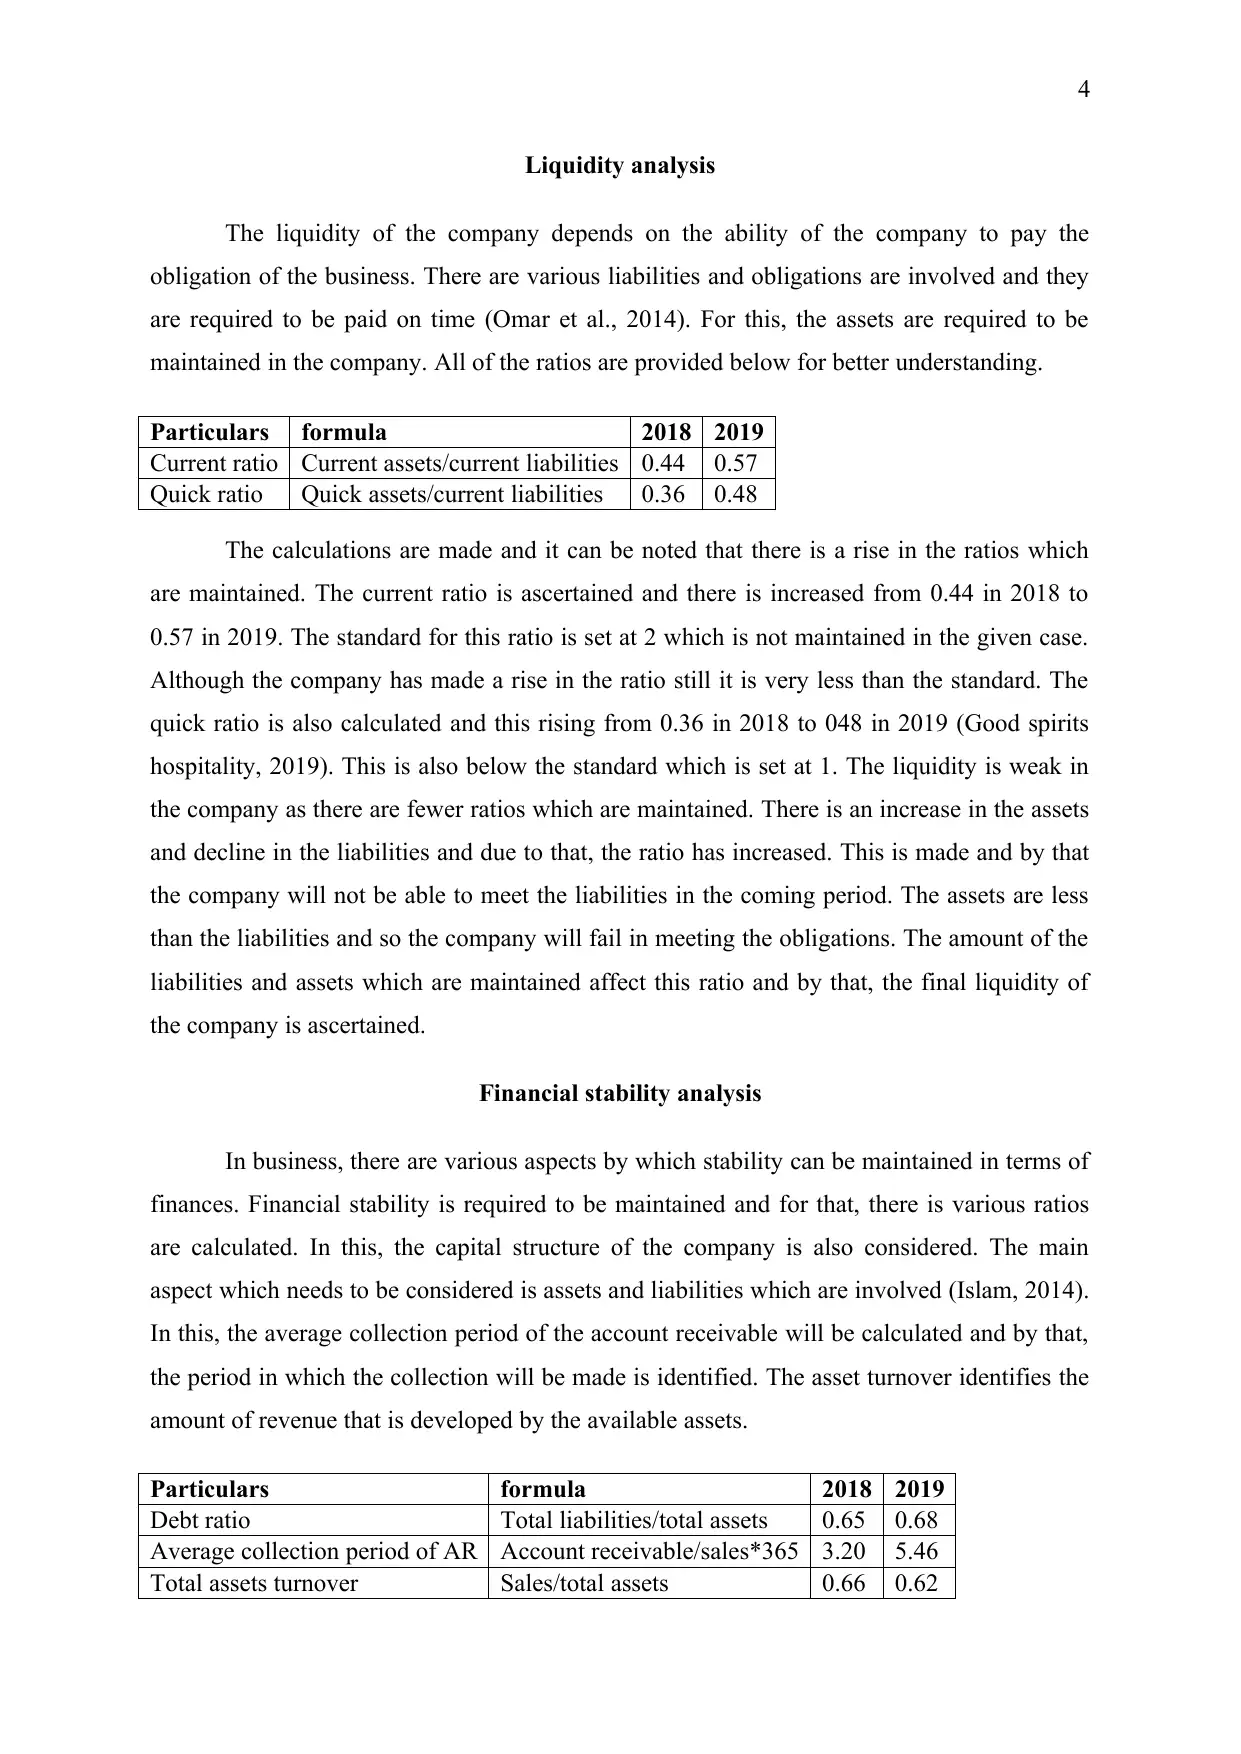
This report presents a financial analysis of Good Spirits Hospitality Limited, focusing on profitability, liquidity, and financial stability. The analysis includes the calculation and interpretation of various financial ratios, such as gross profit margin, operating profit margin, net profit margin, current ratio, quick ratio, debt ratio, average collection period, and asset turnover. The report examines the company's performance in 2018 and 2019, highlighting trends and changes in these ratios. The findings indicate improvements in profitability but weaknesses in liquidity and financial stability, with recommendations for improvements. The report concludes that while profitability is increasing, the company needs to improve its liquidity and financial stability to achieve its financial goals.


1 out of 9
Related Documents


Your All-in-One AI-Powered Toolkit for Academic Success.
+13062052269
info@desklib.com
Available 24*7 on WhatsApp / Email
![[object Object]](/_next/static/media/star-bottom.7253800d.svg)
Copyright © 2020–2026 A2Z Services. All Rights Reserved. Developed and managed by ZUCOL.