Financial Analysis of Crown Resorts Limited: Accounting for Business
VerifiedAdded on 2021/06/15
|14
|2445
|24
Report
AI Summary
This report assesses the financial performance of Crown Resorts Limited, an Australian public listed entity in the integrated resorts sector, by analyzing its financial statements. The report focuses on key financial ratios, including quick ratio, gross profit margin, return on equity, debt-to-equity ratio, and days inventory, to evaluate Crown Resorts' financial health. A comparative analysis is also conducted with Tatts Group Limited, a major competitor, using gross margin, quick ratio, and debt-to-equity ratio. The analysis reveals that Crown Resorts Limited demonstrates a stronger financial position and performance compared to Tatts Group Limited in the Australian market, based on the selected financial ratios. The report highlights the significance of these ratios in understanding the company's liquidity, profitability, solvency, and efficiency, providing valuable insights into its financial standing and competitive advantage.
Running head: ACCOUNTING FOR BUSINESS
Accounting for Business
Name of the Student:
Name of the University:
Author’s Note:
Course ID:
Accounting for Business
Name of the Student:
Name of the University:
Author’s Note:
Course ID:
Paraphrase This Document
Need a fresh take? Get an instant paraphrase of this document with our AI Paraphraser
1ACCOUNTING FOR BUSINESS
Executive Summary:
The current report aims to assess the financial performance of an Australian public
listed entity based on its financial statements for the past years. For meeting the purpose of
this report, Crown Resorts Limited is selected as the entity operating in the integrated resorts
sector and it is listed in ASX under the code CNW. For extending the scope of this particular
report, comparison is made with one of the major competitors of Crown Resorts, which is
Tatts Group Limited with the ASX code of TTW. By taking into account the financial ratios,
the financial performance and position of Crown Resorts Limited is much better in contrast to
Tatts Group Limited in the Australian market.
2ACCOUNTING FOR BUSINESS
Table of Contents
1.0 Introduction:.........................................................................................................................3
1.1 Purpose:............................................................................................................................3
1.2 Scope:...............................................................................................................................3
1.3 Limitations:......................................................................................................................3
2.0 Company overview of Crown Resorts Limited:..................................................................3
3.0 Ratio analysis:......................................................................................................................4
3.1 Quick ratio:.......................................................................................................................4
3.2 Gross profit margin:.........................................................................................................5
3.3 Return on equity:..............................................................................................................6
3.4 Debt to equity ratio:.........................................................................................................7
3.5 Days inventory:................................................................................................................8
4.0 Analysis and comparison of Crown Resorts Limited with Tatts Group Limited:...............9
References:...............................................................................................................................13
⊘ This is a preview!⊘
Do you want full access?
Subscribe today to unlock all pages.
Trusted by 1+ million students worldwide
3ACCOUNTING FOR BUSINESS
1.0 Introduction:
1.1 Purpose:
The current report aims to assess the financial performance of an Australian public
listed entity based on its financial statements for the past years. For meeting the purpose of
this report, Crown Resorts Limited is selected as the entity operating in the integrated resorts
sector and it is listed in ASX under the code CNW. The financial analysis is carried out by
taking into consideration five different financial ratios to understand the current standing of
the organisation in the Australian market.
1.2 Scope:
For extending the scope of this particular report, comparison is made with one of the
major competitors of Crown Resorts, which is Tatts Group Limited with the ASX code of
TTW. In addition, three different methods of comparison are used to determine the
organisation that is enjoying competitive advantage over the other one.
1.3 Limitations:
It has already identified that comparative analysis of the financial statements of the
two selected organisations would be made with the help of five financial ratios. However, it
is to be borne in mind that financial ratios only have the ability to depict the previous trends.
In other words, the future progress of an entity could not be predicted with the help of
financial ratios, since they do not take into consideration the effects of inflationary pressures
on the economy, changes in industrial trends along with consumer preferences. Moreover, the
ratios of only the past two years would be evaluated. If the timeframe would be five years,
more accurate overview of the financial position of both the organisations could be evaluated
in a better way.
2.0 Company overview of Crown Resorts Limited:
Crown Resorts Limited is one of the biggest gaming and entertainment groups having
market capitalisation of nearly $8.7 billion in April 2018 (Crownresorts.com.au 2018). It is
involved in fully operating and owning two leading entertainment and gaming complexes of
Australia, which are Crown Perth and Crown Melbourne. In addition, it has strong portfolio
of future projects along with complementary investments that are anchored on the part of
Crown Sydney. In addition, it provides grants to community welfare, arts, healthcare,
Paraphrase This Document
Need a fresh take? Get an instant paraphrase of this document with our AI Paraphraser
4ACCOUNTING FOR BUSINESS
education and environment by contributing above $100 million over ten years to aid in
community projects in Australia.
3.0 Ratio analysis:
The following ratios are considered in the context of Crown Resorts Limited to
measure its financial condition in the past two years:
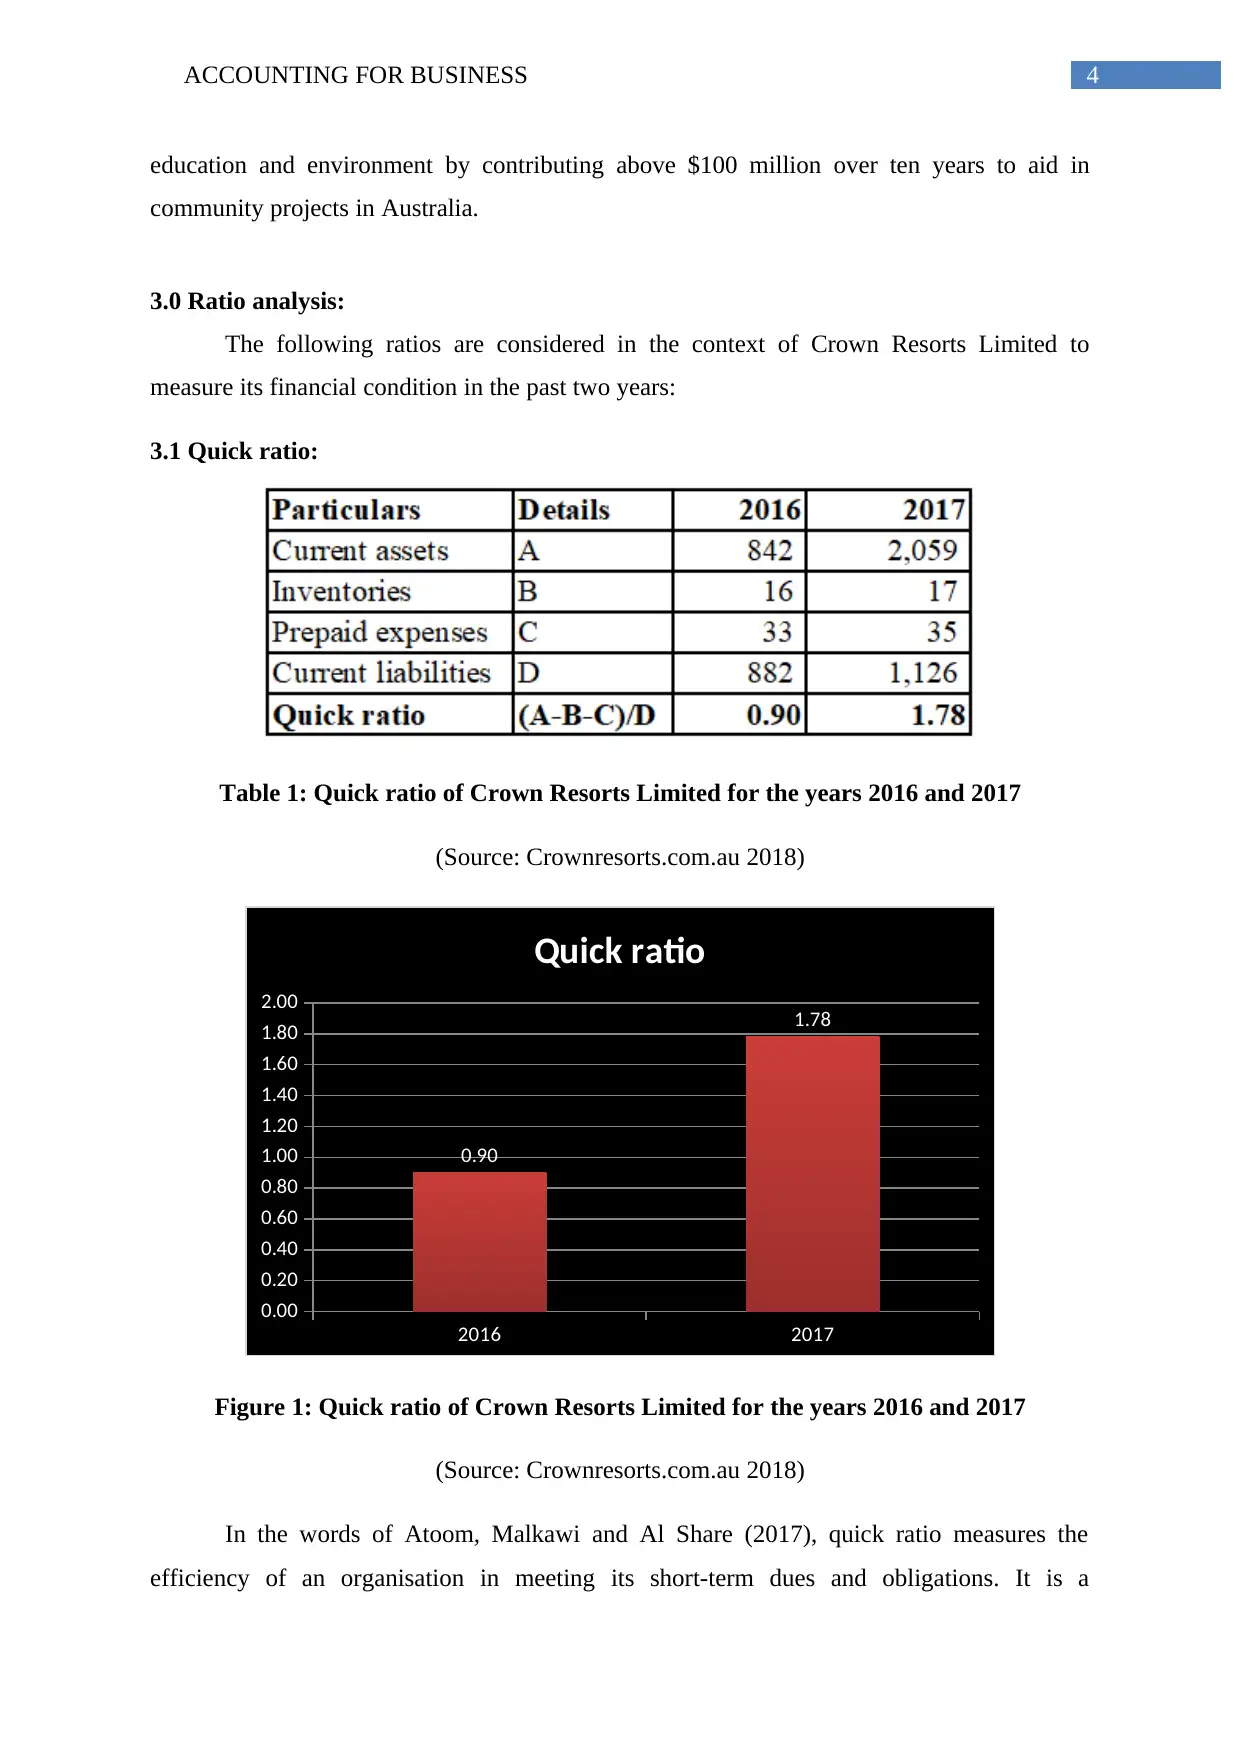
3.1 Quick ratio:
Table 1: Quick ratio of Crown Resorts Limited for the years 2016 and 2017
(Source: Crownresorts.com.au 2018)
2016 2017
0.00
0.20
0.40
0.60
0.80
1.00
1.20
1.40
1.60
1.80
2.00
0.90
1.78
Quick ratio
Figure 1: Quick ratio of Crown Resorts Limited for the years 2016 and 2017
(Source: Crownresorts.com.au 2018)
In the words of Atoom, Malkawi and Al Share (2017), quick ratio measures the
efficiency of an organisation in meeting its short-term dues and obligations. It is a
education and environment by contributing above $100 million over ten years to aid in
community projects in Australia.
3.0 Ratio analysis:
The following ratios are considered in the context of Crown Resorts Limited to
measure its financial condition in the past two years:
3.1 Quick ratio:
Table 1: Quick ratio of Crown Resorts Limited for the years 2016 and 2017
(Source: Crownresorts.com.au 2018)
2016 2017
0.00
0.20
0.40
0.60
0.80
1.00
1.20
1.40
1.60
1.80
2.00
0.90
1.78
Quick ratio
Figure 1: Quick ratio of Crown Resorts Limited for the years 2016 and 2017
(Source: Crownresorts.com.au 2018)
In the words of Atoom, Malkawi and Al Share (2017), quick ratio measures the
efficiency of an organisation in meeting its short-term dues and obligations. It is a
5ACCOUNTING FOR BUSINESS
conservative version of the liquidity metric, current ratio, since it provides a greater rigorous
evaluation of the ability of a firm to meet its short-term liabilities. The reason is that it does
not consider the most liquid current assets, which are inventories and prepaid expenses. In
case of Crown Resorts Limited, the quick ratio has increased significantly from 0.90 in 2016
to 1.78 in 2017, while the ideal ratio is considered as 1. A lower ratio indicates that the
organisation is struggling to discharge its existing obligations, while a higher ratio signifies
the presence of huge amount of idle working capital (Gitman, Juchau and Flanagan 2015).
The latter is the case with Crown Resorts Limited due to significant increase in cash and cash
equivalents in 2017 from 2016.
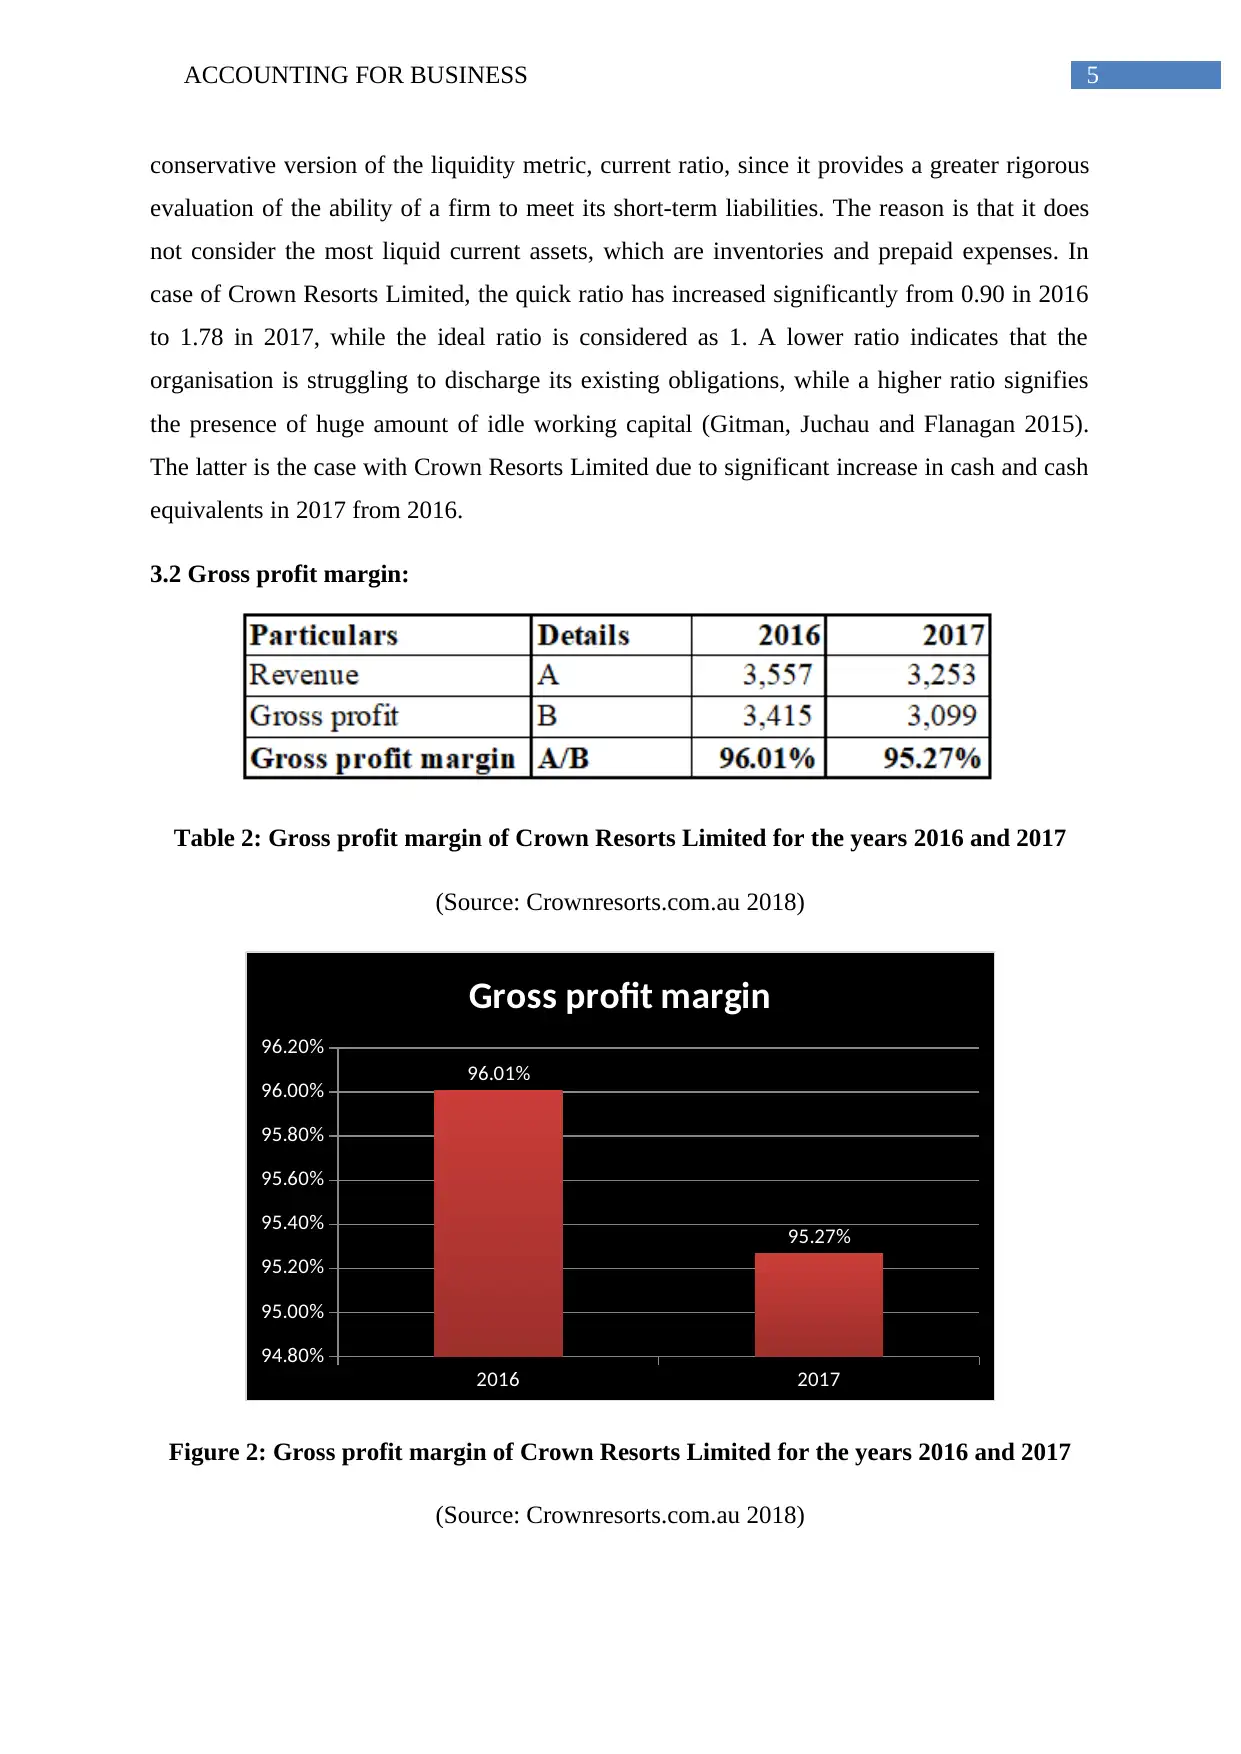
3.2 Gross profit margin:
Table 2: Gross profit margin of Crown Resorts Limited for the years 2016 and 2017
(Source: Crownresorts.com.au 2018)
2016 2017
94.80%
95.00%
95.20%
95.40%
95.60%
95.80%
96.00%
96.20%
96.01%
95.27%
Gross profit margin
Figure 2: Gross profit margin of Crown Resorts Limited for the years 2016 and 2017
(Source: Crownresorts.com.au 2018)
conservative version of the liquidity metric, current ratio, since it provides a greater rigorous
evaluation of the ability of a firm to meet its short-term liabilities. The reason is that it does
not consider the most liquid current assets, which are inventories and prepaid expenses. In
case of Crown Resorts Limited, the quick ratio has increased significantly from 0.90 in 2016
to 1.78 in 2017, while the ideal ratio is considered as 1. A lower ratio indicates that the
organisation is struggling to discharge its existing obligations, while a higher ratio signifies
the presence of huge amount of idle working capital (Gitman, Juchau and Flanagan 2015).
The latter is the case with Crown Resorts Limited due to significant increase in cash and cash
equivalents in 2017 from 2016.
3.2 Gross profit margin:
Table 2: Gross profit margin of Crown Resorts Limited for the years 2016 and 2017
(Source: Crownresorts.com.au 2018)
2016 2017
94.80%
95.00%
95.20%
95.40%
95.60%
95.80%
96.00%
96.20%
96.01%
95.27%
Gross profit margin
Figure 2: Gross profit margin of Crown Resorts Limited for the years 2016 and 2017
(Source: Crownresorts.com.au 2018)
⊘ This is a preview!⊘
Do you want full access?
Subscribe today to unlock all pages.
Trusted by 1+ million students worldwide
6ACCOUNTING FOR BUSINESS
Gross margin denotes the profitability of an organisation before the overhead
expenses are incurred. The greater value signifies that more cents are made per dollar of
revenue, which is favourable because greater profit would be available for covering the non-
production costs (Grant 2016). For entertainment industry, gross profit margin provides an
overview of the pricing strategies of the organisations. In case of Crown Resorts, there is a
slight decline in gross margin from 96.01% in 2016 to 95.27% in 2017. Despite such decline,
it could be stated that the organisation is following an aggressive pricing strategy by charging
greater mark-up on the products sold and services rendered to the customers.
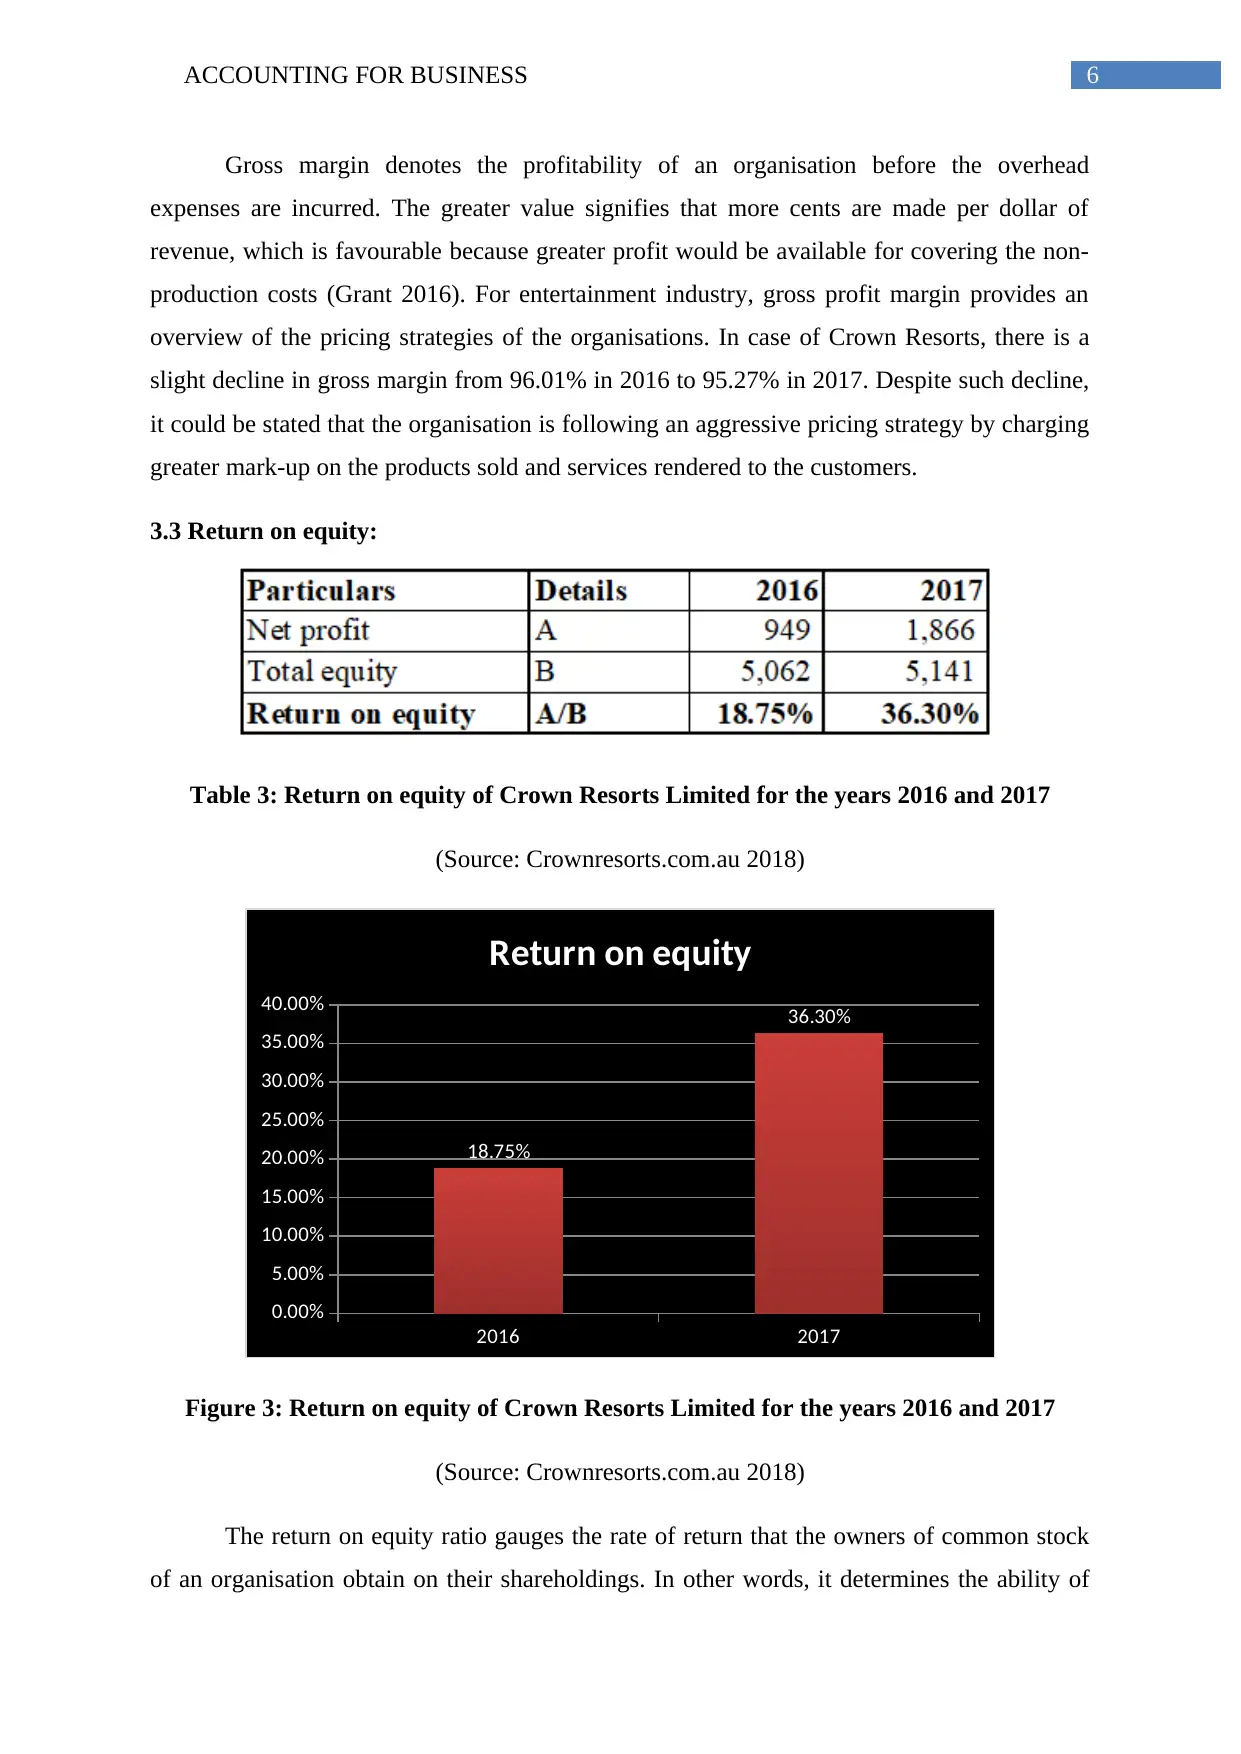
3.3 Return on equity:
Table 3: Return on equity of Crown Resorts Limited for the years 2016 and 2017
(Source: Crownresorts.com.au 2018)
2016 2017
0.00%
5.00%
10.00%
15.00%
20.00%
25.00%
30.00%
35.00%
40.00%
18.75%
36.30%
Return on equity
Figure 3: Return on equity of Crown Resorts Limited for the years 2016 and 2017
(Source: Crownresorts.com.au 2018)
The return on equity ratio gauges the rate of return that the owners of common stock
of an organisation obtain on their shareholdings. In other words, it determines the ability of
Gross margin denotes the profitability of an organisation before the overhead
expenses are incurred. The greater value signifies that more cents are made per dollar of
revenue, which is favourable because greater profit would be available for covering the non-
production costs (Grant 2016). For entertainment industry, gross profit margin provides an
overview of the pricing strategies of the organisations. In case of Crown Resorts, there is a
slight decline in gross margin from 96.01% in 2016 to 95.27% in 2017. Despite such decline,
it could be stated that the organisation is following an aggressive pricing strategy by charging
greater mark-up on the products sold and services rendered to the customers.
3.3 Return on equity:
Table 3: Return on equity of Crown Resorts Limited for the years 2016 and 2017
(Source: Crownresorts.com.au 2018)
2016 2017
0.00%
5.00%
10.00%
15.00%
20.00%
25.00%
30.00%
35.00%
40.00%
18.75%
36.30%
Return on equity
Figure 3: Return on equity of Crown Resorts Limited for the years 2016 and 2017
(Source: Crownresorts.com.au 2018)
The return on equity ratio gauges the rate of return that the owners of common stock
of an organisation obtain on their shareholdings. In other words, it determines the ability of
Paraphrase This Document
Need a fresh take? Get an instant paraphrase of this document with our AI Paraphraser
7ACCOUNTING FOR BUSINESS
an organisation in generating returns on investment made from the shareholders (Ibn-Homaid
and Tijani 2015). The higher the return, the better it is for the organisation. In case of Crown
Resorts Limited, the return on equity has increased significantly from 18.75% in 2016 to
36.30% in 2017, which denotes that the organisation has earned adequate income that has
helped in providing greater returns to the shareholders.
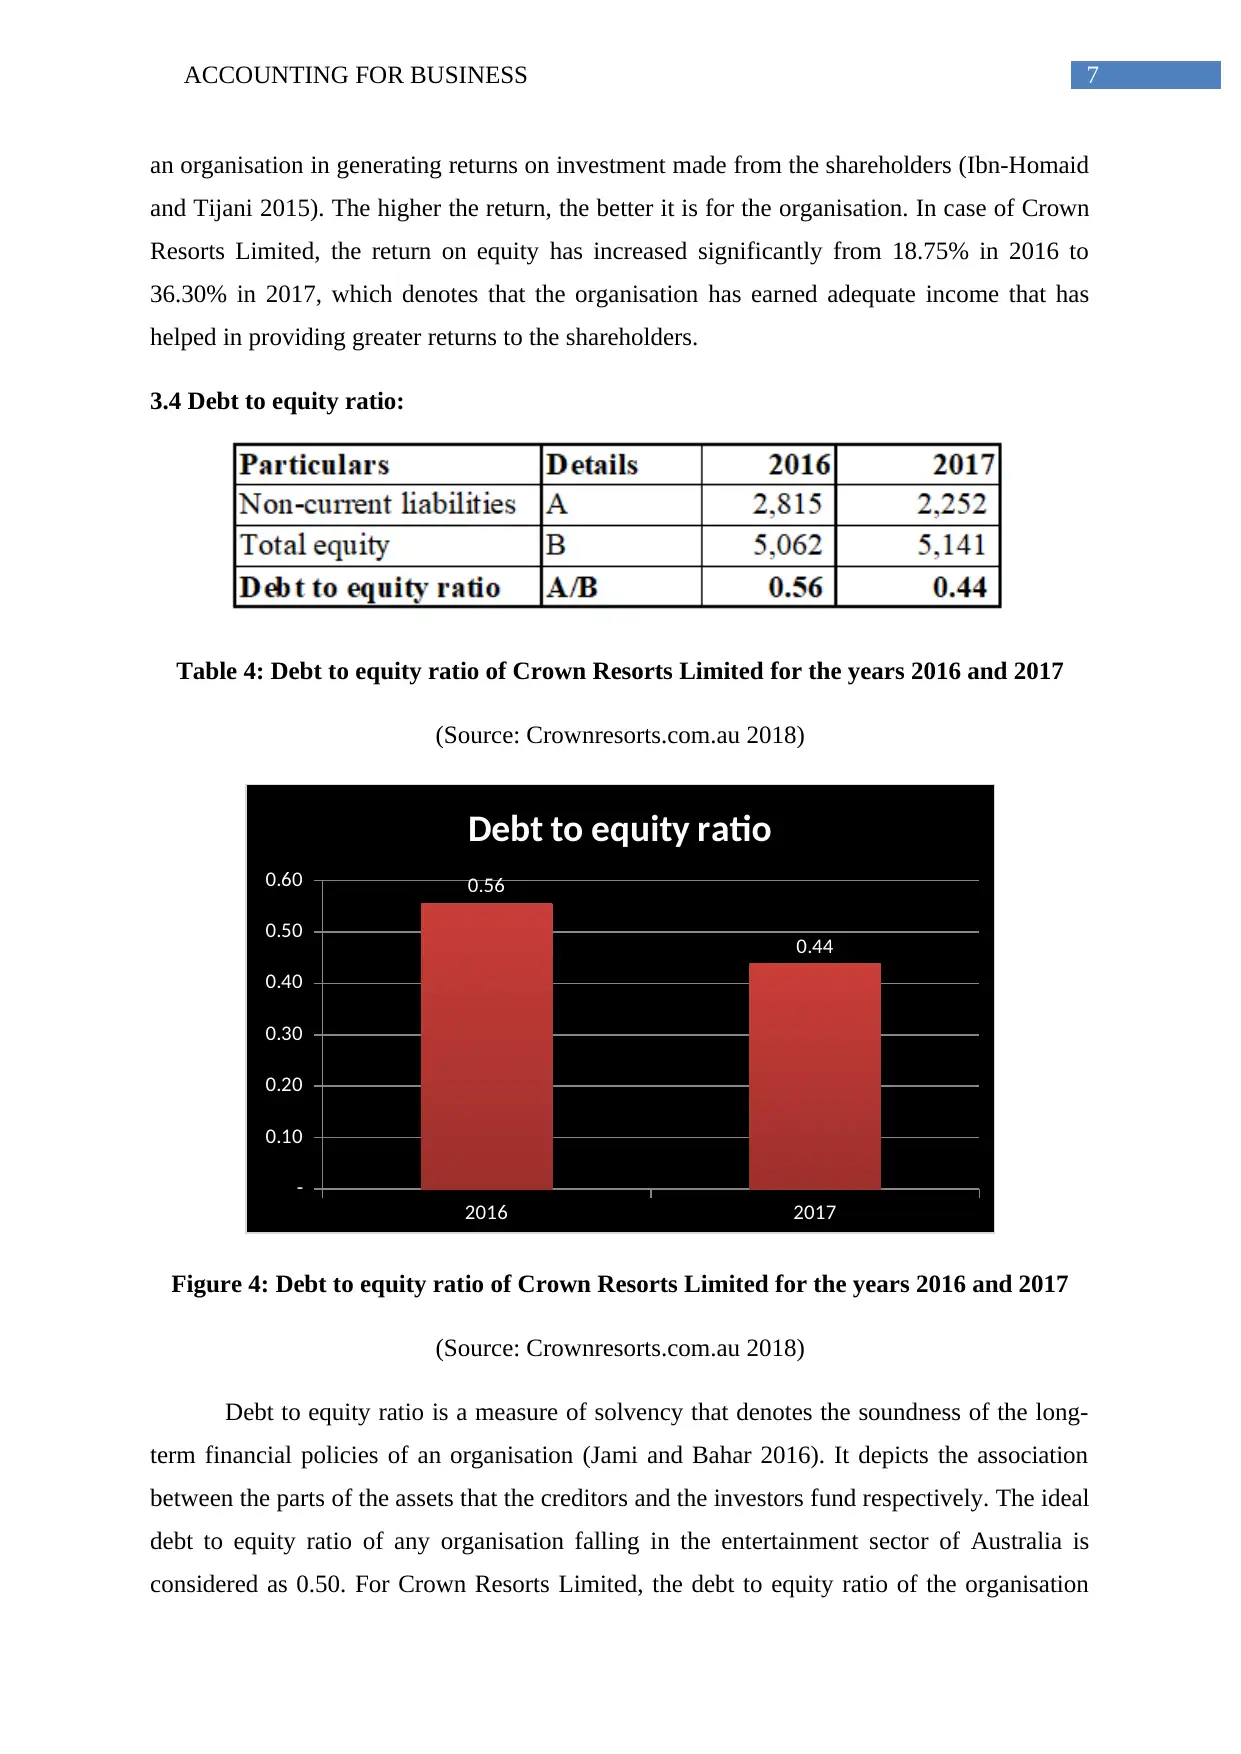
3.4 Debt to equity ratio:
Table 4: Debt to equity ratio of Crown Resorts Limited for the years 2016 and 2017
(Source: Crownresorts.com.au 2018)
2016 2017
-
0.10
0.20
0.30
0.40
0.50
0.60 0.56
0.44
Debt to equity ratio
Figure 4: Debt to equity ratio of Crown Resorts Limited for the years 2016 and 2017
(Source: Crownresorts.com.au 2018)
Debt to equity ratio is a measure of solvency that denotes the soundness of the long-
term financial policies of an organisation (Jami and Bahar 2016). It depicts the association
between the parts of the assets that the creditors and the investors fund respectively. The ideal
debt to equity ratio of any organisation falling in the entertainment sector of Australia is
considered as 0.50. For Crown Resorts Limited, the debt to equity ratio of the organisation
an organisation in generating returns on investment made from the shareholders (Ibn-Homaid
and Tijani 2015). The higher the return, the better it is for the organisation. In case of Crown
Resorts Limited, the return on equity has increased significantly from 18.75% in 2016 to
36.30% in 2017, which denotes that the organisation has earned adequate income that has
helped in providing greater returns to the shareholders.
3.4 Debt to equity ratio:
Table 4: Debt to equity ratio of Crown Resorts Limited for the years 2016 and 2017
(Source: Crownresorts.com.au 2018)
2016 2017
-
0.10
0.20
0.30
0.40
0.50
0.60 0.56
0.44
Debt to equity ratio
Figure 4: Debt to equity ratio of Crown Resorts Limited for the years 2016 and 2017
(Source: Crownresorts.com.au 2018)
Debt to equity ratio is a measure of solvency that denotes the soundness of the long-
term financial policies of an organisation (Jami and Bahar 2016). It depicts the association
between the parts of the assets that the creditors and the investors fund respectively. The ideal
debt to equity ratio of any organisation falling in the entertainment sector of Australia is
considered as 0.50. For Crown Resorts Limited, the debt to equity ratio of the organisation
8ACCOUNTING FOR BUSINESS
has fallen from 0.56 in 2016 to 0.44 in 2017. This signifies that the organisation obtains funds
by issuing equity shares in the market, which has helped in minimising long-term debt
burden. Hence, in terms of solvency, Crown Resorts Limited is in a favourable position in the
Australian market.
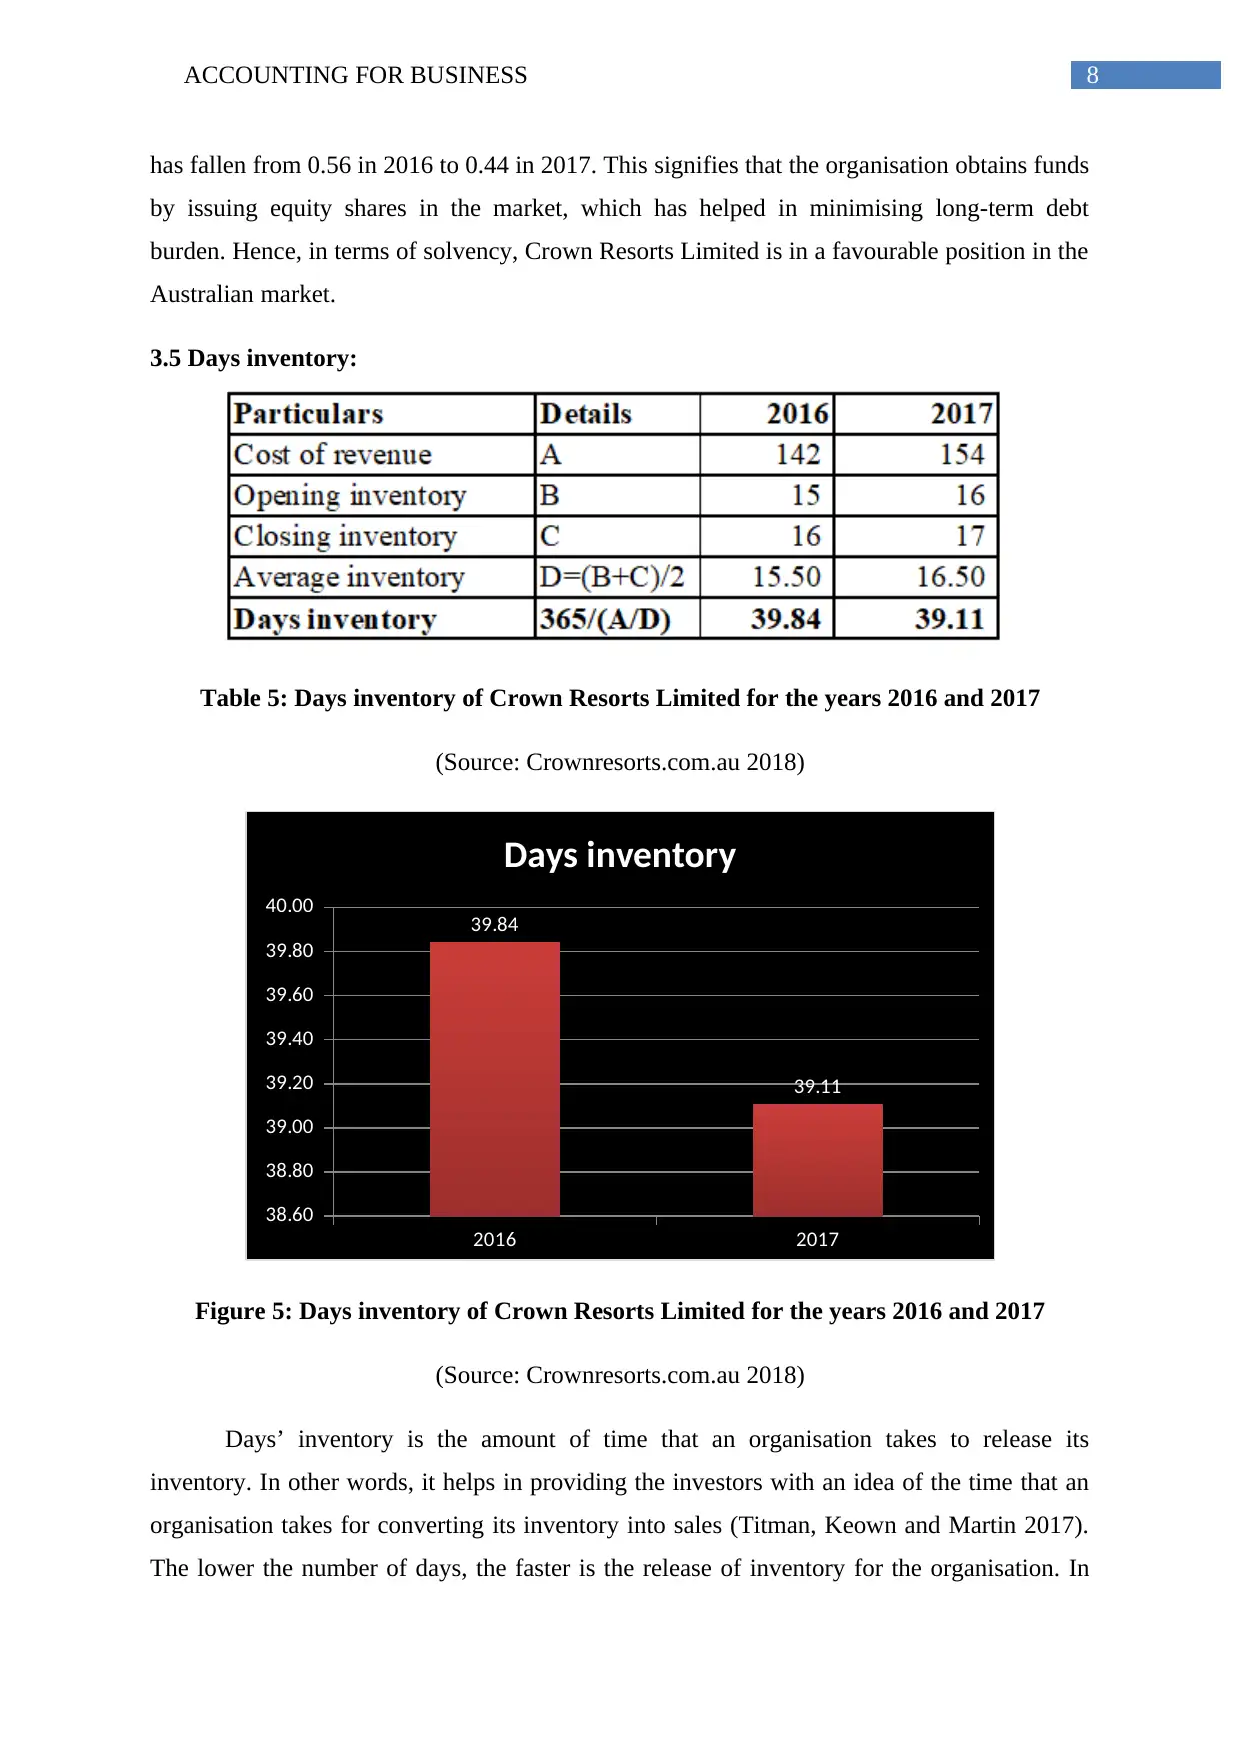
3.5 Days inventory:
Table 5: Days inventory of Crown Resorts Limited for the years 2016 and 2017
(Source: Crownresorts.com.au 2018)
2016 2017
38.60
38.80
39.00
39.20
39.40
39.60
39.80
40.00 39.84
39.11
Days inventory
Figure 5: Days inventory of Crown Resorts Limited for the years 2016 and 2017
(Source: Crownresorts.com.au 2018)
Days’ inventory is the amount of time that an organisation takes to release its
inventory. In other words, it helps in providing the investors with an idea of the time that an
organisation takes for converting its inventory into sales (Titman, Keown and Martin 2017).
The lower the number of days, the faster is the release of inventory for the organisation. In
has fallen from 0.56 in 2016 to 0.44 in 2017. This signifies that the organisation obtains funds
by issuing equity shares in the market, which has helped in minimising long-term debt
burden. Hence, in terms of solvency, Crown Resorts Limited is in a favourable position in the
Australian market.
3.5 Days inventory:
Table 5: Days inventory of Crown Resorts Limited for the years 2016 and 2017
(Source: Crownresorts.com.au 2018)
2016 2017
38.60
38.80
39.00
39.20
39.40
39.60
39.80
40.00 39.84
39.11
Days inventory
Figure 5: Days inventory of Crown Resorts Limited for the years 2016 and 2017
(Source: Crownresorts.com.au 2018)
Days’ inventory is the amount of time that an organisation takes to release its
inventory. In other words, it helps in providing the investors with an idea of the time that an
organisation takes for converting its inventory into sales (Titman, Keown and Martin 2017).
The lower the number of days, the faster is the release of inventory for the organisation. In
⊘ This is a preview!⊘
Do you want full access?
Subscribe today to unlock all pages.
Trusted by 1+ million students worldwide
9ACCOUNTING FOR BUSINESS
case of Crown Resorts Limited, it has fallen from 39.84 days in 2016 to 39.11 days in 2017,
which signifies that the inventories are released at a faster rate due to rising demand in the
market. Thus, from the efficiency point of view, it could be stated that Crown Resorts has
improved its position in the Australian market compared to 2016.
4.0 Analysis and comparison of Crown Resorts Limited with Tatts Group Limited:
For evaluating the financial position and performance of Crown Resorts Limited more
effectively, it is compared with its key competitor, Tatts Group Limited. It provides gambling
services through lotteries, wavering and gaming having operational footprint throughout
Australia and New Zealand, except Western Australia (Tatts Group 2018). The evaluation is
made by considering three ratios, which include gross margin, quick ratio and debt to equity
ratio.
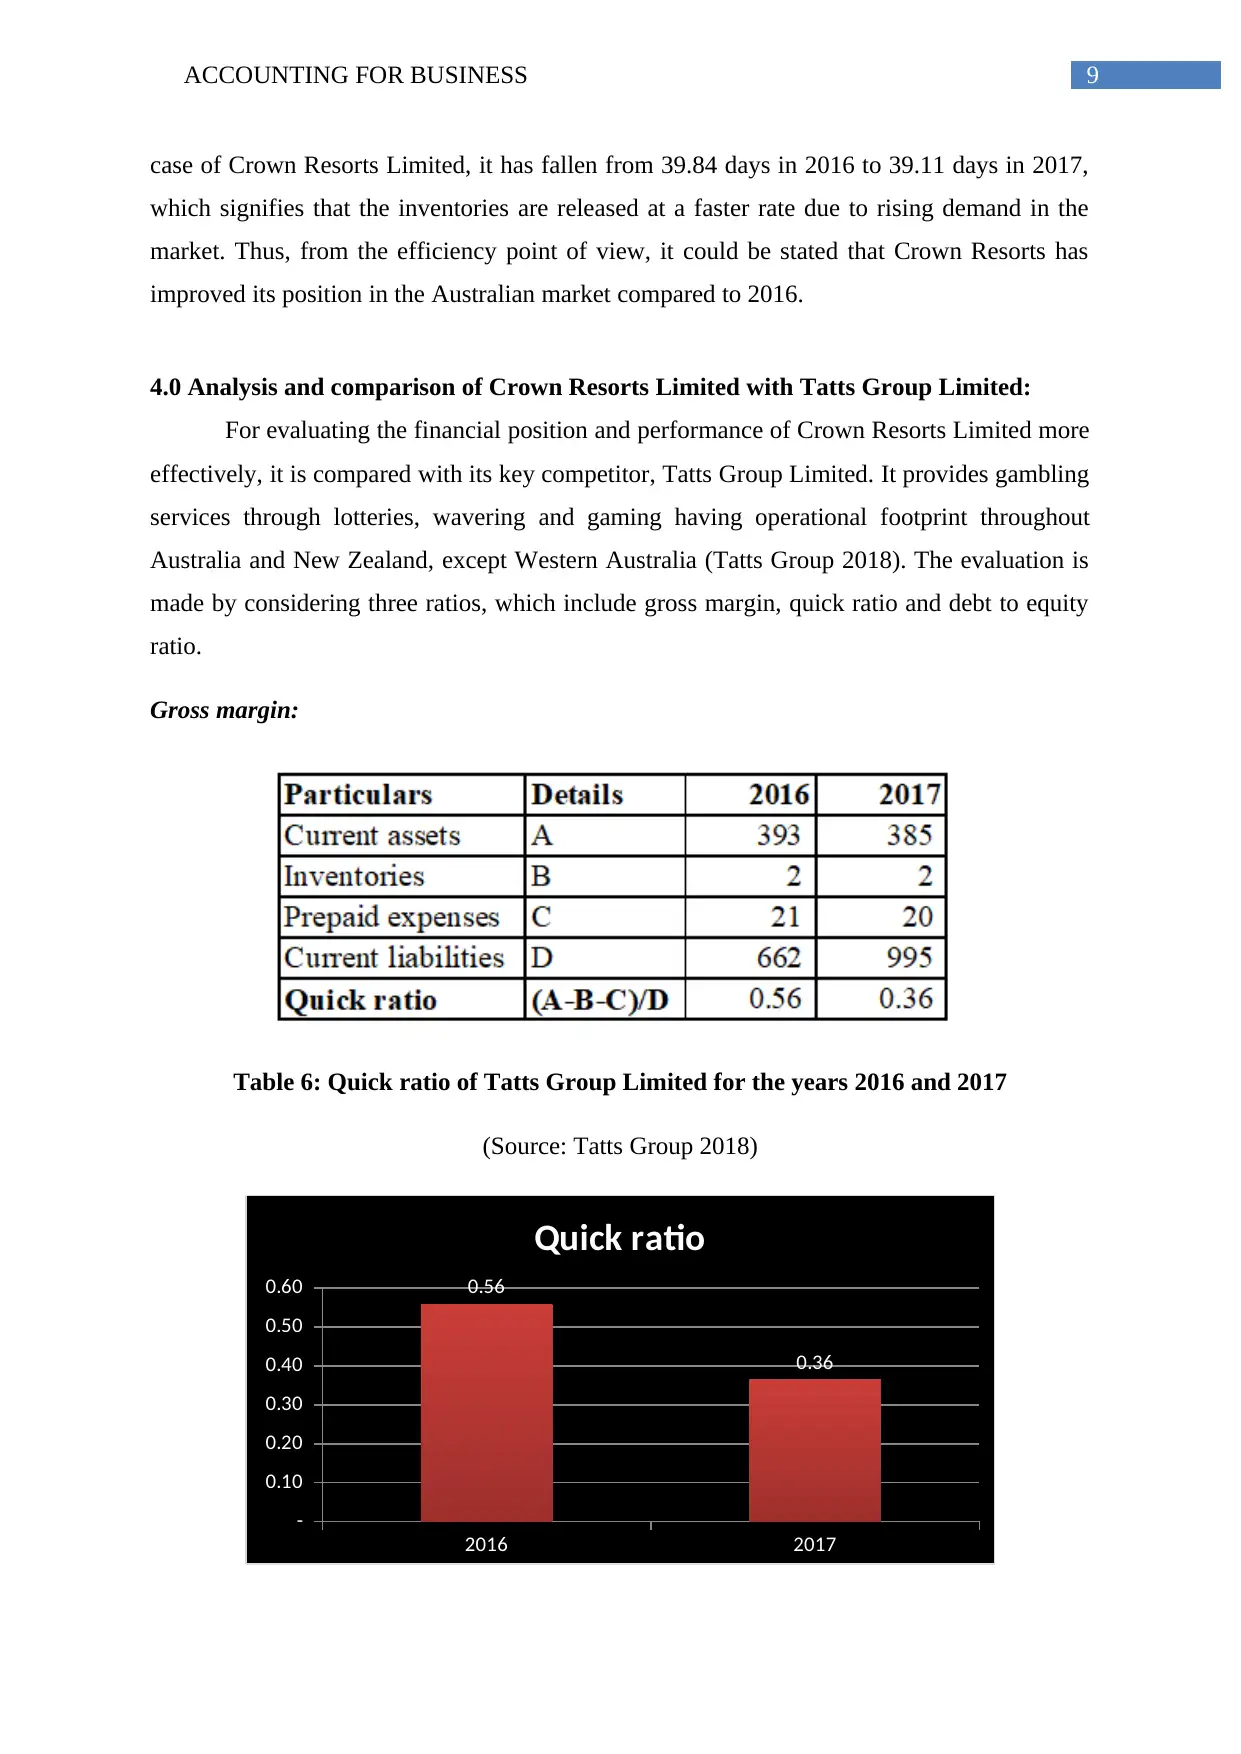
Gross margin:
Table 6: Quick ratio of Tatts Group Limited for the years 2016 and 2017
(Source: Tatts Group 2018)
2016 2017
-
0.10
0.20
0.30
0.40
0.50
0.60 0.56
0.36
Quick ratio
case of Crown Resorts Limited, it has fallen from 39.84 days in 2016 to 39.11 days in 2017,
which signifies that the inventories are released at a faster rate due to rising demand in the
market. Thus, from the efficiency point of view, it could be stated that Crown Resorts has
improved its position in the Australian market compared to 2016.
4.0 Analysis and comparison of Crown Resorts Limited with Tatts Group Limited:
For evaluating the financial position and performance of Crown Resorts Limited more
effectively, it is compared with its key competitor, Tatts Group Limited. It provides gambling
services through lotteries, wavering and gaming having operational footprint throughout
Australia and New Zealand, except Western Australia (Tatts Group 2018). The evaluation is
made by considering three ratios, which include gross margin, quick ratio and debt to equity
ratio.
Gross margin:
Table 6: Quick ratio of Tatts Group Limited for the years 2016 and 2017
(Source: Tatts Group 2018)
2016 2017
-
0.10
0.20
0.30
0.40
0.50
0.60 0.56
0.36
Quick ratio
Paraphrase This Document
Need a fresh take? Get an instant paraphrase of this document with our AI Paraphraser
10ACCOUNTING FOR BUSINESS
Figure 6: Quick ratio of Tatts Group Limited for the years 2016 and 2017
(Source: Tatts Group 2018)
According to the above figure, it is inherent that there is significant decline in quick
ratio over the years and it is well below the ideal standard and that of its competitor, Crown
Resorts Limited. This denotes that Tatts Group is struggling to meet its existing dues with the
available short-term asset base. Hence, it could be stated that in terms of liquidity, the
position of Crown Resorts is much better compared to Tatts Group.
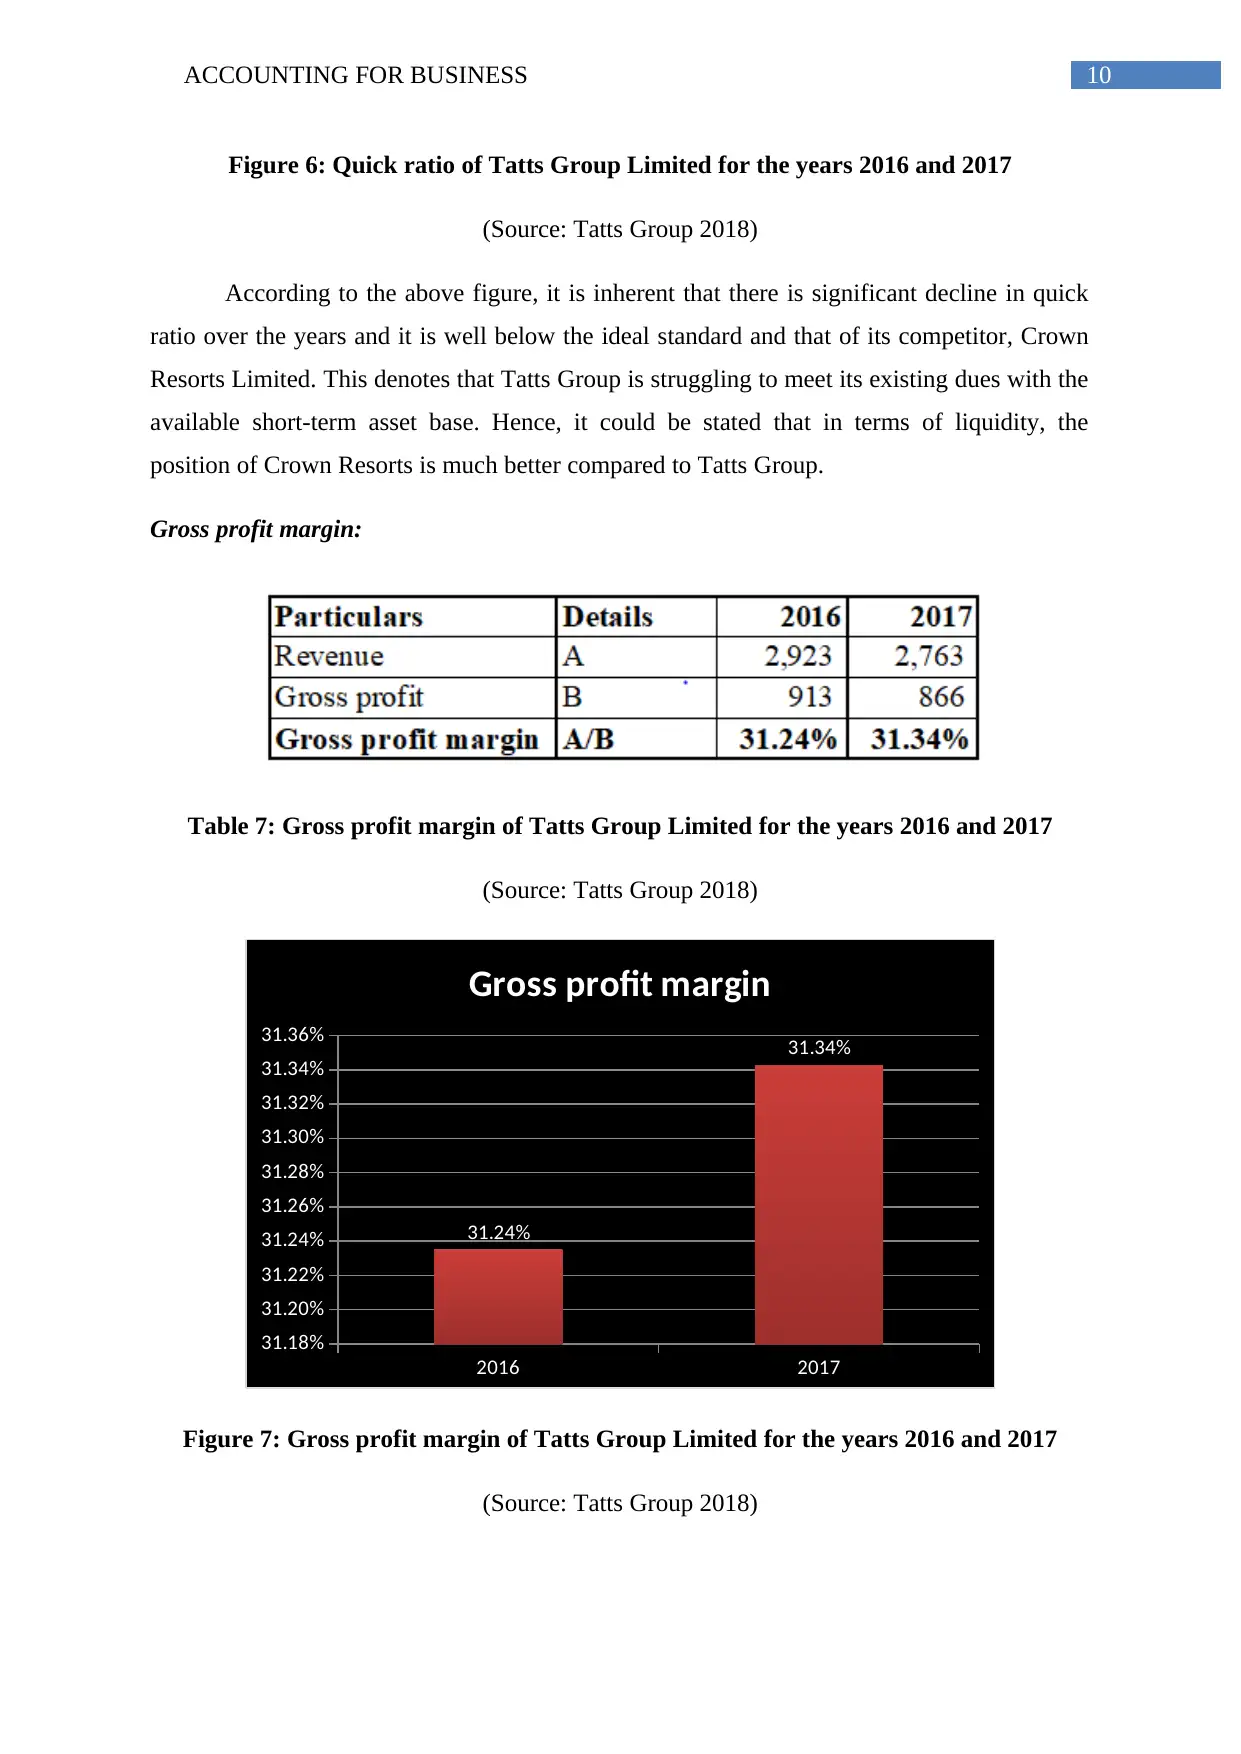
Gross profit margin:
Table 7: Gross profit margin of Tatts Group Limited for the years 2016 and 2017
(Source: Tatts Group 2018)
2016 2017
31.18%
31.20%
31.22%
31.24%
31.26%
31.28%
31.30%
31.32%
31.34%
31.36%
31.24%
31.34%
Gross profit margin
Figure 7: Gross profit margin of Tatts Group Limited for the years 2016 and 2017
(Source: Tatts Group 2018)
Figure 6: Quick ratio of Tatts Group Limited for the years 2016 and 2017
(Source: Tatts Group 2018)
According to the above figure, it is inherent that there is significant decline in quick
ratio over the years and it is well below the ideal standard and that of its competitor, Crown
Resorts Limited. This denotes that Tatts Group is struggling to meet its existing dues with the
available short-term asset base. Hence, it could be stated that in terms of liquidity, the
position of Crown Resorts is much better compared to Tatts Group.
Gross profit margin:
Table 7: Gross profit margin of Tatts Group Limited for the years 2016 and 2017
(Source: Tatts Group 2018)
2016 2017
31.18%
31.20%
31.22%
31.24%
31.26%
31.28%
31.30%
31.32%
31.34%
31.36%
31.24%
31.34%
Gross profit margin
Figure 7: Gross profit margin of Tatts Group Limited for the years 2016 and 2017
(Source: Tatts Group 2018)
11ACCOUNTING FOR BUSINESS
Based on the above table, it could be cited that the gross profit margin of the
organisation has increased from 31.24% in 2016 to 31.34% in 2017; however, it is much
lower compared to Crown Resorts Limited due to lower pricing structure (Vogel 2014).
Hence, from the profitability viewpoint, Crown Resorts Limited is enjoying competitive edge
over Tatts Group Limited in the Australian market.
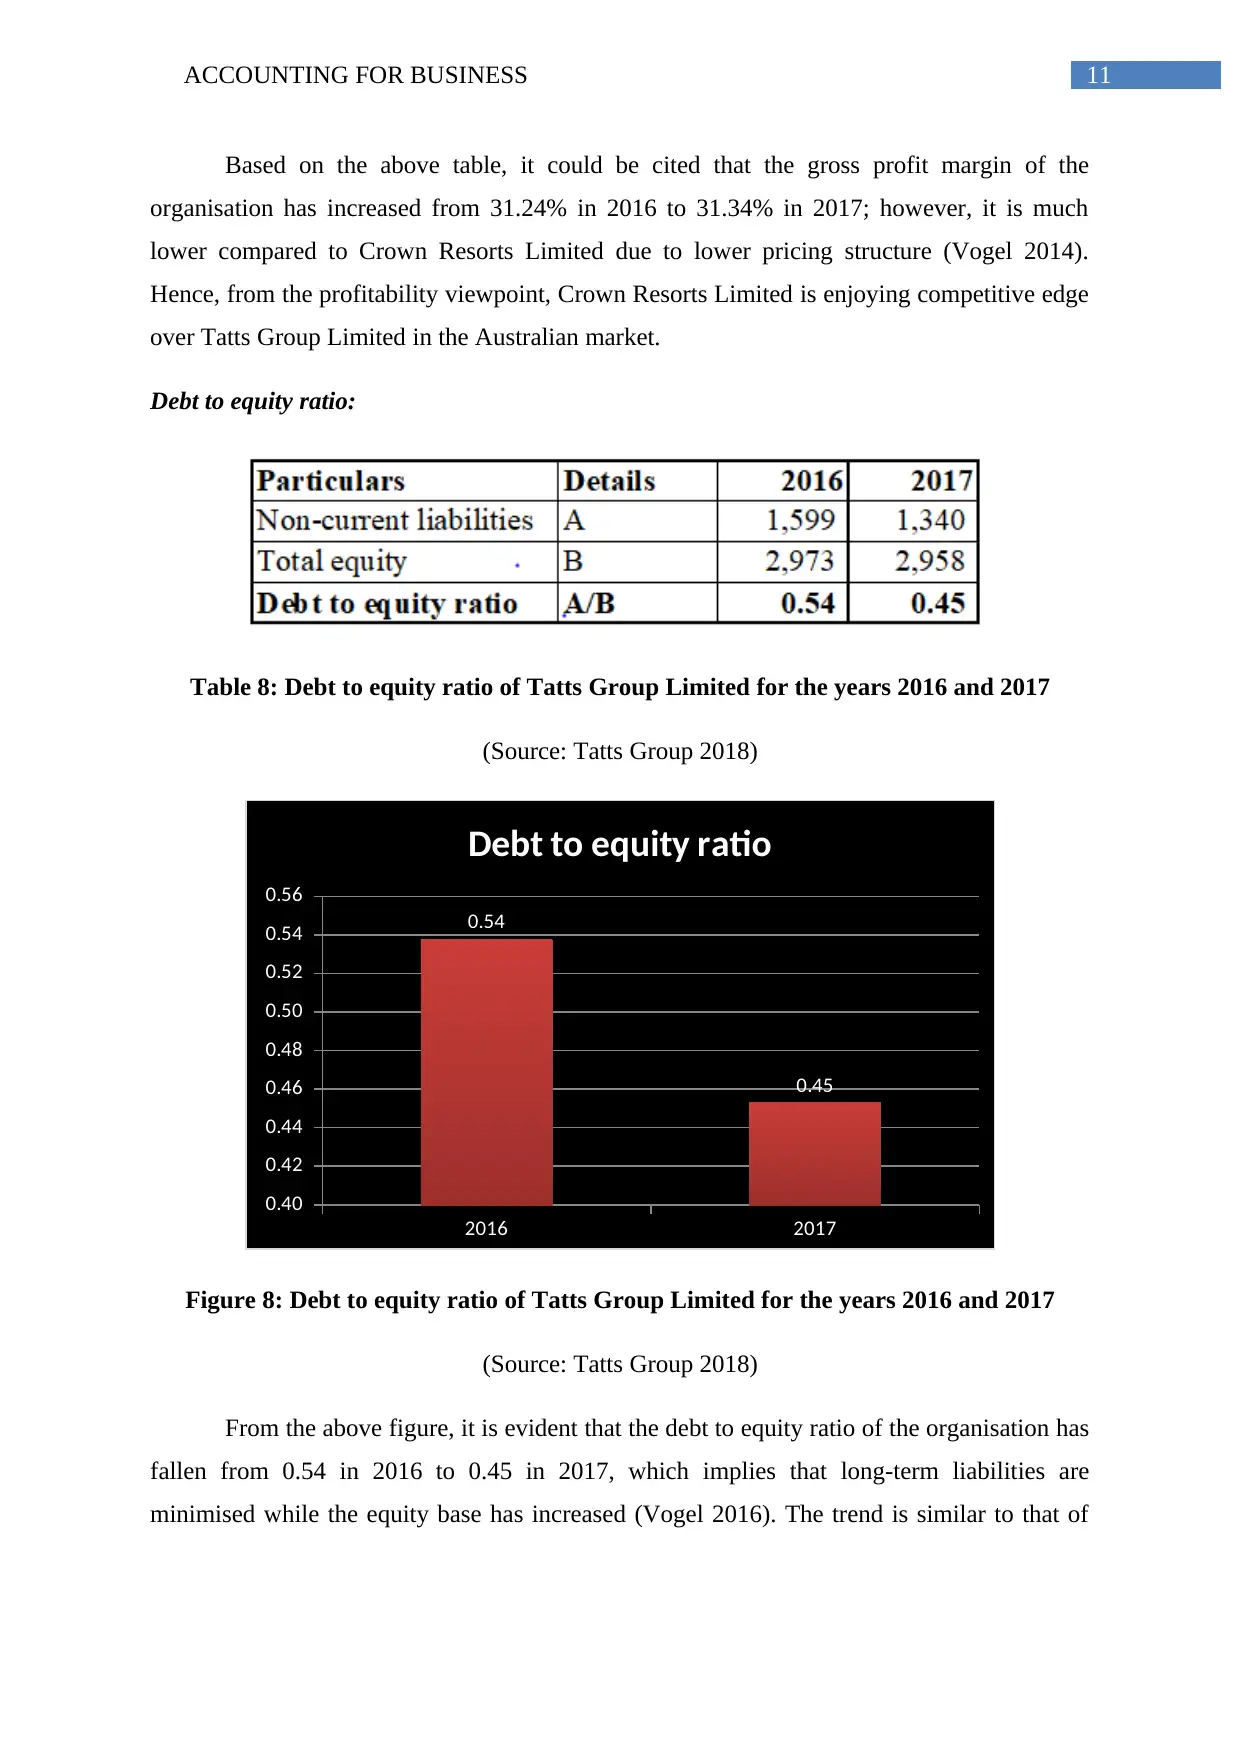
Debt to equity ratio:
Table 8: Debt to equity ratio of Tatts Group Limited for the years 2016 and 2017
(Source: Tatts Group 2018)
2016 2017
0.40
0.42
0.44
0.46
0.48
0.50
0.52
0.54
0.56
0.54
0.45
Debt to equity ratio
Figure 8: Debt to equity ratio of Tatts Group Limited for the years 2016 and 2017
(Source: Tatts Group 2018)
From the above figure, it is evident that the debt to equity ratio of the organisation has
fallen from 0.54 in 2016 to 0.45 in 2017, which implies that long-term liabilities are
minimised while the equity base has increased (Vogel 2016). The trend is similar to that of
Based on the above table, it could be cited that the gross profit margin of the
organisation has increased from 31.24% in 2016 to 31.34% in 2017; however, it is much
lower compared to Crown Resorts Limited due to lower pricing structure (Vogel 2014).
Hence, from the profitability viewpoint, Crown Resorts Limited is enjoying competitive edge
over Tatts Group Limited in the Australian market.
Debt to equity ratio:
Table 8: Debt to equity ratio of Tatts Group Limited for the years 2016 and 2017
(Source: Tatts Group 2018)
2016 2017
0.40
0.42
0.44
0.46
0.48
0.50
0.52
0.54
0.56
0.54
0.45
Debt to equity ratio
Figure 8: Debt to equity ratio of Tatts Group Limited for the years 2016 and 2017
(Source: Tatts Group 2018)
From the above figure, it is evident that the debt to equity ratio of the organisation has
fallen from 0.54 in 2016 to 0.45 in 2017, which implies that long-term liabilities are
minimised while the equity base has increased (Vogel 2016). The trend is similar to that of
⊘ This is a preview!⊘
Do you want full access?
Subscribe today to unlock all pages.
Trusted by 1+ million students worldwide
1 out of 14
Related Documents


Your All-in-One AI-Powered Toolkit for Academic Success.
+13062052269
info@desklib.com
Available 24*7 on WhatsApp / Email
![[object Object]](/_next/static/media/star-bottom.7253800d.svg)
Unlock your academic potential
Copyright © 2020–2026 A2Z Services. All Rights Reserved. Developed and managed by ZUCOL.