Financial Analysis of Regional Express Company - Finance Report
VerifiedAdded on 2020/05/11
|18
|2153
|53
Report
AI Summary
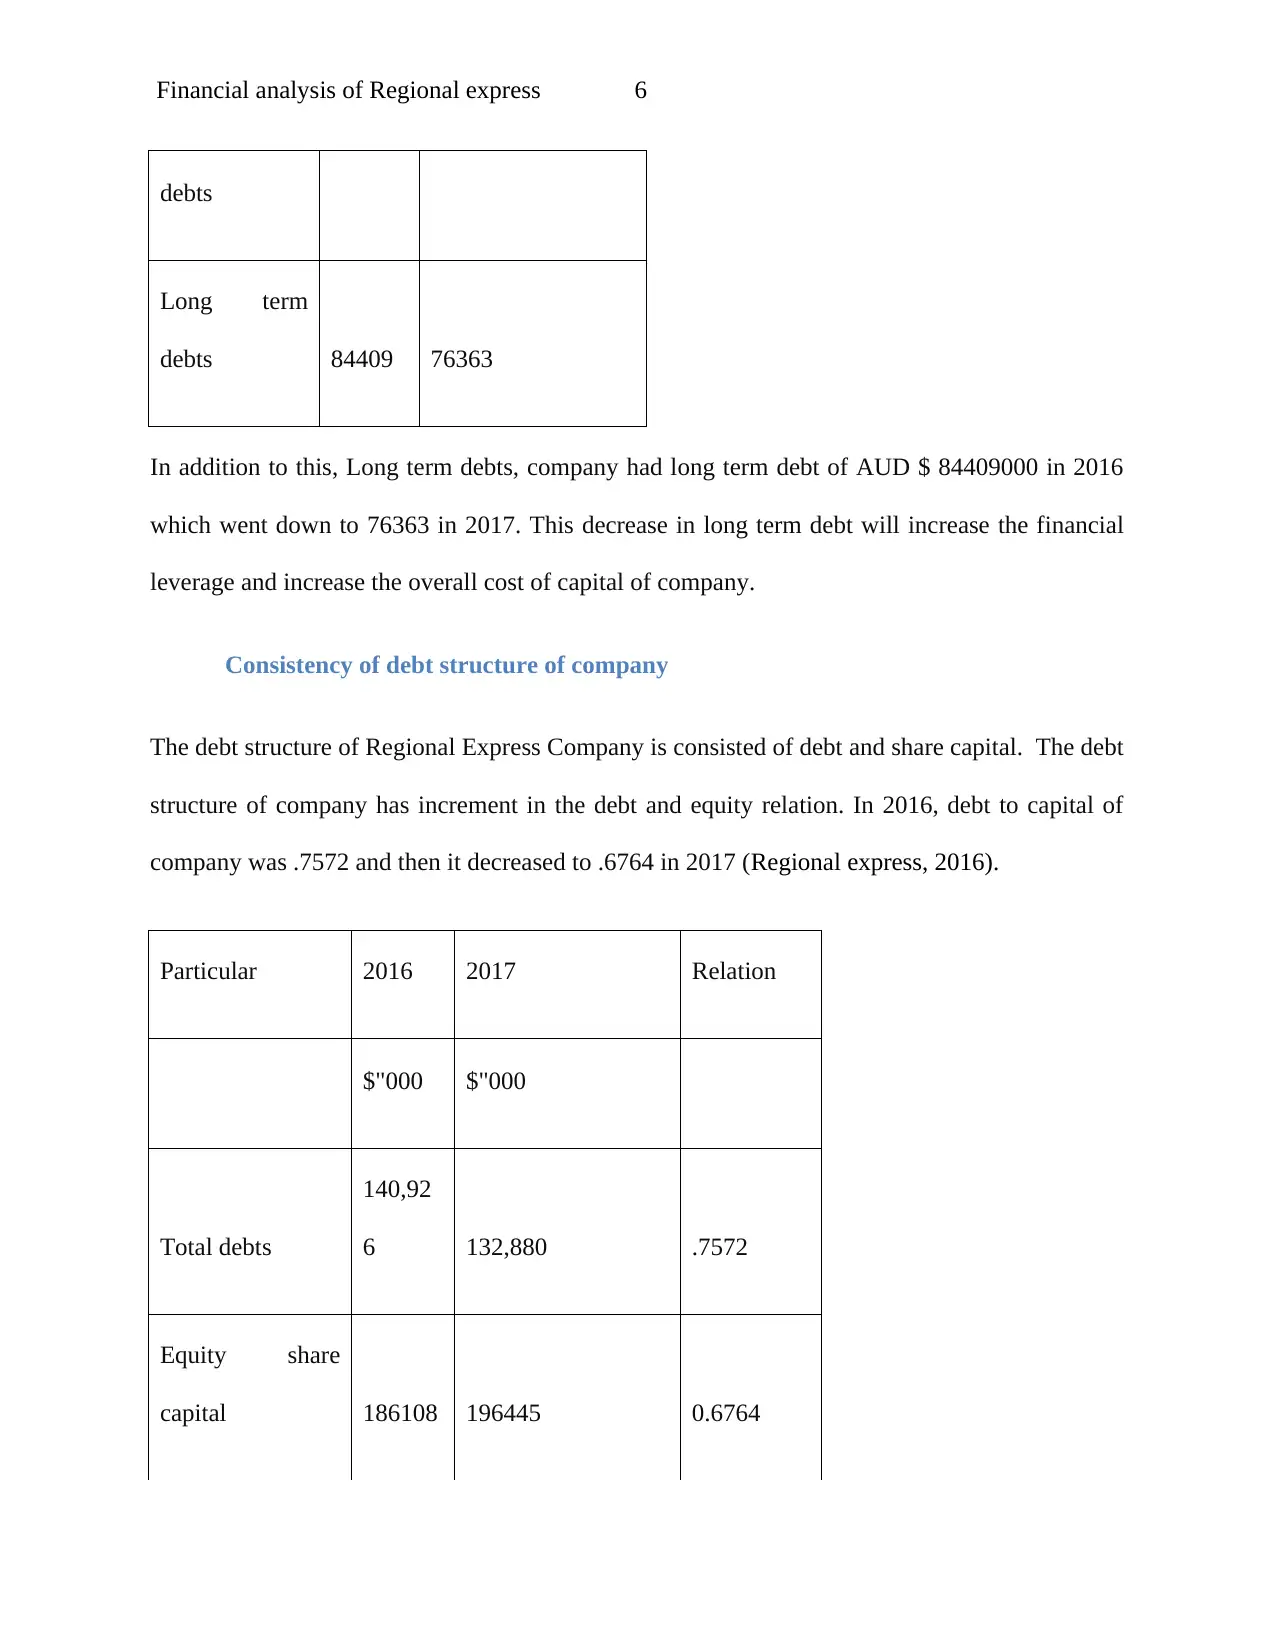
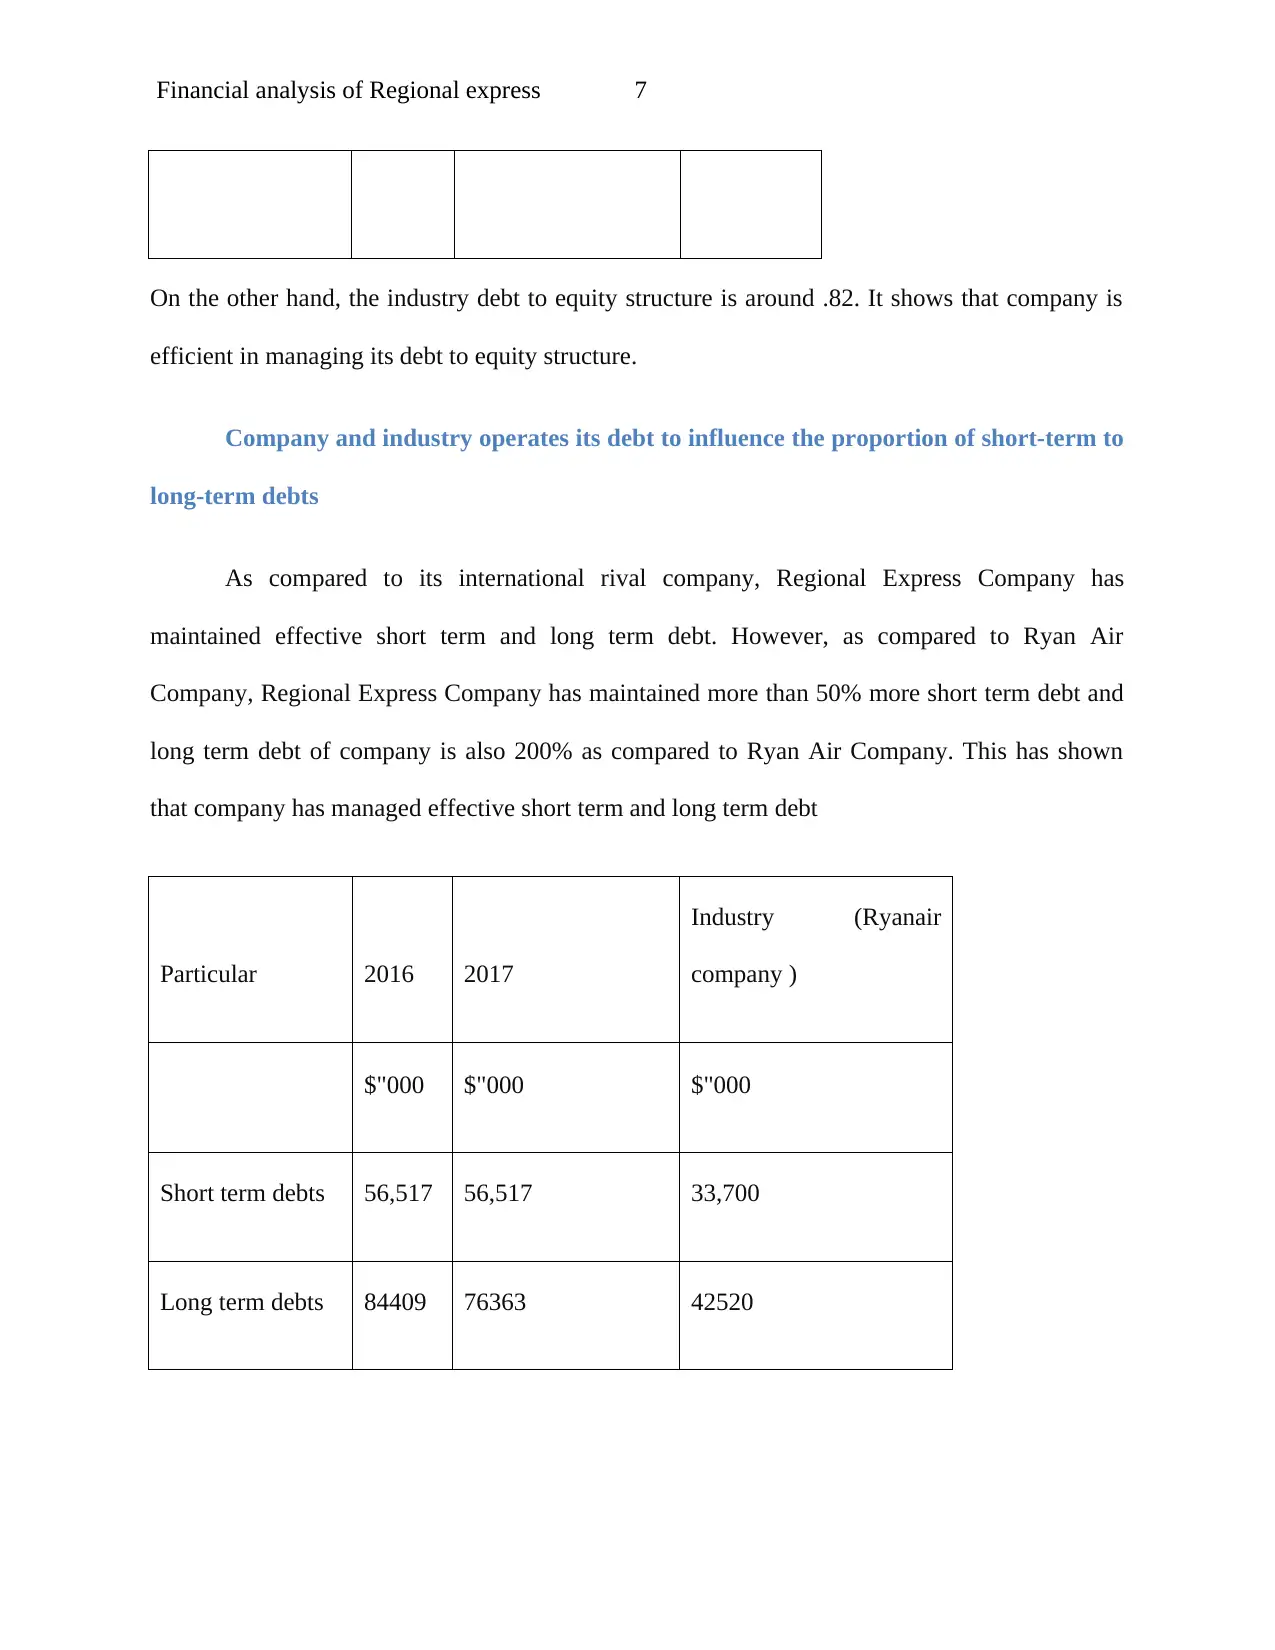
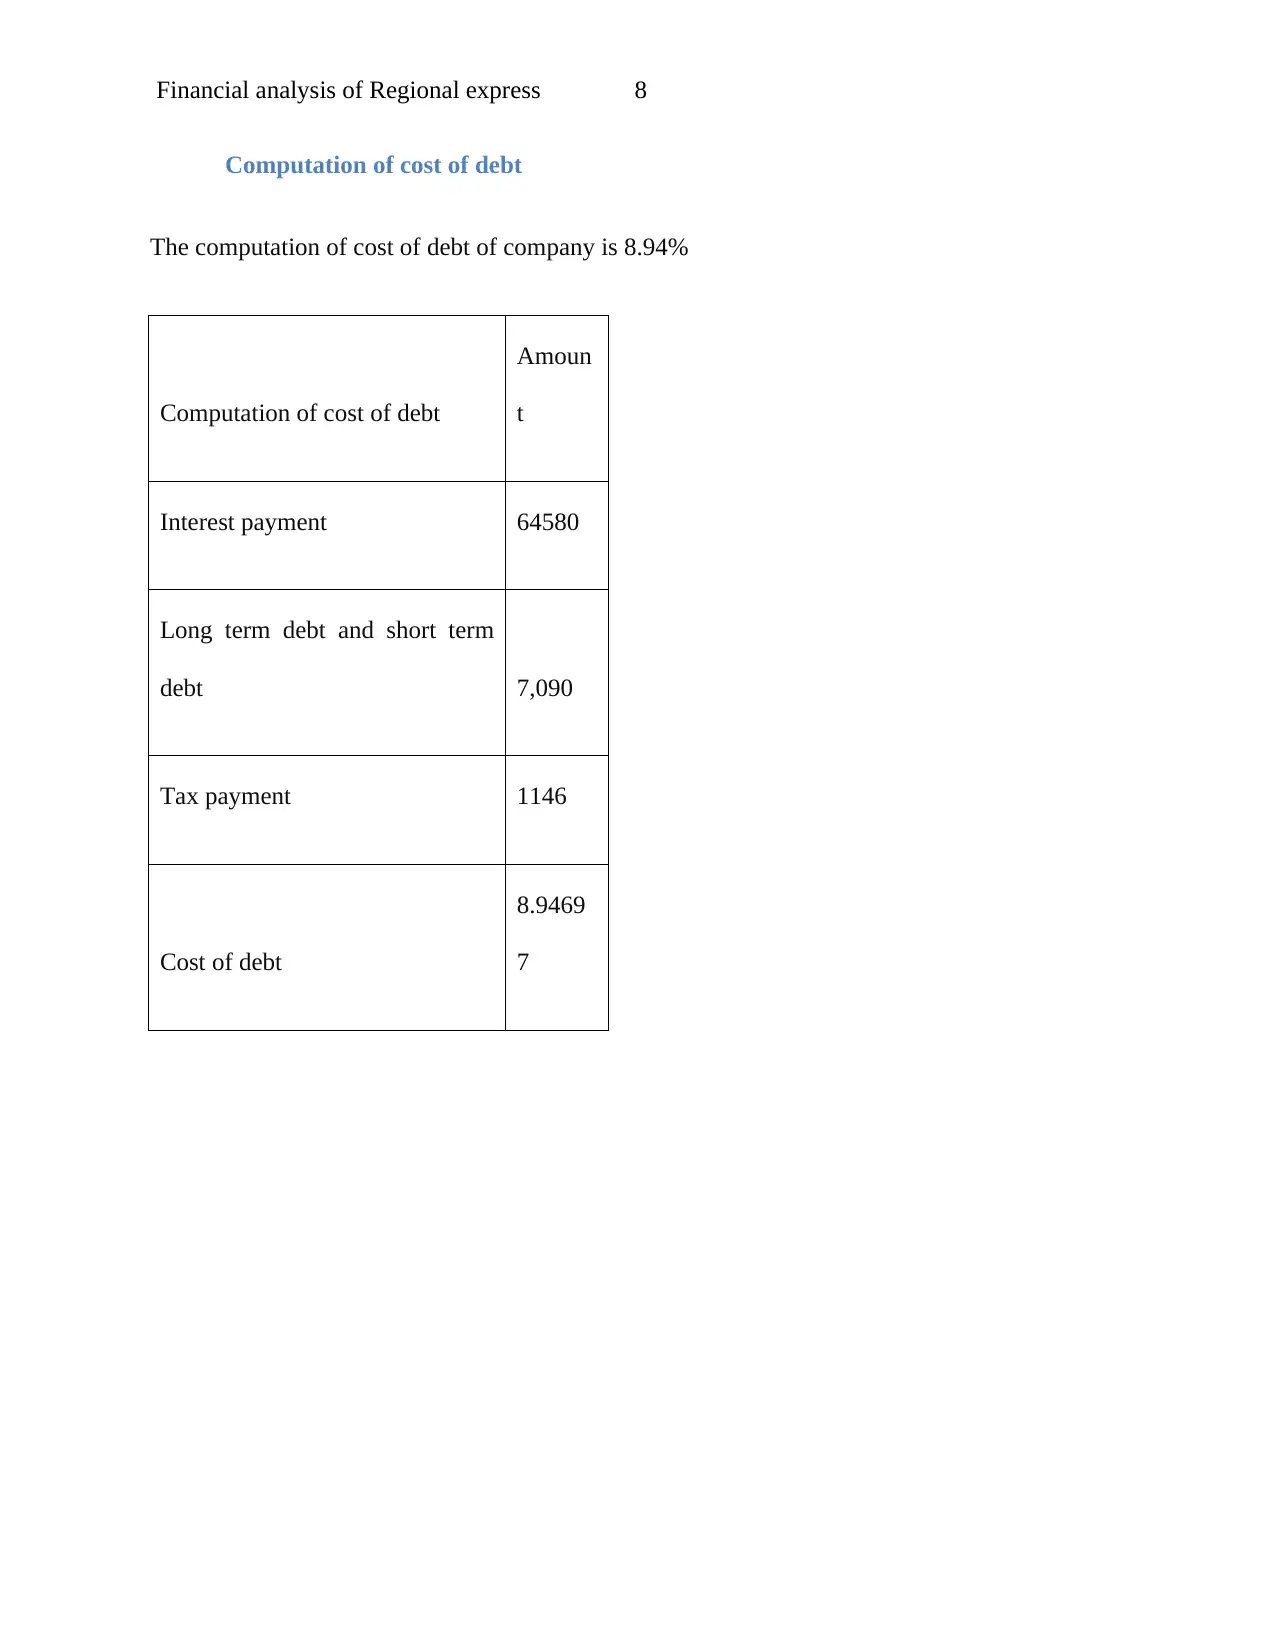
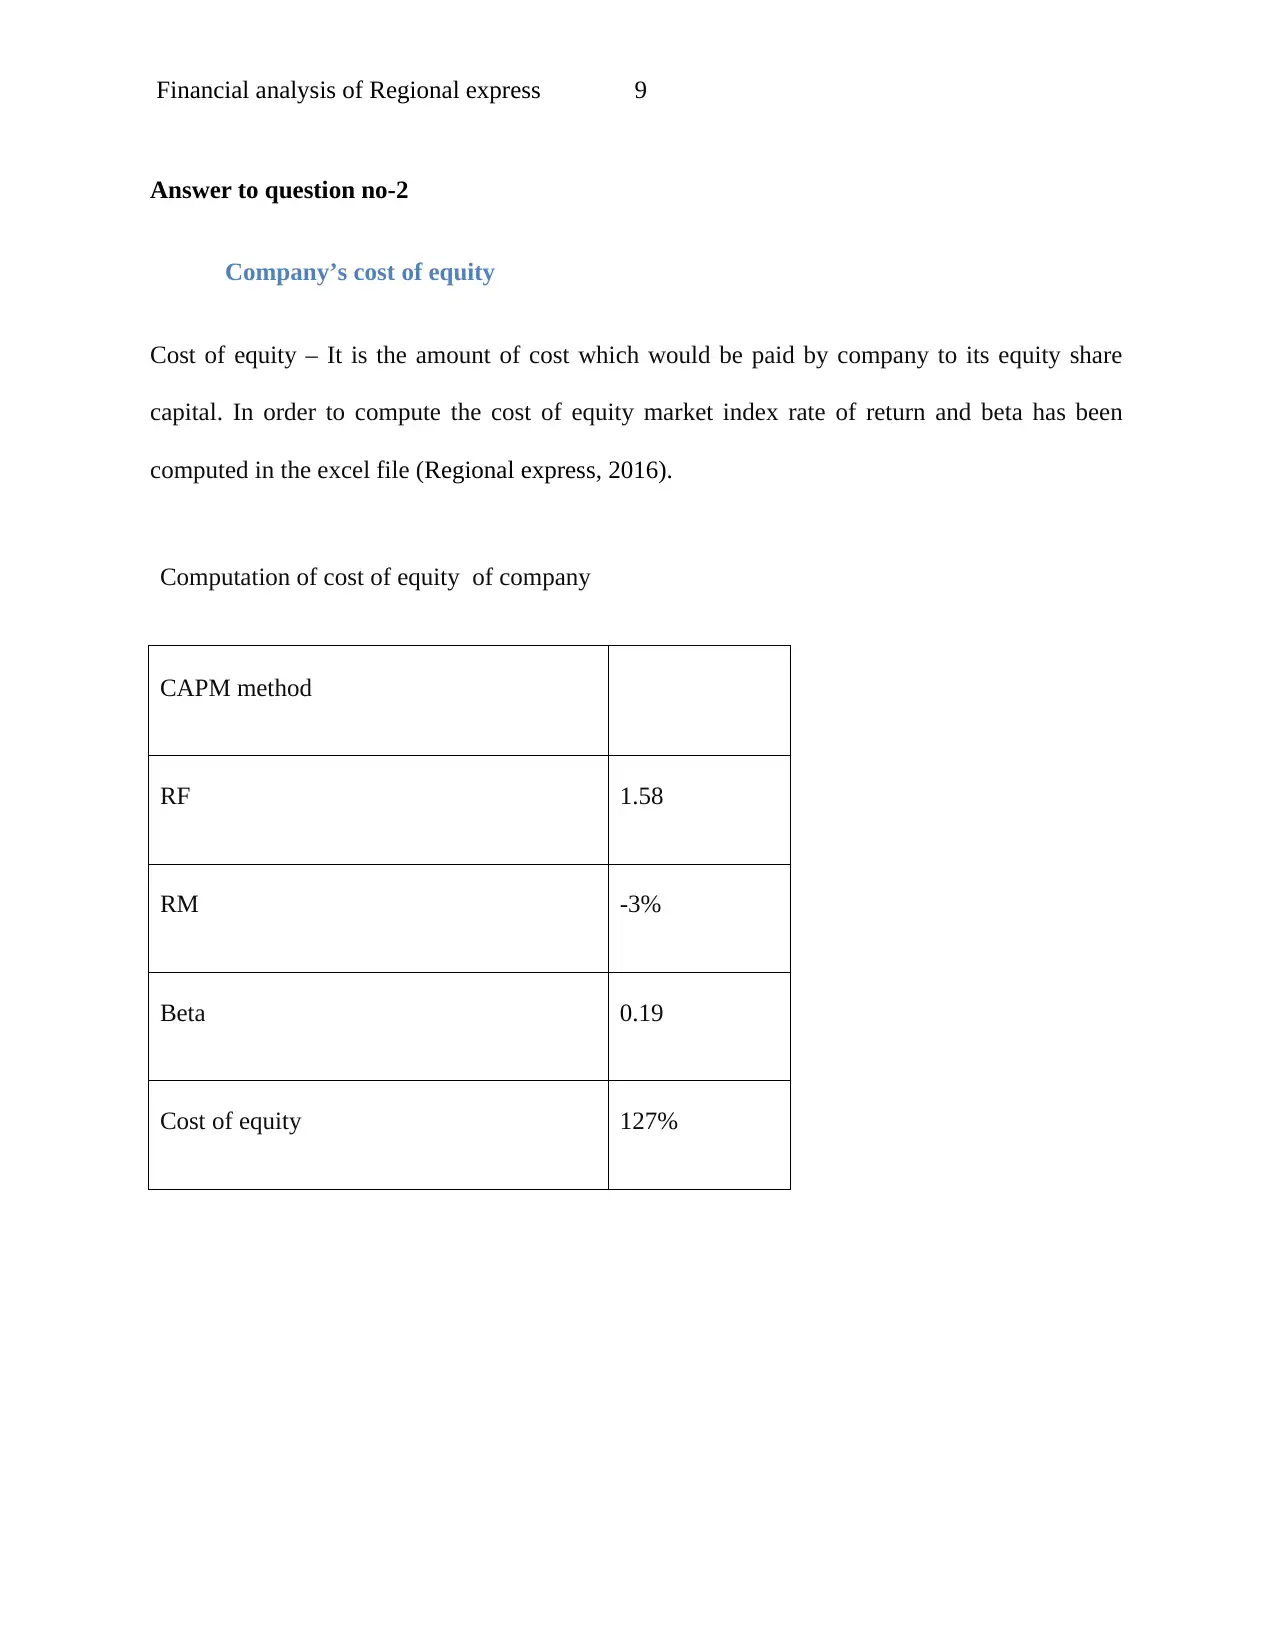
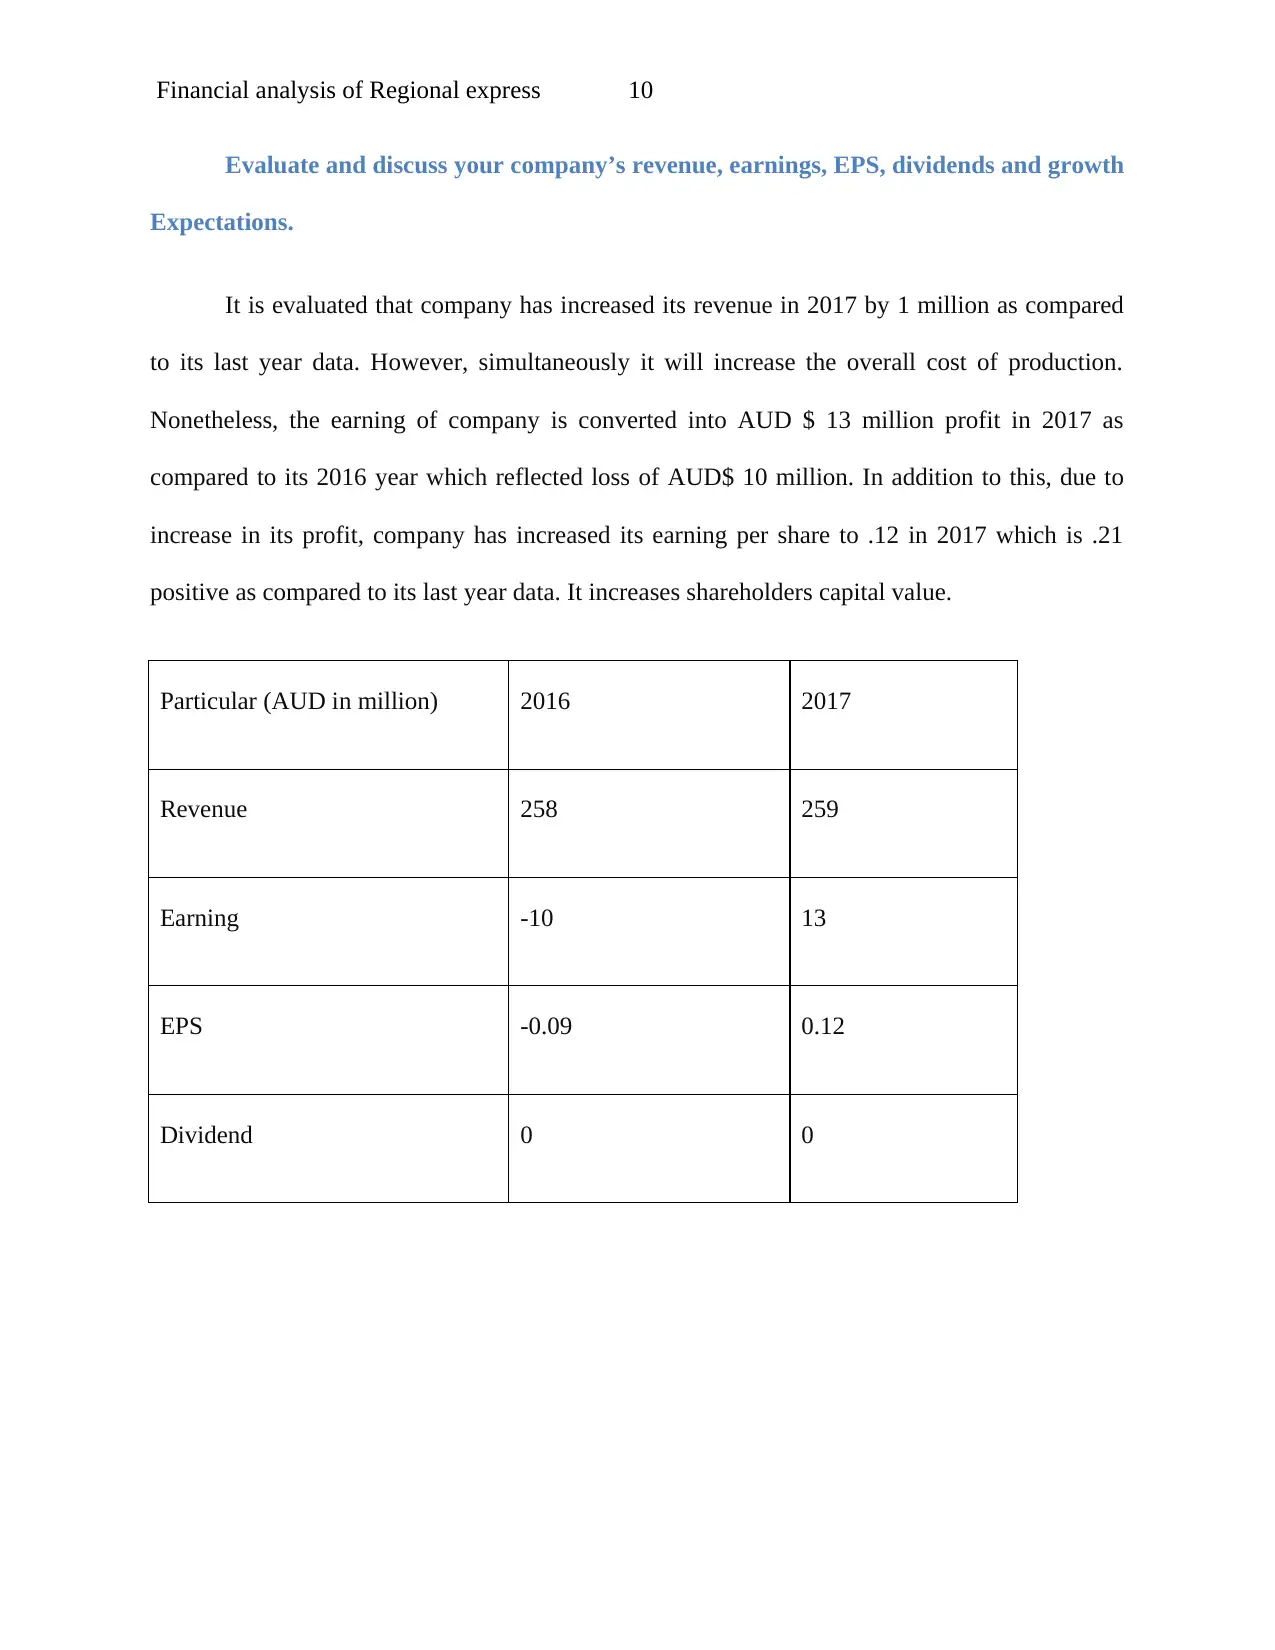
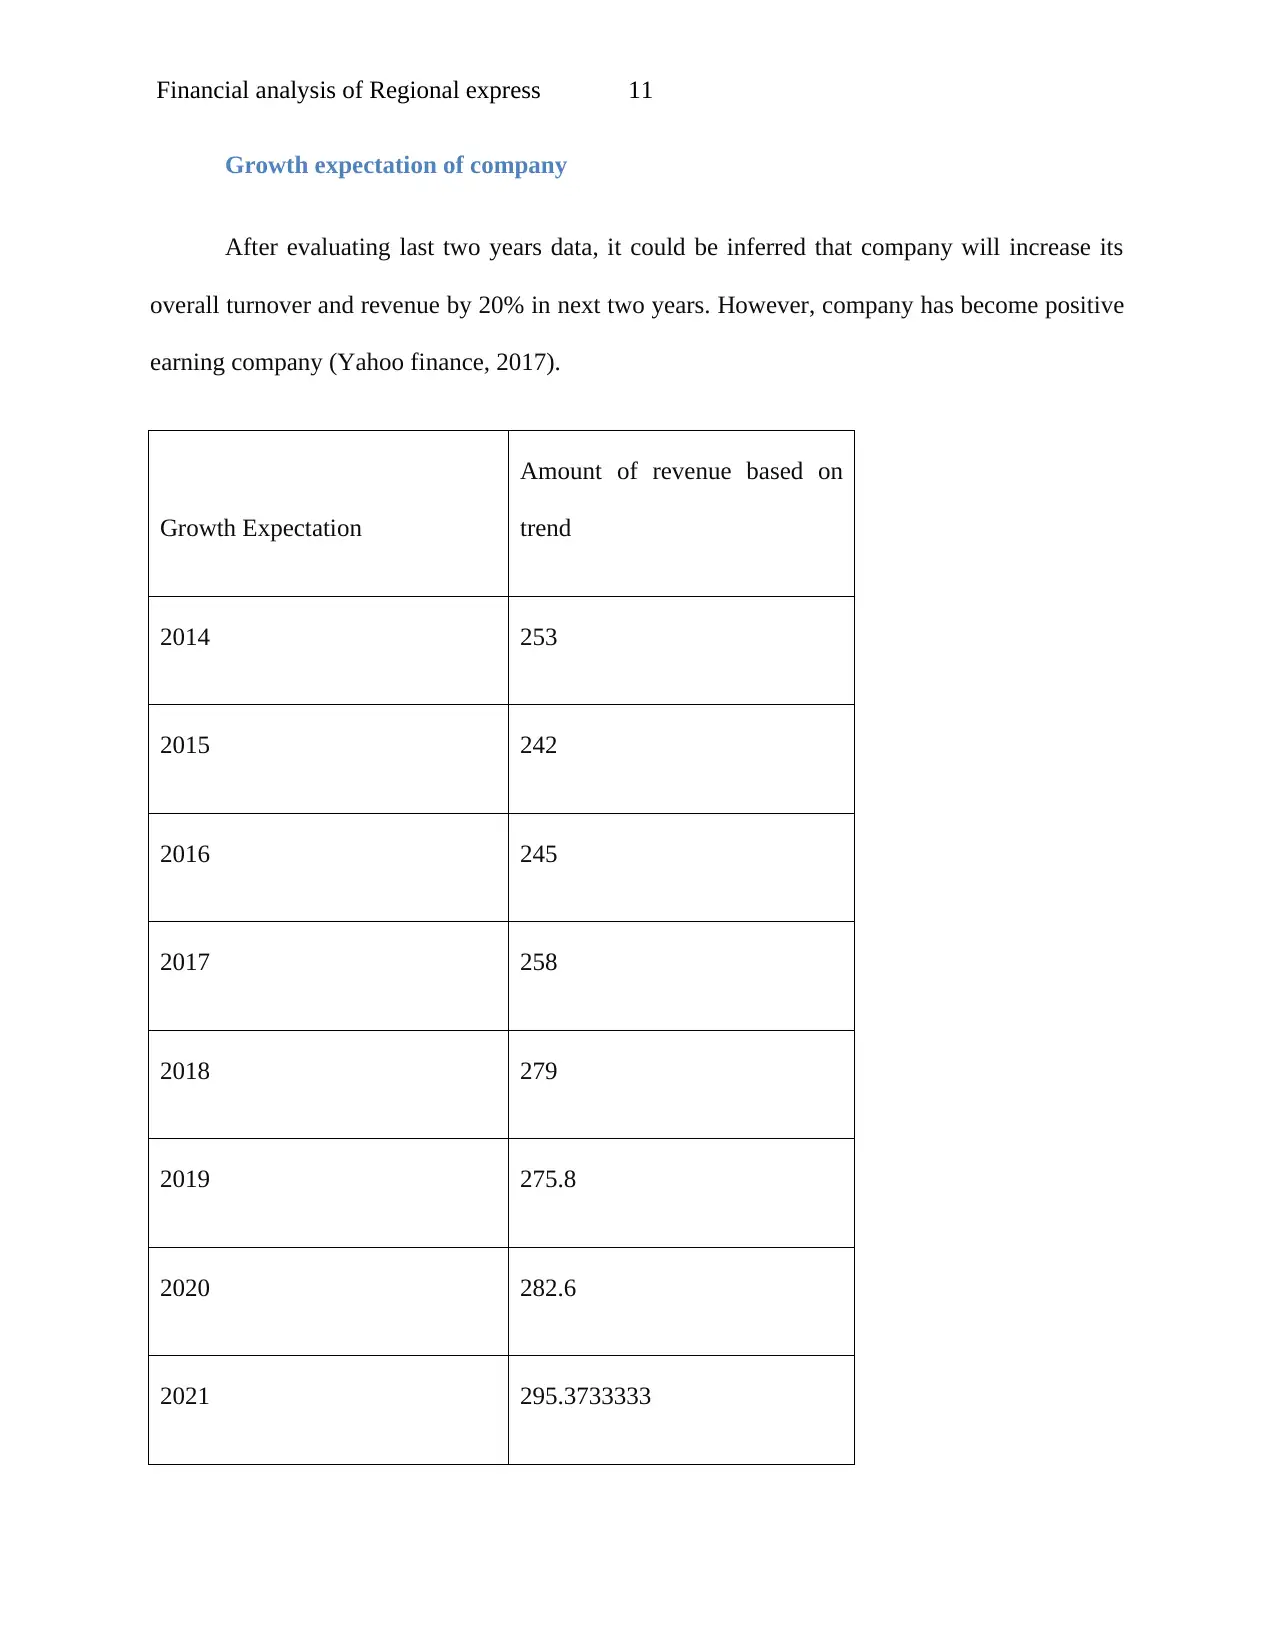
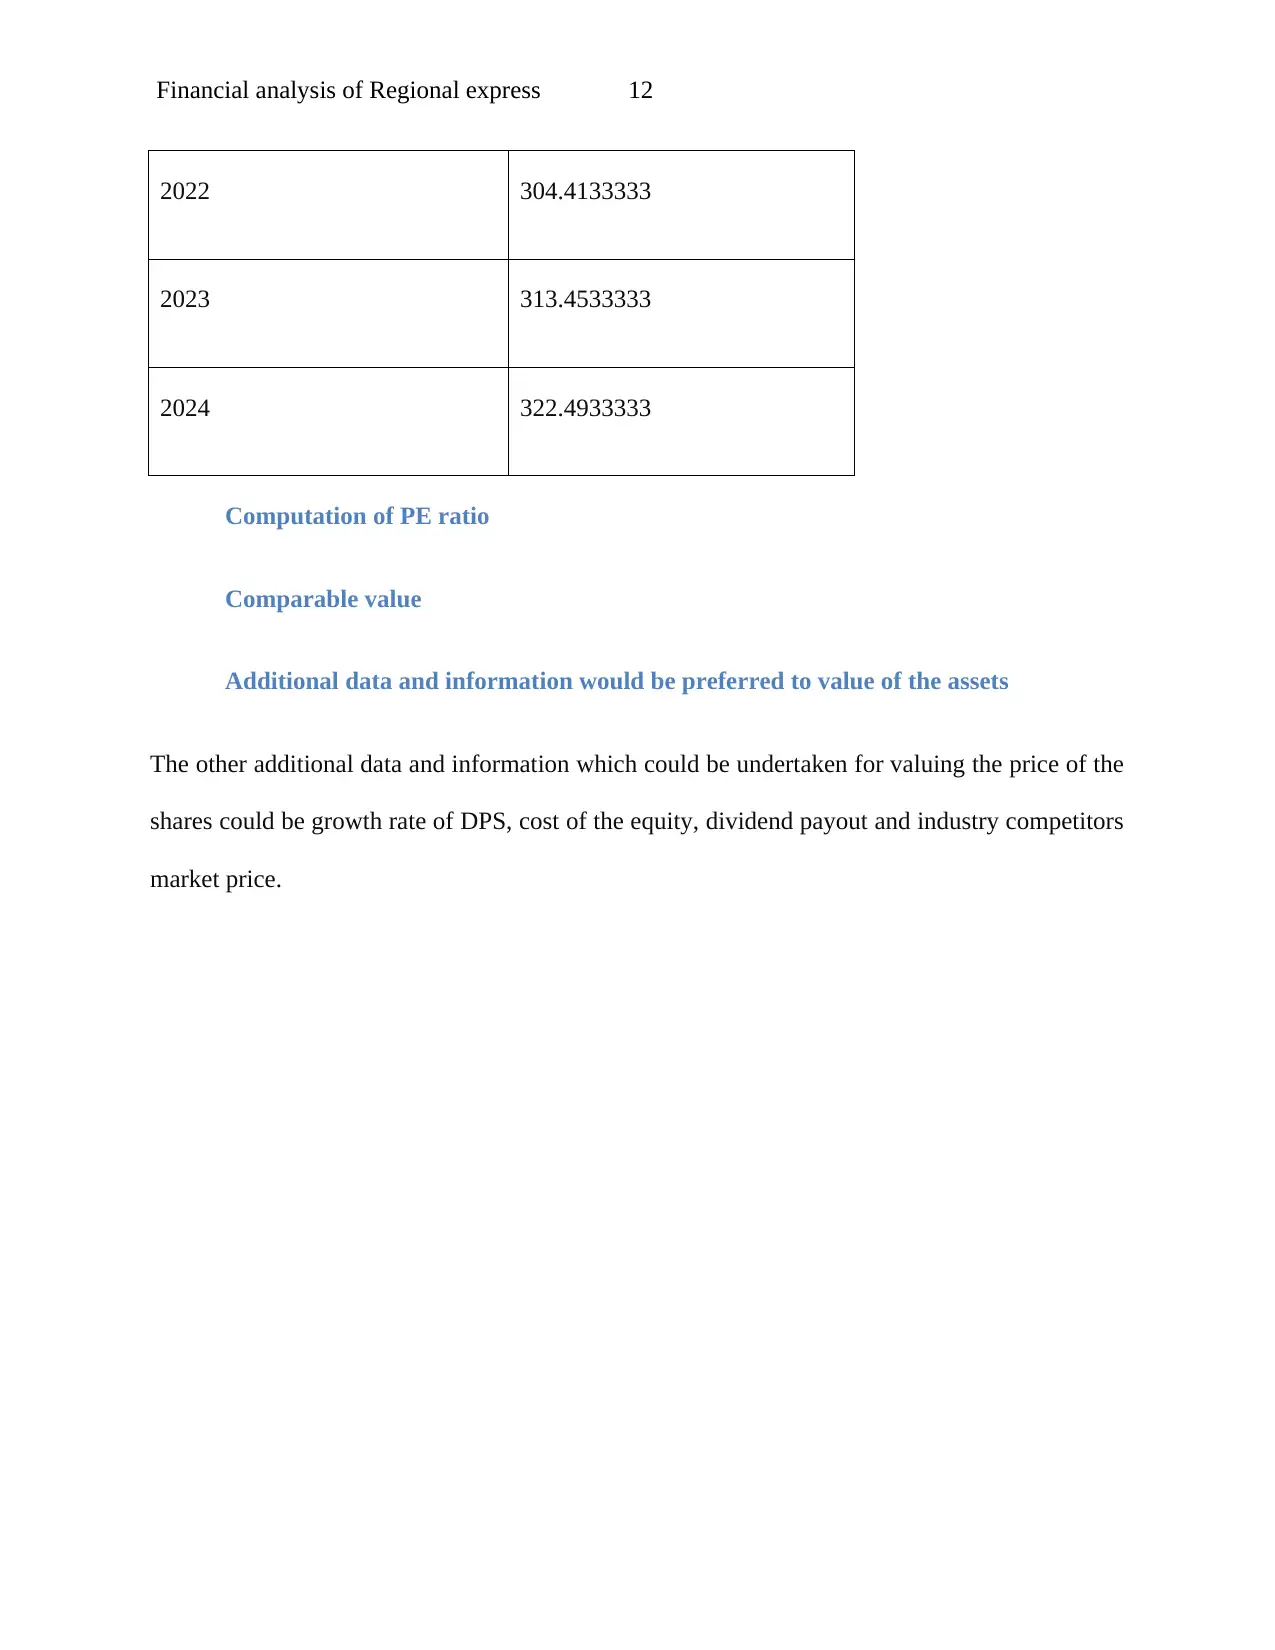
This report provides a comprehensive financial analysis of Regional Express Holdings Ltd. It examines the company's short-term and long-term debts, assessing the consistency of its debt structure and comparing it to industry standards. The analysis includes the computation of the cost of debt and equity, as well as an evaluation of the company's revenue, earnings, EPS, dividends, and growth expectations. The report delves into the weighted average cost of capital (WACC), explaining the impact of tax rates and the rationale behind differences in the cost of debt and equity. It also discusses the inclusion of current liabilities in the cost of capital and highlights the major value of WACC calculations, along with its application in investment decisions. Furthermore, the report analyzes the company's capital structure in relation to industry standards and economic circumstances, and it concludes with a market analysis, literature search, and a discussion of the company's uniqueness. The report uses data from annual reports and provides a detailed overview of the company's financial health and performance.

RUNNING HEAD: Financial analysis of Regional express 1
Name of the student
Topic
University name
Name of the student
Topic
University name
Paraphrase This Document
Need a fresh take? Get an instant paraphrase of this document with our AI Paraphraser

Financial analysis of Regional express 2
Executive summary
This data and financial results calculated in this report, has been taken from the annual
report and implementing proper analysis. The financial analysis has been made on Regional
Express Company evaluate its WACC and financial performance of company.
Table of Contents
Executive summary............................................................................................................2
Introduction.......................................................................................................................2
Present description of company.....................................................................................2
Answer to question-1.........................................................................................................2
Short term and long term debts of company...................................................................2
Consistency of debt structure of company.....................................................................3
Company and industry operates its debt to influence the proportion of short-term to
long-term debts.......................................................................................................................... 4
Computation of cost of debt...........................................................................................5
Answer to question no-2....................................................................................................6
Company’s cost of equity...............................................................................................6
Evaluate and discuss your company’s revenue, earnings, EPS, dividends and growth
Expectations...............................................................................................................................6

Financial analysis of Regional express 3
Growth expectation of company....................................................................................7
Computation of PE ratio................................................................................................ 9
Comparable value.......................................................................................................... 9
Additional data and information would be preferred to value of the assets....................9
Answer to question no-3..................................................................................................10
Computation of weighted average cost of capital.........................................................10
Explanation of tax rate in relation to WACC...............................................................10
Why there is difference in cost of debt and cost of equity............................................10
Should current liabilities be included in cost of capital?..............................................11
Major value of the WACC calculation.........................................................................11
Regional Express Holdings Ltd has used WACC in investment decision....................12
Capital structure of company with the relevancy of the industry.................................13
Capital structure and what economic circumstances....................................................13
Answer to question-4.......................................................................................................15
Market analysis............................................................................................................15
Current literature search...............................................................................................15
Uniqueness of Regional Express Holdings Ltd............................................................15
Conclusion........................................................................................................................16
References....................................................................................................................... 17
⊘ This is a preview!⊘
Do you want full access?
Subscribe today to unlock all pages.

Trusted by 1+ million students worldwide

Financial analysis of Regional express 4
Paraphrase This Document
Need a fresh take? Get an instant paraphrase of this document with our AI Paraphraser

Financial analysis of Regional express 5
Introduction
This report reflects the financial analysis on the Regional Express Company. This
company has shown all the key details and ratio analysis of the company. All the data and
financial results calculated in this report, has been taken from the annual report and
implementing proper analysis.
Present description of company
It is a parent company of number of airline and associated companies in Australia. This
company has been running its business since 2002 and having more than 600 employees in its
business. The key person of company is John Sharp who provide all the management instruction
to company.
Answer to question-1
Short term and long term debts of company
It is evaluated that company has short term debt of AUD $ 58512000 in 2016 which has
gone down to AUD$ 56517000 in 2017. Company has decreased its overall short term debts with
a view to optimize its overall capital liquidity (Regional express, 2016).
Particular 2016 2017
$"000 $"000
Short term 58,512 56,517

Financial analysis of Regional express 6
debts
Long term
debts 84409 76363
In addition to this, Long term debts, company had long term debt of AUD $ 84409000 in 2016
which went down to 76363 in 2017. This decrease in long term debt will increase the financial
leverage and increase the overall cost of capital of company.
Consistency of debt structure of company
The debt structure of Regional Express Company is consisted of debt and share capital. The debt
structure of company has increment in the debt and equity relation. In 2016, debt to capital of
company was .7572 and then it decreased to .6764 in 2017 (Regional express, 2016).
Particular 2016 2017 Relation
$"000 $"000
Total debts
140,92
6 132,880 .7572
Equity share
capital 186108 196445 0.6764
⊘ This is a preview!⊘
Do you want full access?
Subscribe today to unlock all pages.

Trusted by 1+ million students worldwide

Financial analysis of Regional express 7
On the other hand, the industry debt to equity structure is around .82. It shows that company is
efficient in managing its debt to equity structure.
Company and industry operates its debt to influence the proportion of short-term to
long-term debts
As compared to its international rival company, Regional Express Company has
maintained effective short term and long term debt. However, as compared to Ryan Air
Company, Regional Express Company has maintained more than 50% more short term debt and
long term debt of company is also 200% as compared to Ryan Air Company. This has shown
that company has managed effective short term and long term debt
Particular 2016 2017
Industry (Ryanair
company )
$"000 $"000 $"000
Short term debts 56,517 56,517 33,700
Long term debts 84409 76363 42520
Paraphrase This Document
Need a fresh take? Get an instant paraphrase of this document with our AI Paraphraser

Financial analysis of Regional express 8
Computation of cost of debt
The computation of cost of debt of company is 8.94%
Computation of cost of debt
Amoun
t
Interest payment 64580
Long term debt and short term
debt 7,090
Tax payment 1146
Cost of debt
8.9469
7
Computation of cost of debt
The computation of cost of debt of company is 8.94%
Computation of cost of debt
Amoun
t
Interest payment 64580
Long term debt and short term
debt 7,090
Tax payment 1146
Cost of debt
8.9469
7

Financial analysis of Regional express 9
Answer to question no-2
Company’s cost of equity
Cost of equity – It is the amount of cost which would be paid by company to its equity share
capital. In order to compute the cost of equity market index rate of return and beta has been
computed in the excel file (Regional express, 2016).
Computation of cost of equity of company
CAPM method
RF 1.58
RM -3%
Beta 0.19
Cost of equity 127%
⊘ This is a preview!⊘
Do you want full access?
Subscribe today to unlock all pages.

Trusted by 1+ million students worldwide

Financial analysis of Regional express 10
Evaluate and discuss your company’s revenue, earnings, EPS, dividends and growth
Expectations.
It is evaluated that company has increased its revenue in 2017 by 1 million as compared
to its last year data. However, simultaneously it will increase the overall cost of production.
Nonetheless, the earning of company is converted into AUD $ 13 million profit in 2017 as
compared to its 2016 year which reflected loss of AUD$ 10 million. In addition to this, due to
increase in its profit, company has increased its earning per share to .12 in 2017 which is .21
positive as compared to its last year data. It increases shareholders capital value.
Particular (AUD in million) 2016 2017
Revenue 258 259
Earning -10 13
EPS -0.09 0.12
Dividend 0 0
Paraphrase This Document
Need a fresh take? Get an instant paraphrase of this document with our AI Paraphraser

Financial analysis of Regional express 11
Growth expectation of company
After evaluating last two years data, it could be inferred that company will increase its
overall turnover and revenue by 20% in next two years. However, company has become positive
earning company (Yahoo finance, 2017).
Growth Expectation
Amount of revenue based on
trend
2014 253
2015 242
2016 245
2017 258
2018 279
2019 275.8
2020 282.6
2021 295.3733333

Financial analysis of Regional express 12
2022 304.4133333
2023 313.4533333
2024 322.4933333
Computation of PE ratio
Comparable value
Additional data and information would be preferred to value of the assets
The other additional data and information which could be undertaken for valuing the price of the
shares could be growth rate of DPS, cost of the equity, dividend payout and industry competitors
market price.
⊘ This is a preview!⊘
Do you want full access?
Subscribe today to unlock all pages.

Trusted by 1+ million students worldwide
1 out of 18
Related Documents

Your All-in-One AI-Powered Toolkit for Academic Success.
+13062052269
info@desklib.com
Available 24*7 on WhatsApp / Email
Unlock your academic potential
Copyright © 2020–2025 A2Z Services. All Rights Reserved. Developed and managed by ZUCOL.