Financial Decision Making Report: Analysis of Roast Ltd's Finances
VerifiedAdded on 2023/01/18
|16
|4516
|95
Report
AI Summary
This report provides a comprehensive analysis of financial decision-making, focusing on the case of Roast Ltd. It begins with an executive summary and an industry review of the UK beverage sector, highlighting key players and market trends. The core of the report centers on financial statement analysis, including the P&L statement, balance sheet, and statement of cash flows for 2017 and 2018, with a detailed examination of relevant financial ratios such as gross profit margin, net profit margin, operating profit ratio, current ratio, quick ratio, debt-to-equity ratio, and return on capital employed. The report also delves into investment appraisal techniques and explores various sources of finance available to the company. Through this analysis, the report aims to provide insights into Roast Ltd's financial performance, profitability, and stability, offering valuable information for strategic decision-making and business growth.
Financial Decision Making
Paraphrase This Document
Need a fresh take? Get an instant paraphrase of this document with our AI Paraphraser
Table of Contents
Executive summary..........................................................................................................................1
PART 1............................................................................................................................................1
Industry Review..........................................................................................................................1
PART 2............................................................................................................................................2
2.1 Statement of P&L..................................................................................................................2
2.2 Balance sheet Statement of financial position......................................................................4
2.3 Statement of cash Flows........................................................................................................6
Part 3: Investment Appraisal and Sources of Finance.....................................................................8
3.1 Investment Appraisal............................................................................................................8
3.2 Sources of finance...............................................................................................................10
REFERENCES .............................................................................................................................12

⊘ This is a preview!⊘
Do you want full access?
Subscribe today to unlock all pages.
Trusted by 1+ million students worldwide
Executive summary
Financial decision-making involves the method of formulating potential plans that will
assist the company in achieving stable growth possibilities. It is also the responsibility of each
organization's administration to devise the best-in-kind approaches for achieving success in
business activities. The report summaries, balance sheet, P&L account and importance of cash
flow statement that help to analysis the position of company in marketplace. The entire analysis
is also carried out with regard to investment assessment methods along with funding sources.
The primary objective of this study is to analyse various financial records in order to create
successful decision-making.
Main key finding through this assessment is that ratio analysis is an important element
which helps to define the overall profitability of Roast Ltd. Evaluation of financial document
describes the entire market structure, financial stability and strength and number of existing
shareholder in an accounting year. External sources of finance are better for company as it
maintain the continuity within operations and handle cash balance.
PART 1
Industry Review
UK's beverage sector is very large in scope and has a major contribution to UK's
development (Bond, Edmans and Goldstein, 2012). The various elements together with details
leading to the evaluation of the condition of the industry are provided in different stages below:
The industry's total contribution to UK GDP is about 3.7 billion pounds in 2017.
There are number of companies which plays a major role in increasing the beverage
industry such as Starbucks, Cafe2U, Soho coffee, Cafe Nero, Costa Coffee and Republic
coffee house.
In the recent year it has been determined that the actual development and growth in
respective sector is almost 7.9%. This state that customer in UK are mostly attached with
beverage in order to satisfy their daily requirement.
The greatest possibility within this industry is to extend enterprise across such areas
where there are still few cafe being operated. It will give all existing companies with an
ability to expand their activities and take advantage of growth opportunities.
1
Paraphrase This Document
Need a fresh take? Get an instant paraphrase of this document with our AI Paraphraser
There are many problems in the coffee industry which the company working in this field
has had to face. The first problem surrounding the in the industry is introduction of
various types of beverages which have a significant impact on industry and share of the
market (Carraher and Van Auken, 2013). Furthermore, customer understanding where
they concentrate on drink consumption at a specific time. It will have a significant impact
to their activities in this situation.
Challenges for beverage sector
Ban of plastic which increase cost for the companies dealing in beverage sectors as they
have to look for some other alternative.
The rise of health consciousness among customer dye to which consumption for fast food
have rapidly decreases.
Opportunities for beverage sector
1. Company can include natural soft drinks that will contain low level of sugar and other
harmful ingredients.
2. These innovations mean that artisanal beverages are starting to attract the attention of the
large multinational companies that dominate the international landscape, such as Nestlé
in coffee and Unilever in tea.
PART 2
2.1 Statement of P&L
In modern business era, every company prepares the trading account document to
determine the actual figures of profit and loss with an accounting year. This is the final accounts
section which is addressed to inner and external business persons and customers. It majorly
supports to determine the correct and exact information about the profitability and financial
strength of company. This is mostly used by the various types of workers, including investors,
vendors, clients, stakeholders (Hershey, Austin and Gutierrez, 2015). This helps to improve their
ability to make decisions. The numerous decisions to be taken include providence of credit,
savings, production and purchase of goods. In UK, Roast LTD is a famous coffee house which is
operating well in market by providing number of useful necessary daily product. From the
assessment of the organization's income statement account, it was found that the sales achieved
in 2017 were 2022 GBP, however the figure extended in 2018 and reached 2534 GBP. This
2
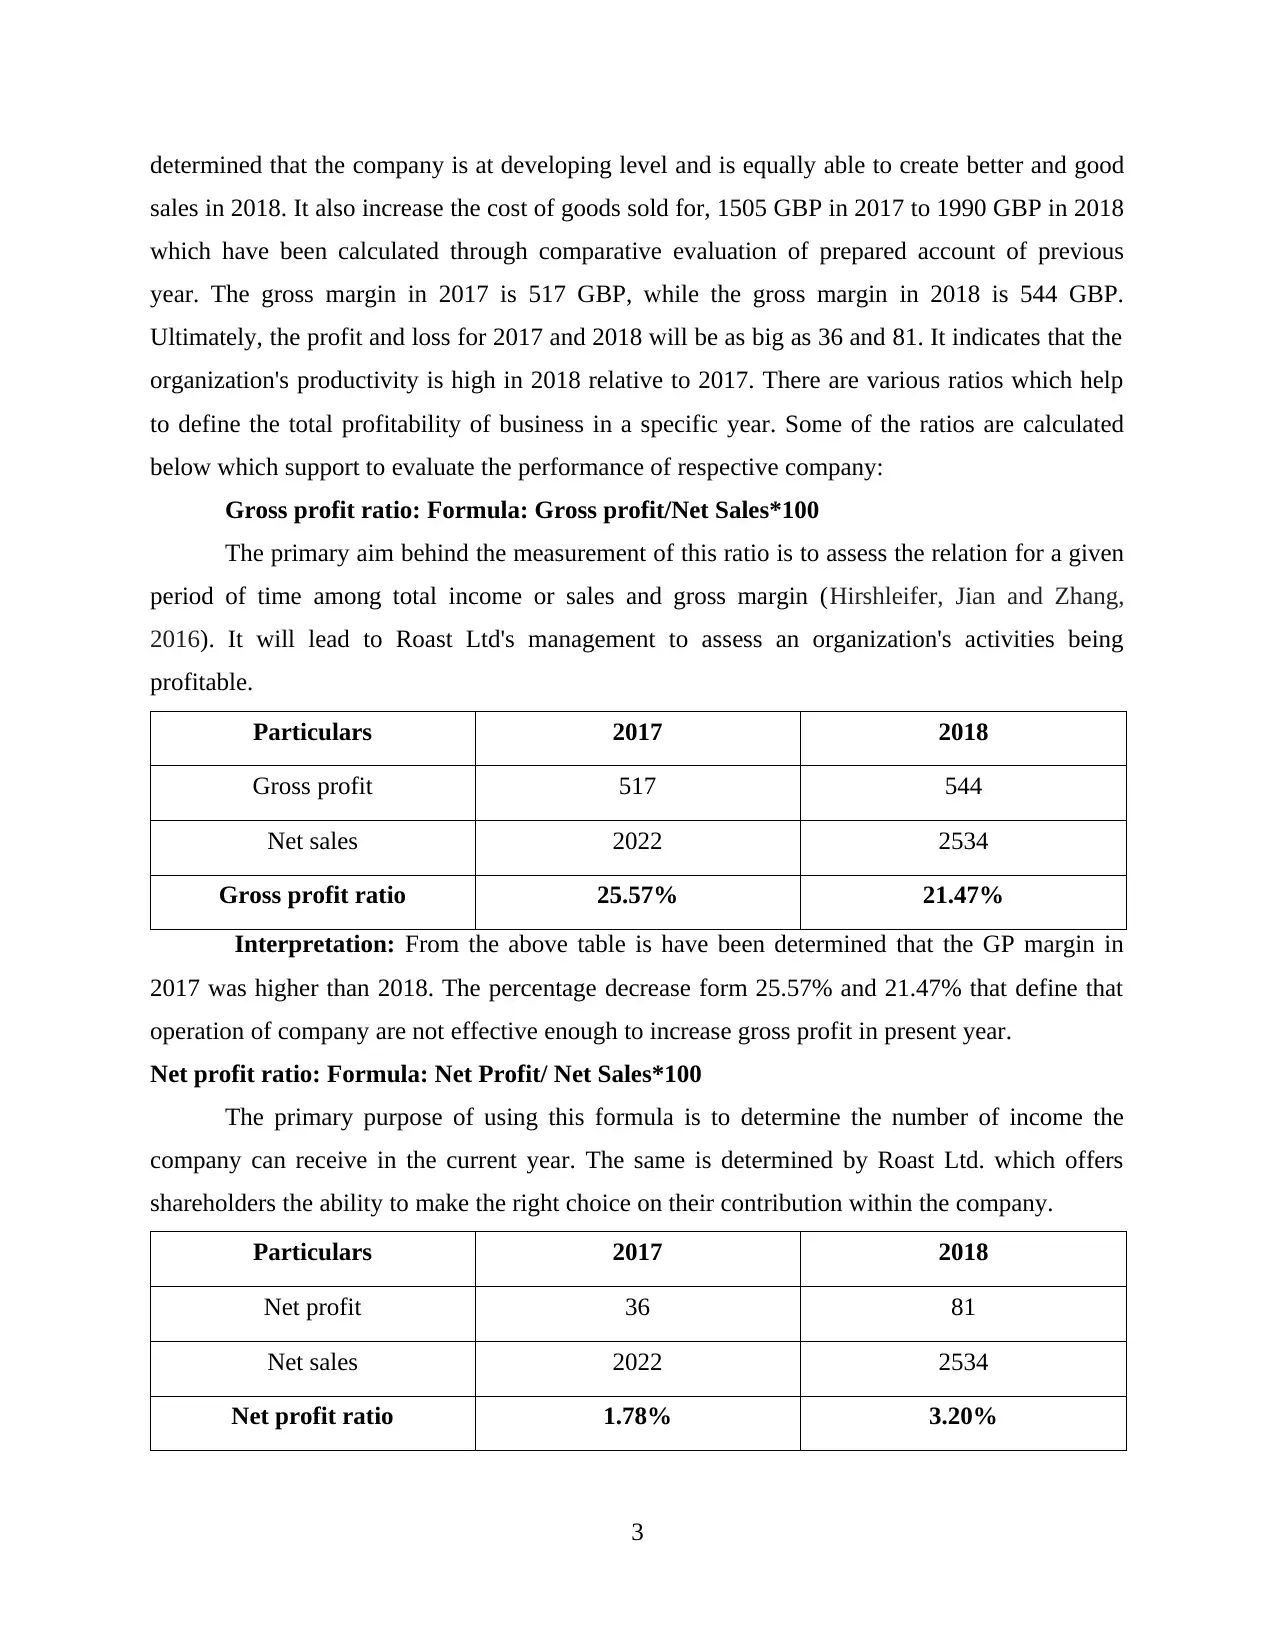
determined that the company is at developing level and is equally able to create better and good
sales in 2018. It also increase the cost of goods sold for, 1505 GBP in 2017 to 1990 GBP in 2018
which have been calculated through comparative evaluation of prepared account of previous
year. The gross margin in 2017 is 517 GBP, while the gross margin in 2018 is 544 GBP.
Ultimately, the profit and loss for 2017 and 2018 will be as big as 36 and 81. It indicates that the
organization's productivity is high in 2018 relative to 2017. There are various ratios which help
to define the total profitability of business in a specific year. Some of the ratios are calculated
below which support to evaluate the performance of respective company:
Gross profit ratio: Formula: Gross profit/Net Sales*100
The primary aim behind the measurement of this ratio is to assess the relation for a given
period of time among total income or sales and gross margin (Hirshleifer, Jian and Zhang,
2016). It will lead to Roast Ltd's management to assess an organization's activities being
profitable.
Particulars 2017 2018
Gross profit 517 544
Net sales 2022 2534
Gross profit ratio 25.57% 21.47%
Interpretation: From the above table is have been determined that the GP margin in
2017 was higher than 2018. The percentage decrease form 25.57% and 21.47% that define that
operation of company are not effective enough to increase gross profit in present year.
Net profit ratio: Formula: Net Profit/ Net Sales*100
The primary purpose of using this formula is to determine the number of income the
company can receive in the current year. The same is determined by Roast Ltd. which offers
shareholders the ability to make the right choice on their contribution within the company.
Particulars 2017 2018
Net profit 36 81
Net sales 2022 2534
Net profit ratio 1.78% 3.20%
3
⊘ This is a preview!⊘
Do you want full access?
Subscribe today to unlock all pages.
Trusted by 1+ million students worldwide
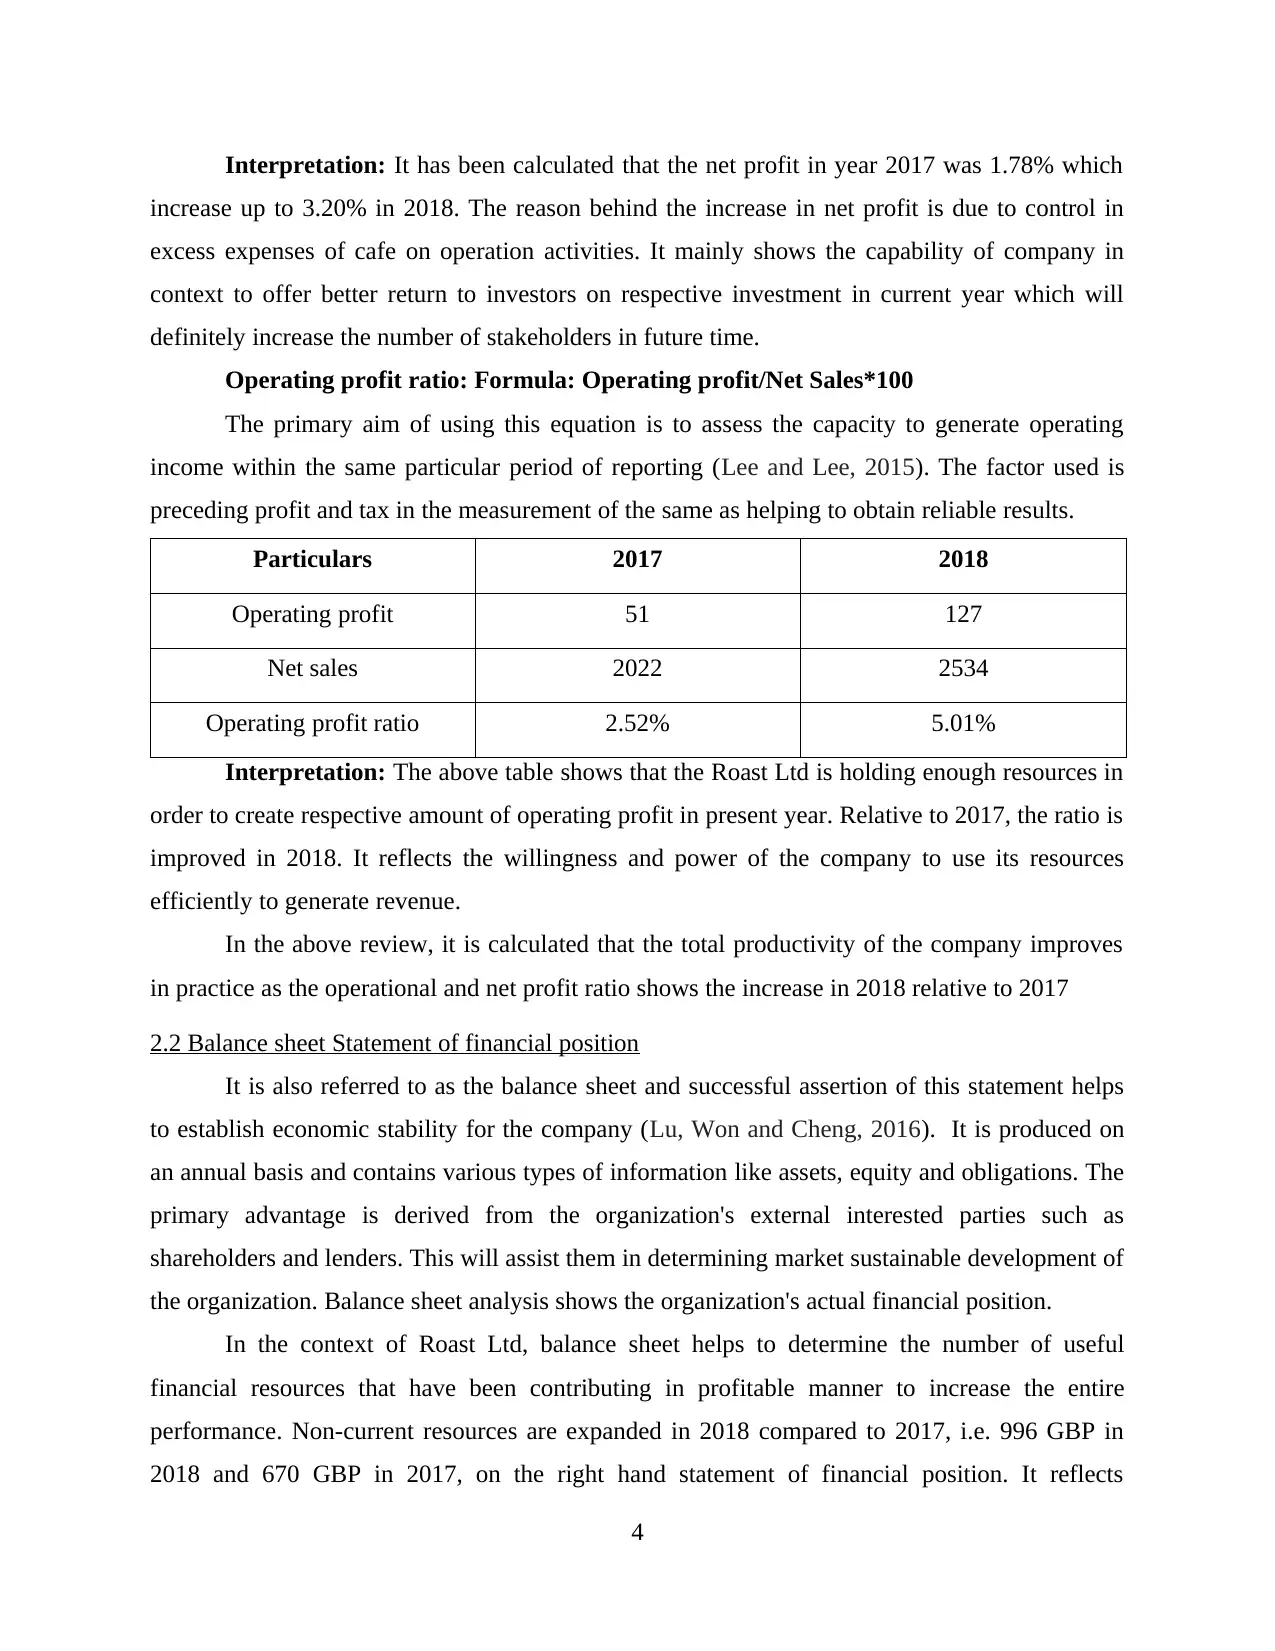
Interpretation: It has been calculated that the net profit in year 2017 was 1.78% which
increase up to 3.20% in 2018. The reason behind the increase in net profit is due to control in
excess expenses of cafe on operation activities. It mainly shows the capability of company in
context to offer better return to investors on respective investment in current year which will
definitely increase the number of stakeholders in future time.
Operating profit ratio: Formula: Operating profit/Net Sales*100
The primary aim of using this equation is to assess the capacity to generate operating
income within the same particular period of reporting (Lee and Lee, 2015). The factor used is
preceding profit and tax in the measurement of the same as helping to obtain reliable results.
Particulars 2017 2018
Operating profit 51 127
Net sales 2022 2534
Operating profit ratio 2.52% 5.01%
Interpretation: The above table shows that the Roast Ltd is holding enough resources in
order to create respective amount of operating profit in present year. Relative to 2017, the ratio is
improved in 2018. It reflects the willingness and power of the company to use its resources
efficiently to generate revenue.
In the above review, it is calculated that the total productivity of the company improves
in practice as the operational and net profit ratio shows the increase in 2018 relative to 2017
2.2 Balance sheet Statement of financial position
It is also referred to as the balance sheet and successful assertion of this statement helps
to establish economic stability for the company (Lu, Won and Cheng, 2016). It is produced on
an annual basis and contains various types of information like assets, equity and obligations. The
primary advantage is derived from the organization's external interested parties such as
shareholders and lenders. This will assist them in determining market sustainable development of
the organization. Balance sheet analysis shows the organization's actual financial position.
In the context of Roast Ltd, balance sheet helps to determine the number of useful
financial resources that have been contributing in profitable manner to increase the entire
performance. Non-current resources are expanded in 2018 compared to 2017, i.e. 996 GBP in
2018 and 670 GBP in 2017, on the right hand statement of financial position. It reflects
4
Paraphrase This Document
Need a fresh take? Get an instant paraphrase of this document with our AI Paraphraser
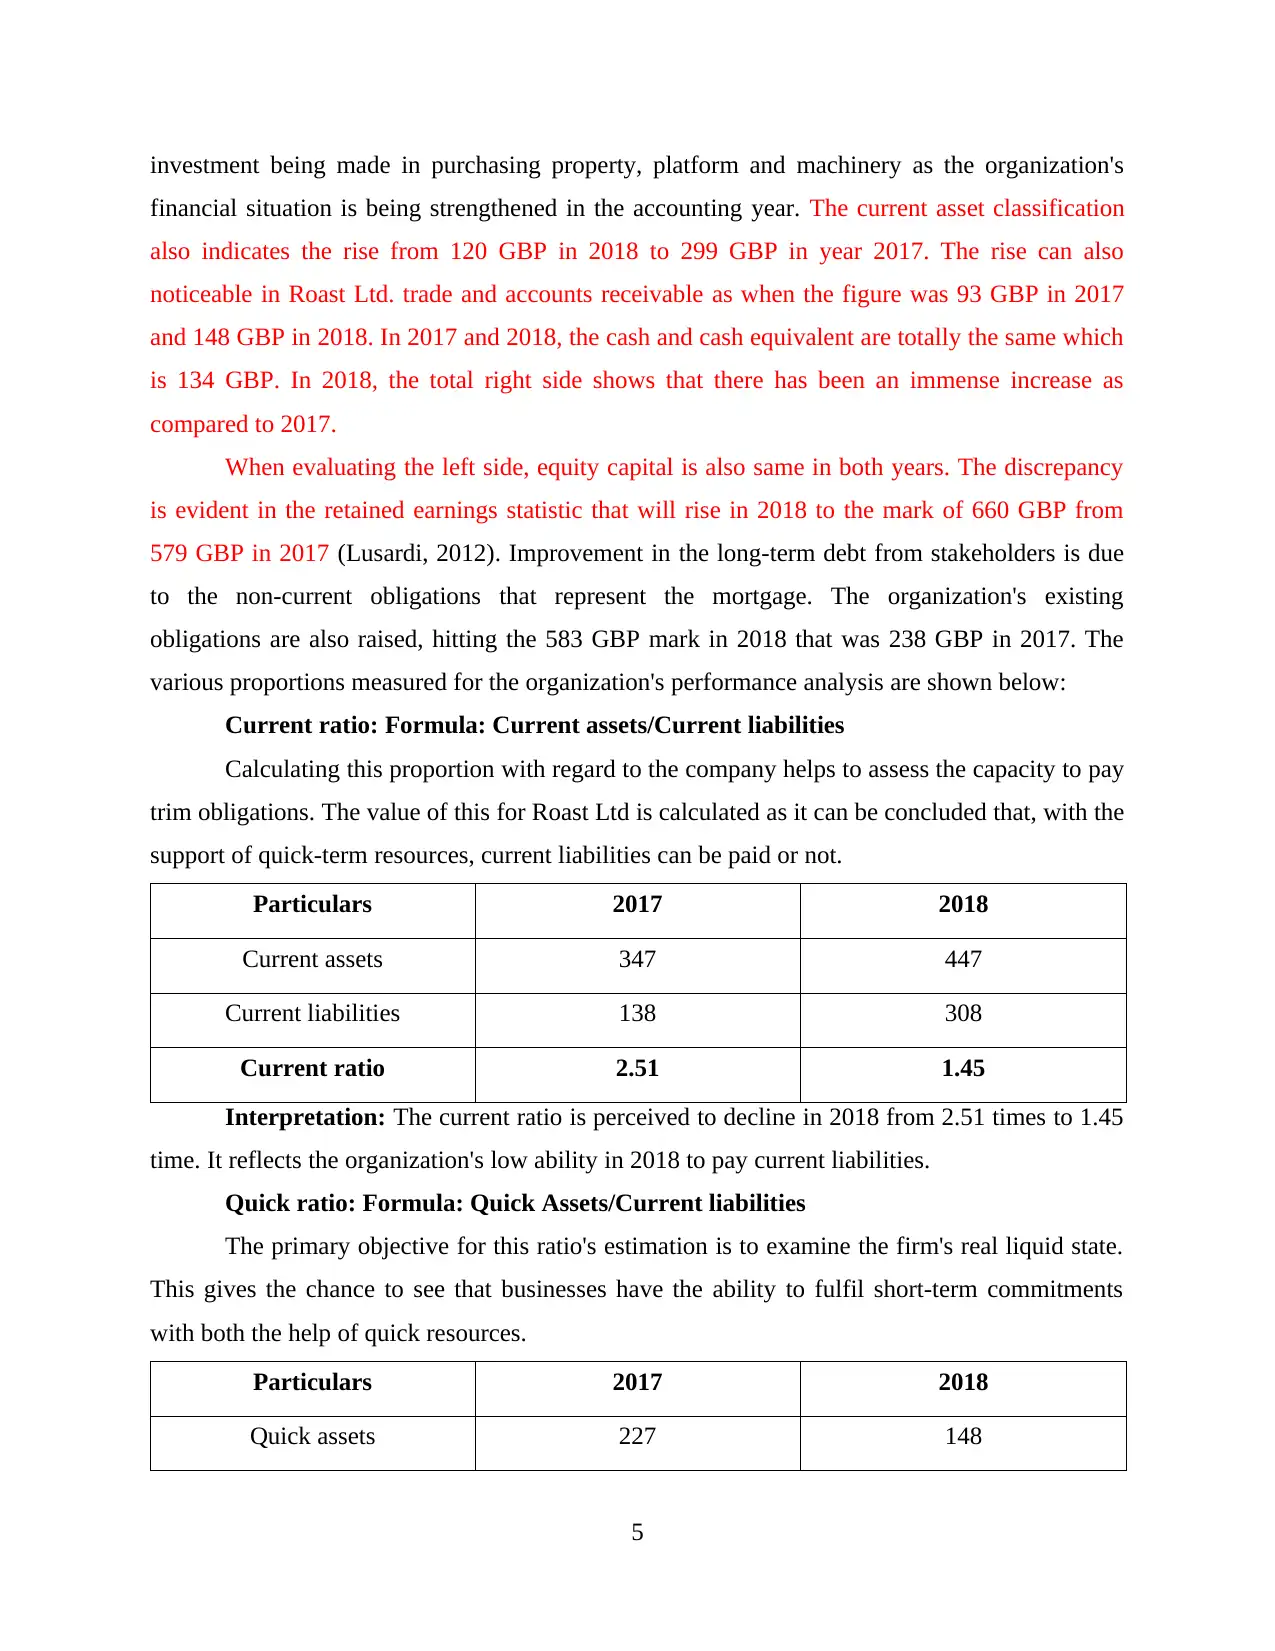
investment being made in purchasing property, platform and machinery as the organization's
financial situation is being strengthened in the accounting year. The current asset classification
also indicates the rise from 120 GBP in 2018 to 299 GBP in year 2017. The rise can also
noticeable in Roast Ltd. trade and accounts receivable as when the figure was 93 GBP in 2017
and 148 GBP in 2018. In 2017 and 2018, the cash and cash equivalent are totally the same which
is 134 GBP. In 2018, the total right side shows that there has been an immense increase as
compared to 2017.
When evaluating the left side, equity capital is also same in both years. The discrepancy
is evident in the retained earnings statistic that will rise in 2018 to the mark of 660 GBP from
579 GBP in 2017 (Lusardi, 2012). Improvement in the long-term debt from stakeholders is due
to the non-current obligations that represent the mortgage. The organization's existing
obligations are also raised, hitting the 583 GBP mark in 2018 that was 238 GBP in 2017. The
various proportions measured for the organization's performance analysis are shown below:
Current ratio: Formula: Current assets/Current liabilities
Calculating this proportion with regard to the company helps to assess the capacity to pay
trim obligations. The value of this for Roast Ltd is calculated as it can be concluded that, with the
support of quick-term resources, current liabilities can be paid or not.
Particulars 2017 2018
Current assets 347 447
Current liabilities 138 308
Current ratio 2.51 1.45
Interpretation: The current ratio is perceived to decline in 2018 from 2.51 times to 1.45
time. It reflects the organization's low ability in 2018 to pay current liabilities.
Quick ratio: Formula: Quick Assets/Current liabilities
The primary objective for this ratio's estimation is to examine the firm's real liquid state.
This gives the chance to see that businesses have the ability to fulfil short-term commitments
with both the help of quick resources.
Particulars 2017 2018
Quick assets 227 148
5
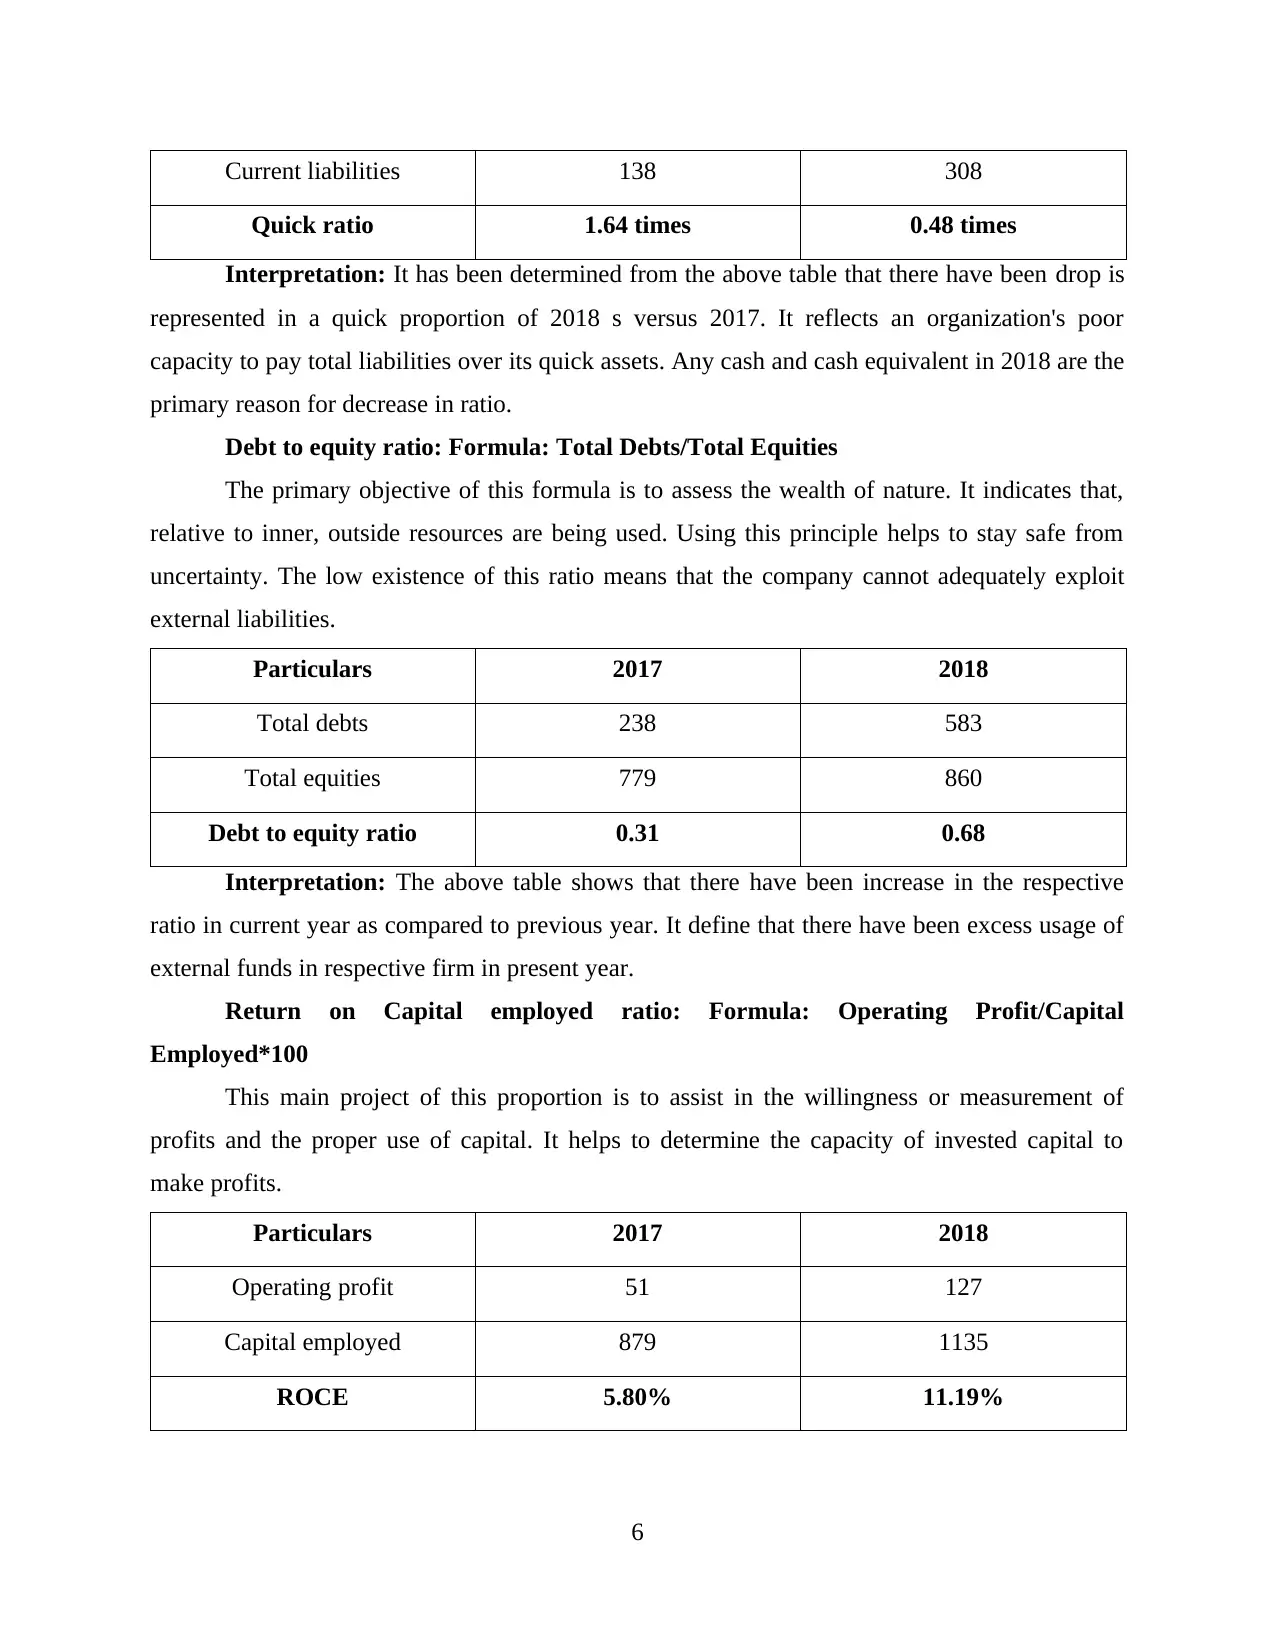
Current liabilities 138 308
Quick ratio 1.64 times 0.48 times
Interpretation: It has been determined from the above table that there have been drop is
represented in a quick proportion of 2018 s versus 2017. It reflects an organization's poor
capacity to pay total liabilities over its quick assets. Any cash and cash equivalent in 2018 are the
primary reason for decrease in ratio.
Debt to equity ratio: Formula: Total Debts/Total Equities
The primary objective of this formula is to assess the wealth of nature. It indicates that,
relative to inner, outside resources are being used. Using this principle helps to stay safe from
uncertainty. The low existence of this ratio means that the company cannot adequately exploit
external liabilities.
Particulars 2017 2018
Total debts 238 583
Total equities 779 860
Debt to equity ratio 0.31 0.68
Interpretation: The above table shows that there have been increase in the respective
ratio in current year as compared to previous year. It define that there have been excess usage of
external funds in respective firm in present year.
Return on Capital employed ratio: Formula: Operating Profit/Capital
Employed*100
This main project of this proportion is to assist in the willingness or measurement of
profits and the proper use of capital. It helps to determine the capacity of invested capital to
make profits.
Particulars 2017 2018
Operating profit 51 127
Capital employed 879 1135
ROCE 5.80% 11.19%
6
⊘ This is a preview!⊘
Do you want full access?
Subscribe today to unlock all pages.
Trusted by 1+ million students worldwide
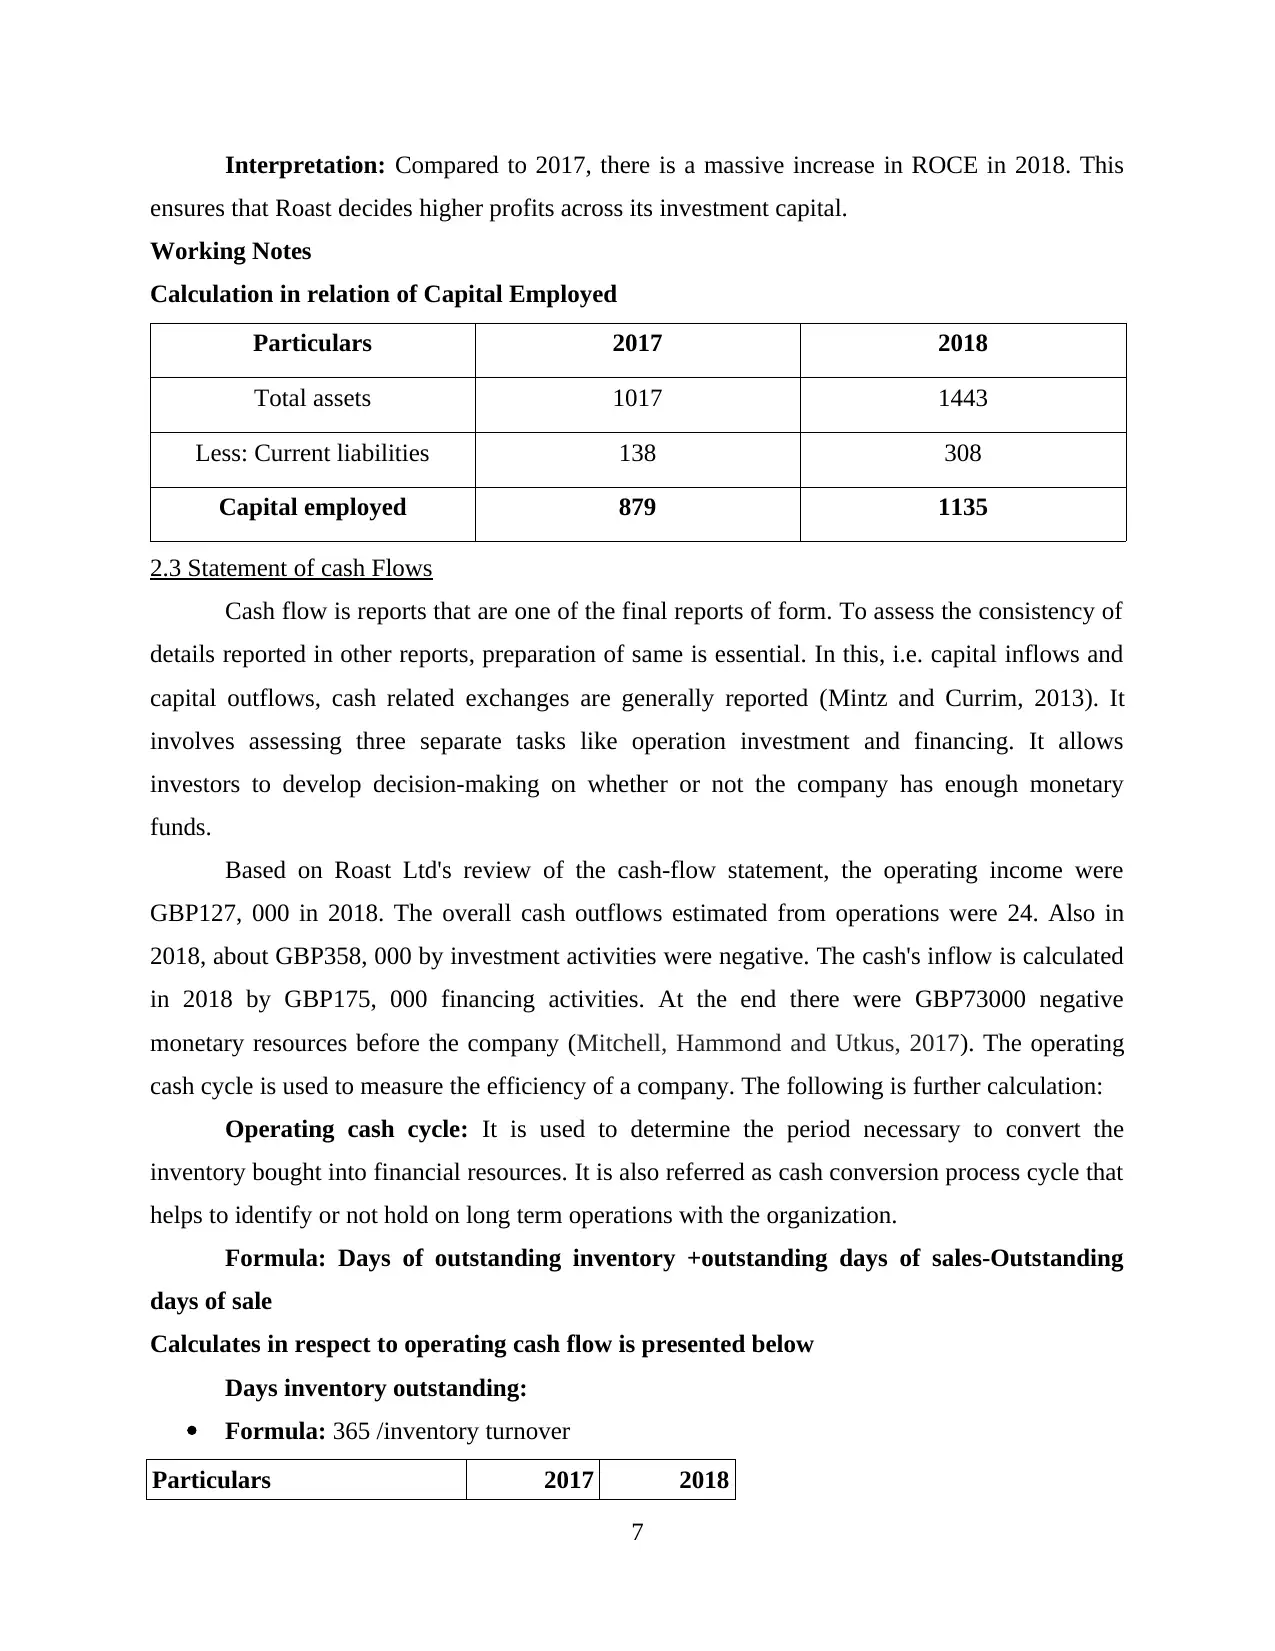
Interpretation: Compared to 2017, there is a massive increase in ROCE in 2018. This
ensures that Roast decides higher profits across its investment capital.
Working Notes
Calculation in relation of Capital Employed
Particulars 2017 2018
Total assets 1017 1443
Less: Current liabilities 138 308
Capital employed 879 1135
2.3 Statement of cash Flows
Cash flow is reports that are one of the final reports of form. To assess the consistency of
details reported in other reports, preparation of same is essential. In this, i.e. capital inflows and
capital outflows, cash related exchanges are generally reported (Mintz and Currim, 2013). It
involves assessing three separate tasks like operation investment and financing. It allows
investors to develop decision-making on whether or not the company has enough monetary
funds.
Based on Roast Ltd's review of the cash-flow statement, the operating income were
GBP127, 000 in 2018. The overall cash outflows estimated from operations were 24. Also in
2018, about GBP358, 000 by investment activities were negative. The cash's inflow is calculated
in 2018 by GBP175, 000 financing activities. At the end there were GBP73000 negative
monetary resources before the company (Mitchell, Hammond and Utkus, 2017). The operating
cash cycle is used to measure the efficiency of a company. The following is further calculation:
Operating cash cycle: It is used to determine the period necessary to convert the
inventory bought into financial resources. It is also referred as cash conversion process cycle that
helps to identify or not hold on long term operations with the organization.
Formula: Days of outstanding inventory +outstanding days of sales-Outstanding
days of sale
Calculates in respect to operating cash flow is presented below
Days inventory outstanding:
Formula: 365 /inventory turnover
Particulars 2017 2018
7
Paraphrase This Document
Need a fresh take? Get an instant paraphrase of this document with our AI Paraphraser
Total days in year 365 365
Inventory turnover 12.54 6.66
Days inventory outstanding 29.11 54.80
Days sale outstanding:
Formula: 365 /receivable turnover
Particulars 2017 2018
Total days in year 365 365
Receivable turnover 21.74 17.12
Days sale outstanding 16.79 21.32
Days payable outstanding:
Formula: 365 /payable turnover
Particulars 2017 2018
Total days in year 365 365
Payable turnover 10.91 8.47
Days payable outstanding 33.46 43.09
Calculation of operating cash cycle:
Particulars 2017 2018
Days inventory outstanding 29 55
Add: Days sales outstanding 17 21
Less: Days payable
outstanding 33 44
Operating cash cycle 13 32
Working notes:
Inventory turnover: Cost of sales /average inventory
Particulars 2017 2018
8
Cost of sales 1505 1990
Average inventory 120 299
Inventory turnover 12.54 6.66
Receivable turnover: Net sales /account receivables
Particulars 2017 2018
Net sales 2022 2534
Account receivables 93 148
Receivable turnover 21.74 17.12
Payable turnover: Cost of sales /account payable
Particulars 2017 2018
Cost of sales 1505 1990
Account payables 138 235
Payable turnover 10.91 8.47
The comparison above shows that the days necessary for the transaction to be covered
were 13 in 2017 and 32 in 2018. It indicates more time to turn investments into cash-funds in
2018.
Dividend policy: This is the procedure whereby the stakeholders are given earnings.
Roast Ltd.-Roast Ltd. For 2018, no dividends were charged. First reason why some companies
do not pay dividends is because they would rather reinvest those profits back into the business.
Moreover, company will hold off on dividend payments and hoard cash is for acquisitions. In
last roast ltd, usually want to tend to offer dividends, because that draws customers, which holds
them going. Often, however, you'll run into a corporation who needs to slash or remove a
dividend owing to financial difficulties. This is not the correct decision as earnings were
improved relative to 2017 in 2018. This has a negative effect on shareholders ' interest and
subsequent capital reduction.
9
⊘ This is a preview!⊘
Do you want full access?
Subscribe today to unlock all pages.
Trusted by 1+ million students worldwide
1 out of 16
Related Documents


Your All-in-One AI-Powered Toolkit for Academic Success.
+13062052269
info@desklib.com
Available 24*7 on WhatsApp / Email
![[object Object]](/_next/static/media/star-bottom.7253800d.svg)
Unlock your academic potential
Copyright © 2020–2026 A2Z Services. All Rights Reserved. Developed and managed by ZUCOL.