Financial Analysis of Roast Ltd. and Investment Appraisal Report
VerifiedAdded on 2023/01/17
|17
|4576
|1
Report
AI Summary
This report presents a comprehensive financial analysis of Roast Ltd., focusing on its performance and potential for acquisition by Starbucks. It begins with an executive summary highlighting key findings from the profit and loss statement, which shows increasing net profits, and the company's ability to manage its debts, despite negative cash flows. The report then delves into an industry review of the coffee house sector in the UK, including market size, key players, opportunities, and challenges. Part 2 provides a detailed business performance analysis, examining the statement of profit or loss, statement of financial position, and statement of cash flows, supported by ratio analysis such as gross profit margin, net profit margin, operating profit margin, current ratio, quick ratio, and debt-equity ratio. The analysis reveals trends in revenue, profitability, and financial stability. Part 3 focuses on investment appraisal, specifically the potential for launching new outlets in Romania, and explores the sources of finance available to Roast Ltd. The report concludes that investment in new outlets will enhance sales and cash position, making Roast Ltd. a potentially attractive acquisition target. The financial analysis provides valuable insights into Roast Ltd.'s performance, aiding in informed decision-making regarding investment and acquisition.
Financial Decision Making
Paraphrase This Document
Need a fresh take? Get an instant paraphrase of this document with our AI Paraphraser
Table of Contents
EXECUTIVE SUMMARY.............................................................................................................1
Part 1: Industry Review...................................................................................................................1
Part 2: Business Performance Analysis...........................................................................................2
2.1 Statement of Profit or Loss...................................................................................................2
2.2 Statement of Financial Position............................................................................................4
2.3 Statement of Cash Flows.......................................................................................................6
Part 3: Investment Appraisal and Sources of Finance.....................................................................8
3.1 Investment Appraisal............................................................................................................8
3.2. Sources of Finance.............................................................................................................10
REFERENCES..............................................................................................................................12

⊘ This is a preview!⊘
Do you want full access?
Subscribe today to unlock all pages.
Trusted by 1+ million students worldwide
EXECUTIVE SUMMARY
Financial decision can be defined as the process in which all the decisions associated
with stake holder's equity and liability of business entity along with issuance of bonds. In Roast
Limited, the P&L statement depicts that the net profit of firm in year 2018 is 81000 pounds
which raised from £36000. This increase in profits of firm shows that this company's product
demand is high which assists in its growth and development in market. The business entity has
the ability to pay its debts even though it is facing problems because of paying more for
procuring high quality coffee beans. The company's cash position depicts that it is confronting
issue of negative cash flows but, because of its constantly improving growth rate, it can be
conclude that firm can acquire Roast Ltd. The second part of project depicts that Roast Ltd.
must make investment in launching project of new outlets in Romania as this will contributes in
enhancing sales revenues as well as cash position of company.
Part 1: Industry Review
In today's competitive business environment, the coffee house industry is one of the
fastest growing sector in United Kingdom which is developing constantly because of current
social status of people in UK. By utilizing top line review, the summary of coffee house industry
is mentioned below:
As per the survey performed by ibis, the total revenue of £6 billions has recorded in
coffee house sector of UK. In this industry, the main players includes Café Nero, Starbucks, Cafe
Ritazza, Costa coffee etc. All these organisations are performing well in sector and an yearly
growth of 6.1 percent has recorded that depicts the success of industry (Correia, Dussault, and
Pontes, 2015). In the cafe coffee industry of United Kingdom, there are around 16199
businesses are operating which has been raised with the improving rate in comparison to the
last year. Various opportunities are exist in coffee house market that can be exploit by refereed
firm such as introducing organic coffee which is beneficial for the health of people. This
opportunity can help company in satisfying the needs of customers of being healthy and gaining
competitive advantage in market (Current coffee house industry of United Kingdom. 2019).
Besides the above mentioned opportunities, some challenges are some challenges which
the coffee house industry of United Kingdom faced. These challenges involves changing needs
of customers as they are becoming more aware regarding their health and prefers to have healthy
1
Paraphrase This Document
Need a fresh take? Get an instant paraphrase of this document with our AI Paraphraser
alternatives like sugar free beverages, green tea instead of consuming coffee. Intense competition
within industry is the another challenge that coffee house industry faces as there are many
organisations operating in sector which gives tough competition to the refereed company. Apart
from these entry of new entrants in the industry also creates threat for the firms operating in
sector. The main reason of intense rivalry in industry is high margin of profits which are enjoyed
by the companies involved in it (Finke, 2013).
Part 2: Business Performance Analysis
2.1 Statement of Profit or Loss
It is analysed from the income statement of Roast Ltd. helps Starbuck's chief financial
officer in taking appropriate decision associated with Roast Ltd.'s acquisition. From this
statement, it can be said that revenues of firm is increasing constantly as in 2017, the recorded
total sales resulted in revenue of £2022000 which maximizing at £2534000 in year 2018. Apart
from the revenue, net profit and gross profit of the firm are also improved which gives an
evidence that it is able to grow and sustain in competitive market environment. In year 2017, the
total operating expenses of firm has also increased along with the profits and were transacted as
£477000 and £466000 in year 2018.
The overall analysis in respect to the current project is further done on the basis of ratio
analysis. This will provides an opportunity in effective evaluation of the financial performance of
an organisation (Gal, Stewart and Hanne, 2013).
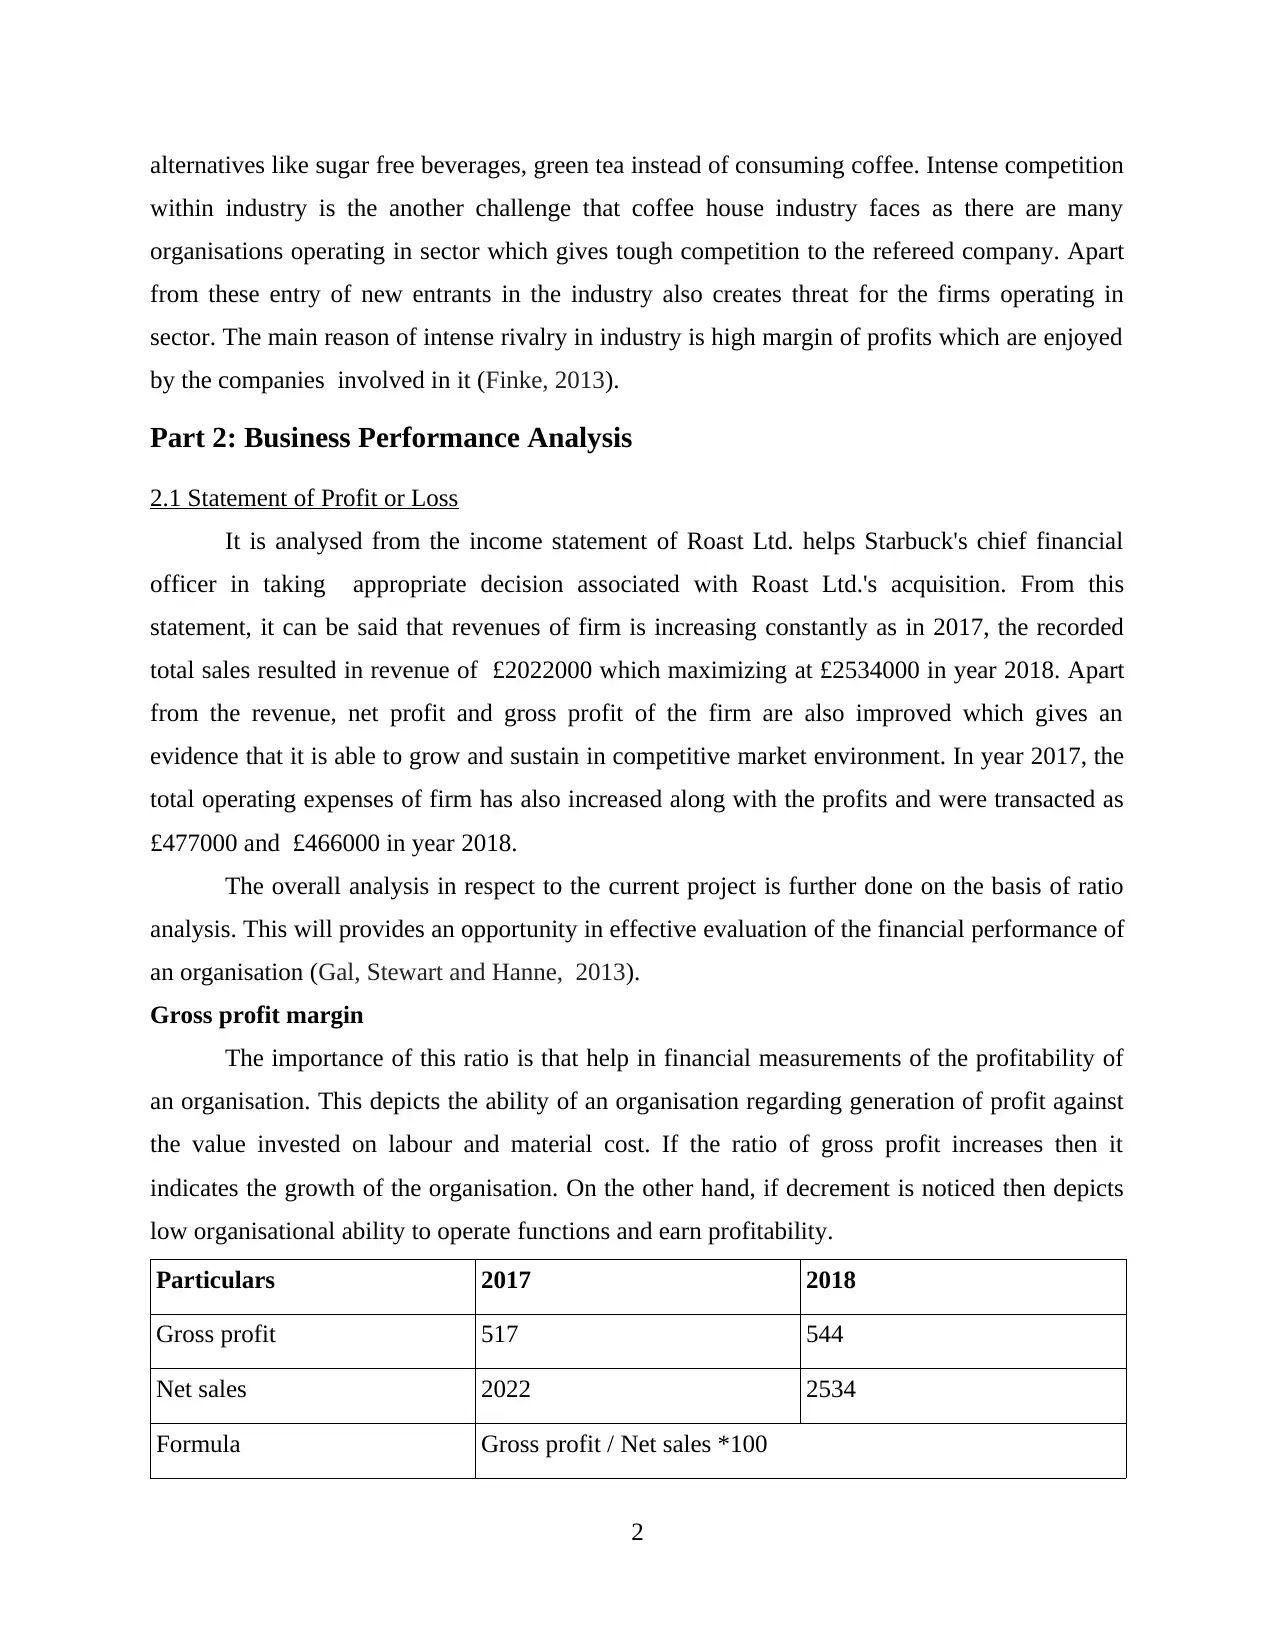
Gross profit margin
The importance of this ratio is that help in financial measurements of the profitability of
an organisation. This depicts the ability of an organisation regarding generation of profit against
the value invested on labour and material cost. If the ratio of gross profit increases then it
indicates the growth of the organisation. On the other hand, if decrement is noticed then depicts
low organisational ability to operate functions and earn profitability.
Particulars 2017 2018
Gross profit 517 544
Net sales 2022 2534
Formula Gross profit / Net sales *100
2
within industry is the another challenge that coffee house industry faces as there are many
organisations operating in sector which gives tough competition to the refereed company. Apart
from these entry of new entrants in the industry also creates threat for the firms operating in
sector. The main reason of intense rivalry in industry is high margin of profits which are enjoyed
by the companies involved in it (Finke, 2013).
Part 2: Business Performance Analysis
2.1 Statement of Profit or Loss
It is analysed from the income statement of Roast Ltd. helps Starbuck's chief financial
officer in taking appropriate decision associated with Roast Ltd.'s acquisition. From this
statement, it can be said that revenues of firm is increasing constantly as in 2017, the recorded
total sales resulted in revenue of £2022000 which maximizing at £2534000 in year 2018. Apart
from the revenue, net profit and gross profit of the firm are also improved which gives an
evidence that it is able to grow and sustain in competitive market environment. In year 2017, the
total operating expenses of firm has also increased along with the profits and were transacted as
£477000 and £466000 in year 2018.
The overall analysis in respect to the current project is further done on the basis of ratio
analysis. This will provides an opportunity in effective evaluation of the financial performance of
an organisation (Gal, Stewart and Hanne, 2013).
Gross profit margin
The importance of this ratio is that help in financial measurements of the profitability of
an organisation. This depicts the ability of an organisation regarding generation of profit against
the value invested on labour and material cost. If the ratio of gross profit increases then it
indicates the growth of the organisation. On the other hand, if decrement is noticed then depicts
low organisational ability to operate functions and earn profitability.
Particulars 2017 2018
Gross profit 517 544
Net sales 2022 2534
Formula Gross profit / Net sales *100
2
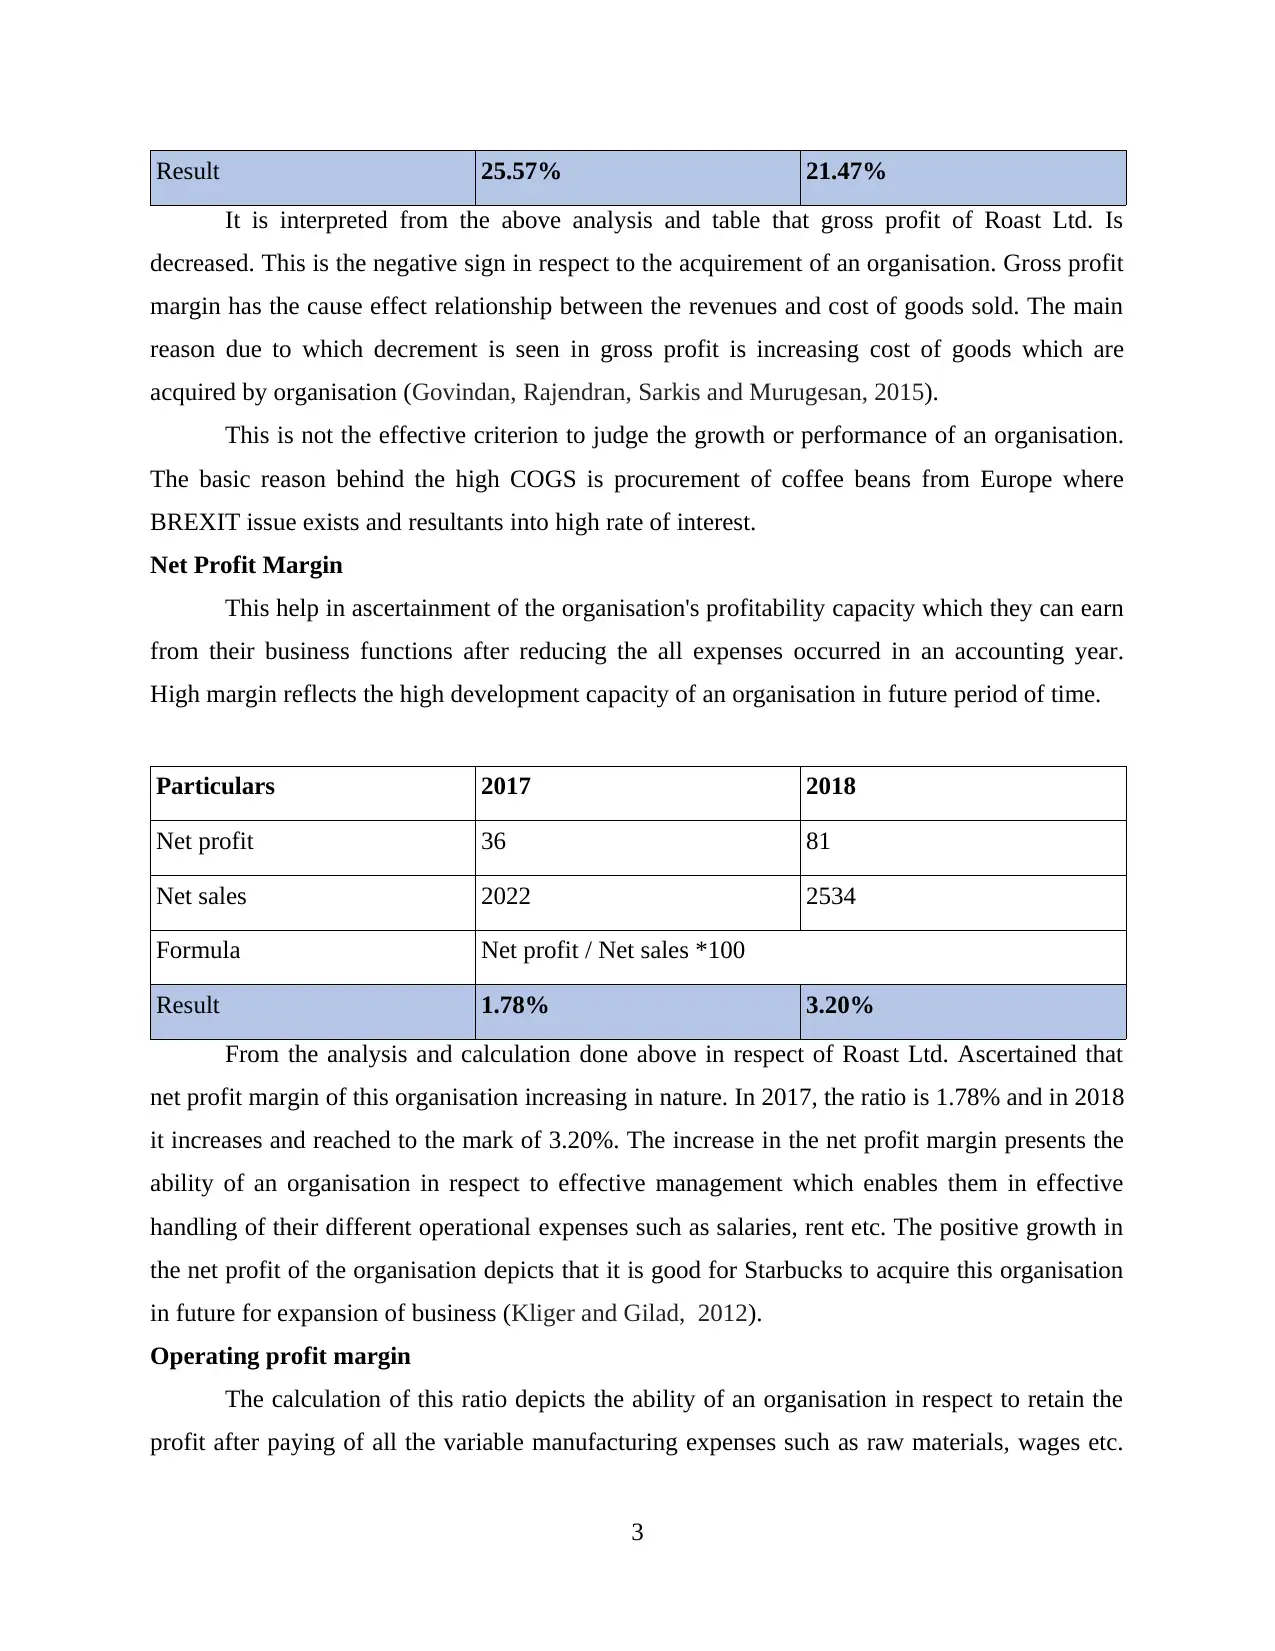
Result 25.57% 21.47%
It is interpreted from the above analysis and table that gross profit of Roast Ltd. Is
decreased. This is the negative sign in respect to the acquirement of an organisation. Gross profit
margin has the cause effect relationship between the revenues and cost of goods sold. The main
reason due to which decrement is seen in gross profit is increasing cost of goods which are
acquired by organisation (Govindan, Rajendran, Sarkis and Murugesan, 2015).
This is not the effective criterion to judge the growth or performance of an organisation.
The basic reason behind the high COGS is procurement of coffee beans from Europe where
BREXIT issue exists and resultants into high rate of interest.
Net Profit Margin
This help in ascertainment of the organisation's profitability capacity which they can earn
from their business functions after reducing the all expenses occurred in an accounting year.
High margin reflects the high development capacity of an organisation in future period of time.
Particulars 2017 2018
Net profit 36 81
Net sales 2022 2534
Formula Net profit / Net sales *100
Result 1.78% 3.20%
From the analysis and calculation done above in respect of Roast Ltd. Ascertained that
net profit margin of this organisation increasing in nature. In 2017, the ratio is 1.78% and in 2018
it increases and reached to the mark of 3.20%. The increase in the net profit margin presents the
ability of an organisation in respect to effective management which enables them in effective
handling of their different operational expenses such as salaries, rent etc. The positive growth in
the net profit of the organisation depicts that it is good for Starbucks to acquire this organisation
in future for expansion of business (Kliger and Gilad, 2012).
Operating profit margin
The calculation of this ratio depicts the ability of an organisation in respect to retain the
profit after paying of all the variable manufacturing expenses such as raw materials, wages etc.
3
⊘ This is a preview!⊘
Do you want full access?
Subscribe today to unlock all pages.
Trusted by 1+ million students worldwide
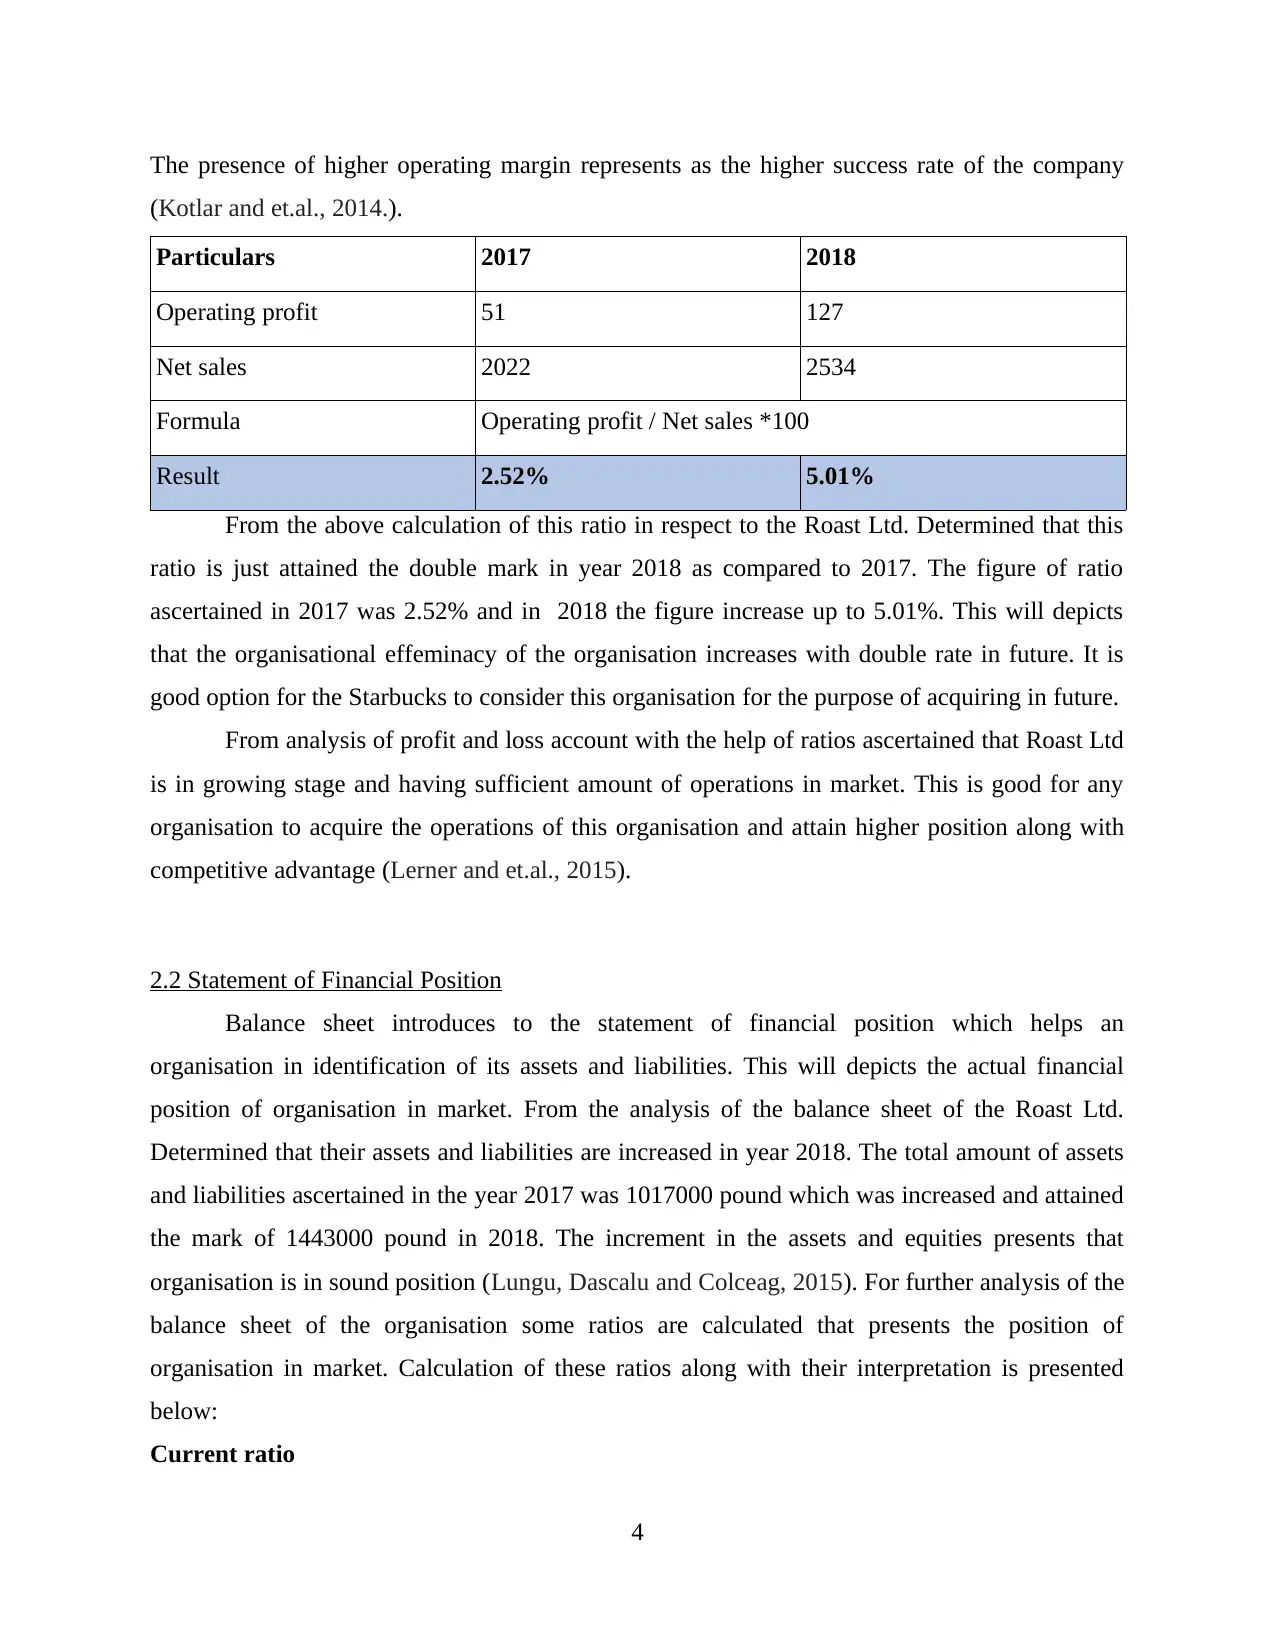
The presence of higher operating margin represents as the higher success rate of the company
(Kotlar and et.al., 2014.).
Particulars 2017 2018
Operating profit 51 127
Net sales 2022 2534
Formula Operating profit / Net sales *100
Result 2.52% 5.01%
From the above calculation of this ratio in respect to the Roast Ltd. Determined that this
ratio is just attained the double mark in year 2018 as compared to 2017. The figure of ratio
ascertained in 2017 was 2.52% and in 2018 the figure increase up to 5.01%. This will depicts
that the organisational effeminacy of the organisation increases with double rate in future. It is
good option for the Starbucks to consider this organisation for the purpose of acquiring in future.
From analysis of profit and loss account with the help of ratios ascertained that Roast Ltd
is in growing stage and having sufficient amount of operations in market. This is good for any
organisation to acquire the operations of this organisation and attain higher position along with
competitive advantage (Lerner and et.al., 2015).
2.2 Statement of Financial Position
Balance sheet introduces to the statement of financial position which helps an
organisation in identification of its assets and liabilities. This will depicts the actual financial
position of organisation in market. From the analysis of the balance sheet of the Roast Ltd.
Determined that their assets and liabilities are increased in year 2018. The total amount of assets
and liabilities ascertained in the year 2017 was 1017000 pound which was increased and attained
the mark of 1443000 pound in 2018. The increment in the assets and equities presents that
organisation is in sound position (Lungu, Dascalu and Colceag, 2015). For further analysis of the
balance sheet of the organisation some ratios are calculated that presents the position of
organisation in market. Calculation of these ratios along with their interpretation is presented
below:
Current ratio
4
Paraphrase This Document
Need a fresh take? Get an instant paraphrase of this document with our AI Paraphraser
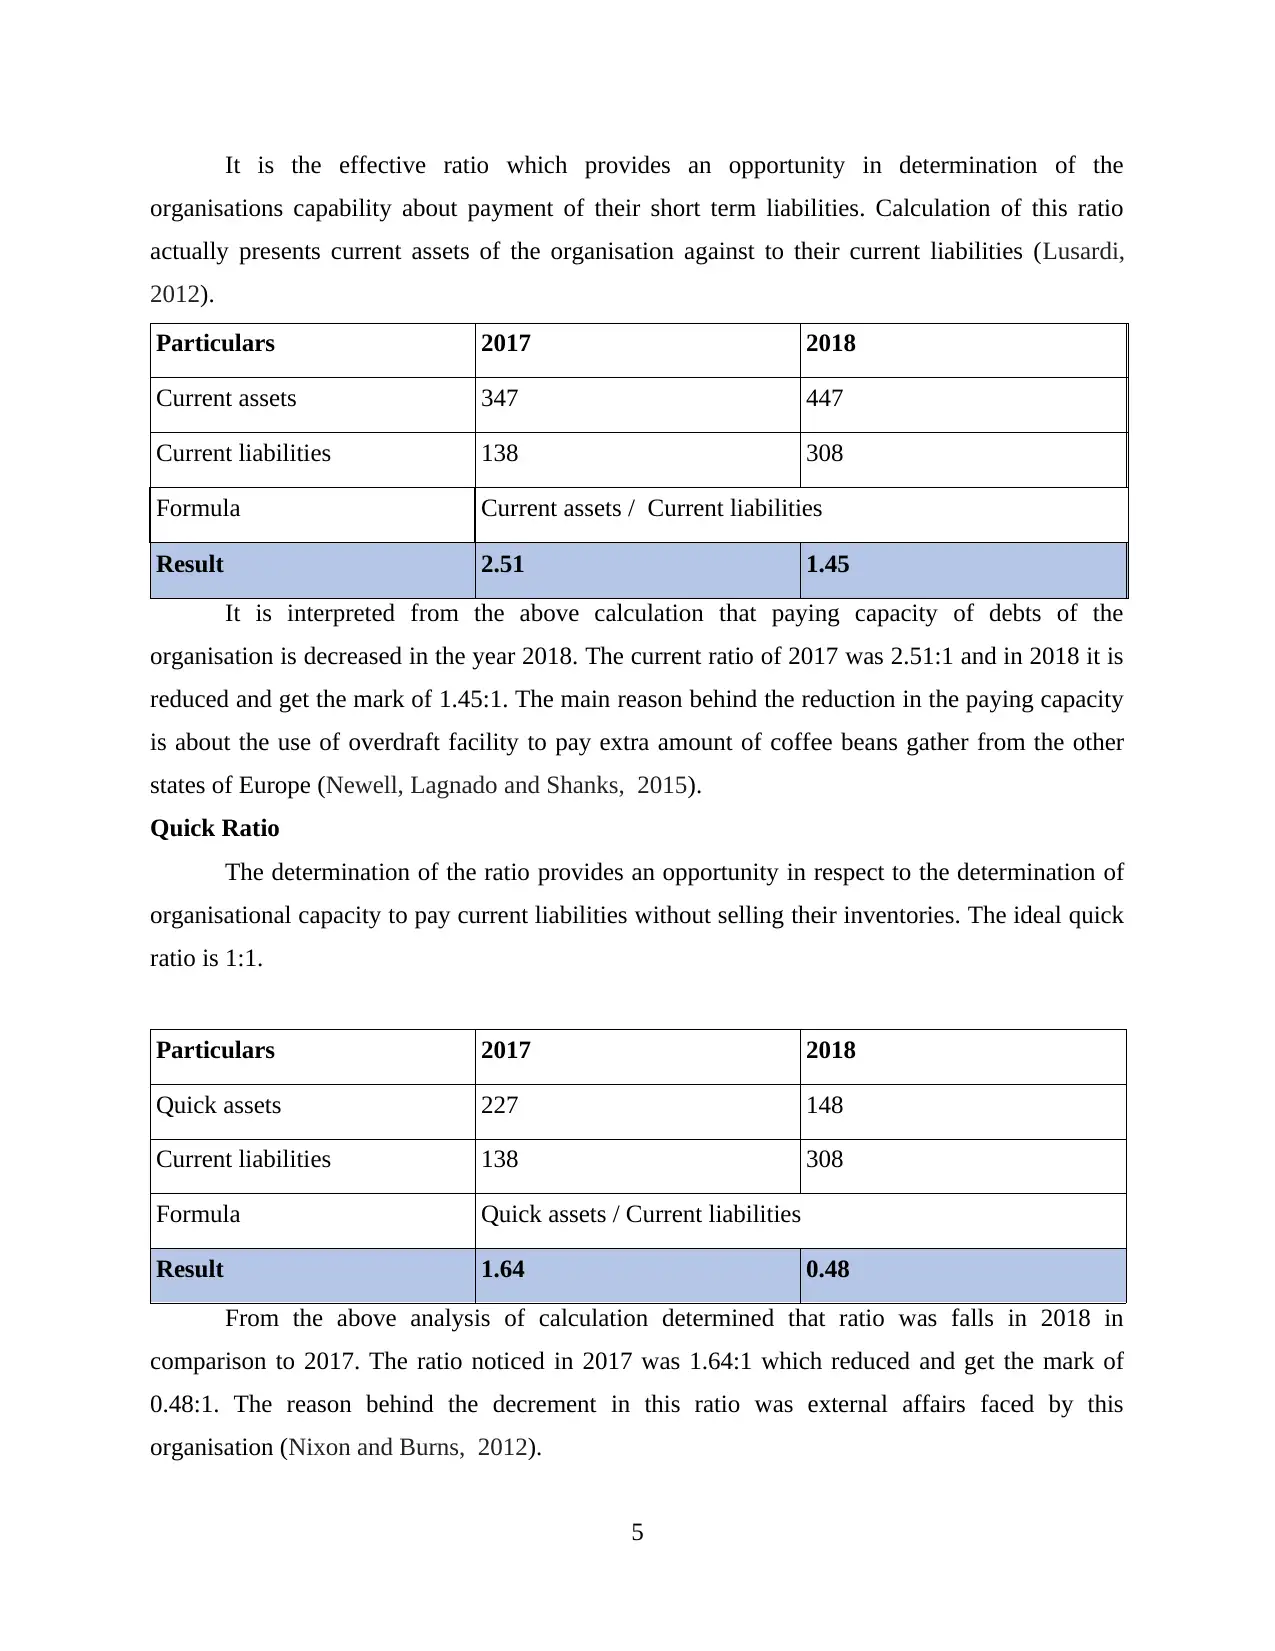
It is the effective ratio which provides an opportunity in determination of the
organisations capability about payment of their short term liabilities. Calculation of this ratio
actually presents current assets of the organisation against to their current liabilities (Lusardi,
2012).
Particulars 2017 2018
Current assets 347 447
Current liabilities 138 308
Formula Current assets / Current liabilities
Result 2.51 1.45
It is interpreted from the above calculation that paying capacity of debts of the
organisation is decreased in the year 2018. The current ratio of 2017 was 2.51:1 and in 2018 it is
reduced and get the mark of 1.45:1. The main reason behind the reduction in the paying capacity
is about the use of overdraft facility to pay extra amount of coffee beans gather from the other
states of Europe (Newell, Lagnado and Shanks, 2015).
Quick Ratio
The determination of the ratio provides an opportunity in respect to the determination of
organisational capacity to pay current liabilities without selling their inventories. The ideal quick
ratio is 1:1.
Particulars 2017 2018
Quick assets 227 148
Current liabilities 138 308
Formula Quick assets / Current liabilities
Result 1.64 0.48
From the above analysis of calculation determined that ratio was falls in 2018 in
comparison to 2017. The ratio noticed in 2017 was 1.64:1 which reduced and get the mark of
0.48:1. The reason behind the decrement in this ratio was external affairs faced by this
organisation (Nixon and Burns, 2012).
5
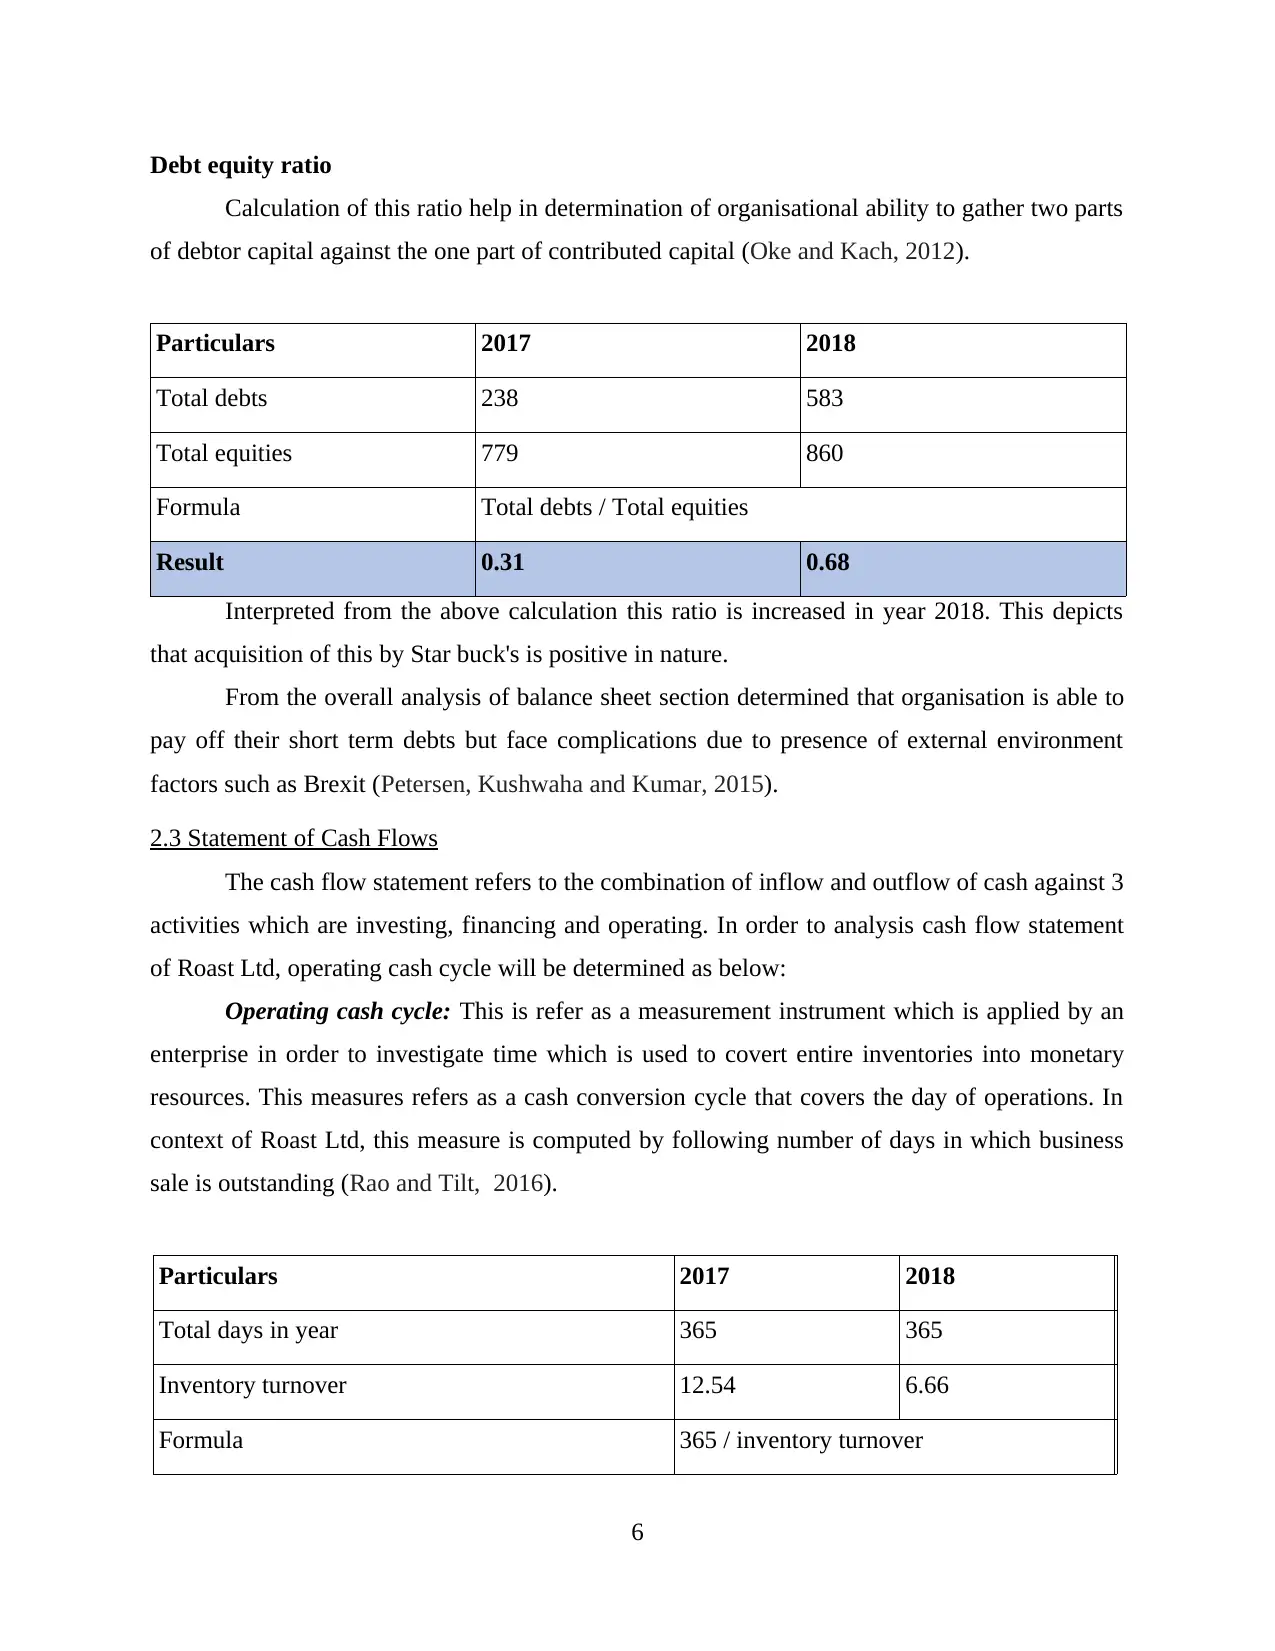
Debt equity ratio
Calculation of this ratio help in determination of organisational ability to gather two parts
of debtor capital against the one part of contributed capital (Oke and Kach, 2012).
Particulars 2017 2018
Total debts 238 583
Total equities 779 860
Formula Total debts / Total equities
Result 0.31 0.68
Interpreted from the above calculation this ratio is increased in year 2018. This depicts
that acquisition of this by Star buck's is positive in nature.
From the overall analysis of balance sheet section determined that organisation is able to
pay off their short term debts but face complications due to presence of external environment
factors such as Brexit (Petersen, Kushwaha and Kumar, 2015).
2.3 Statement of Cash Flows
The cash flow statement refers to the combination of inflow and outflow of cash against 3
activities which are investing, financing and operating. In order to analysis cash flow statement
of Roast Ltd, operating cash cycle will be determined as below:
Operating cash cycle: This is refer as a measurement instrument which is applied by an
enterprise in order to investigate time which is used to covert entire inventories into monetary
resources. This measures refers as a cash conversion cycle that covers the day of operations. In
context of Roast Ltd, this measure is computed by following number of days in which business
sale is outstanding (Rao and Tilt, 2016).
Particulars 2017 2018
Total days in year 365 365
Inventory turnover 12.54 6.66
Formula 365 / inventory turnover
6
⊘ This is a preview!⊘
Do you want full access?
Subscribe today to unlock all pages.
Trusted by 1+ million students worldwide
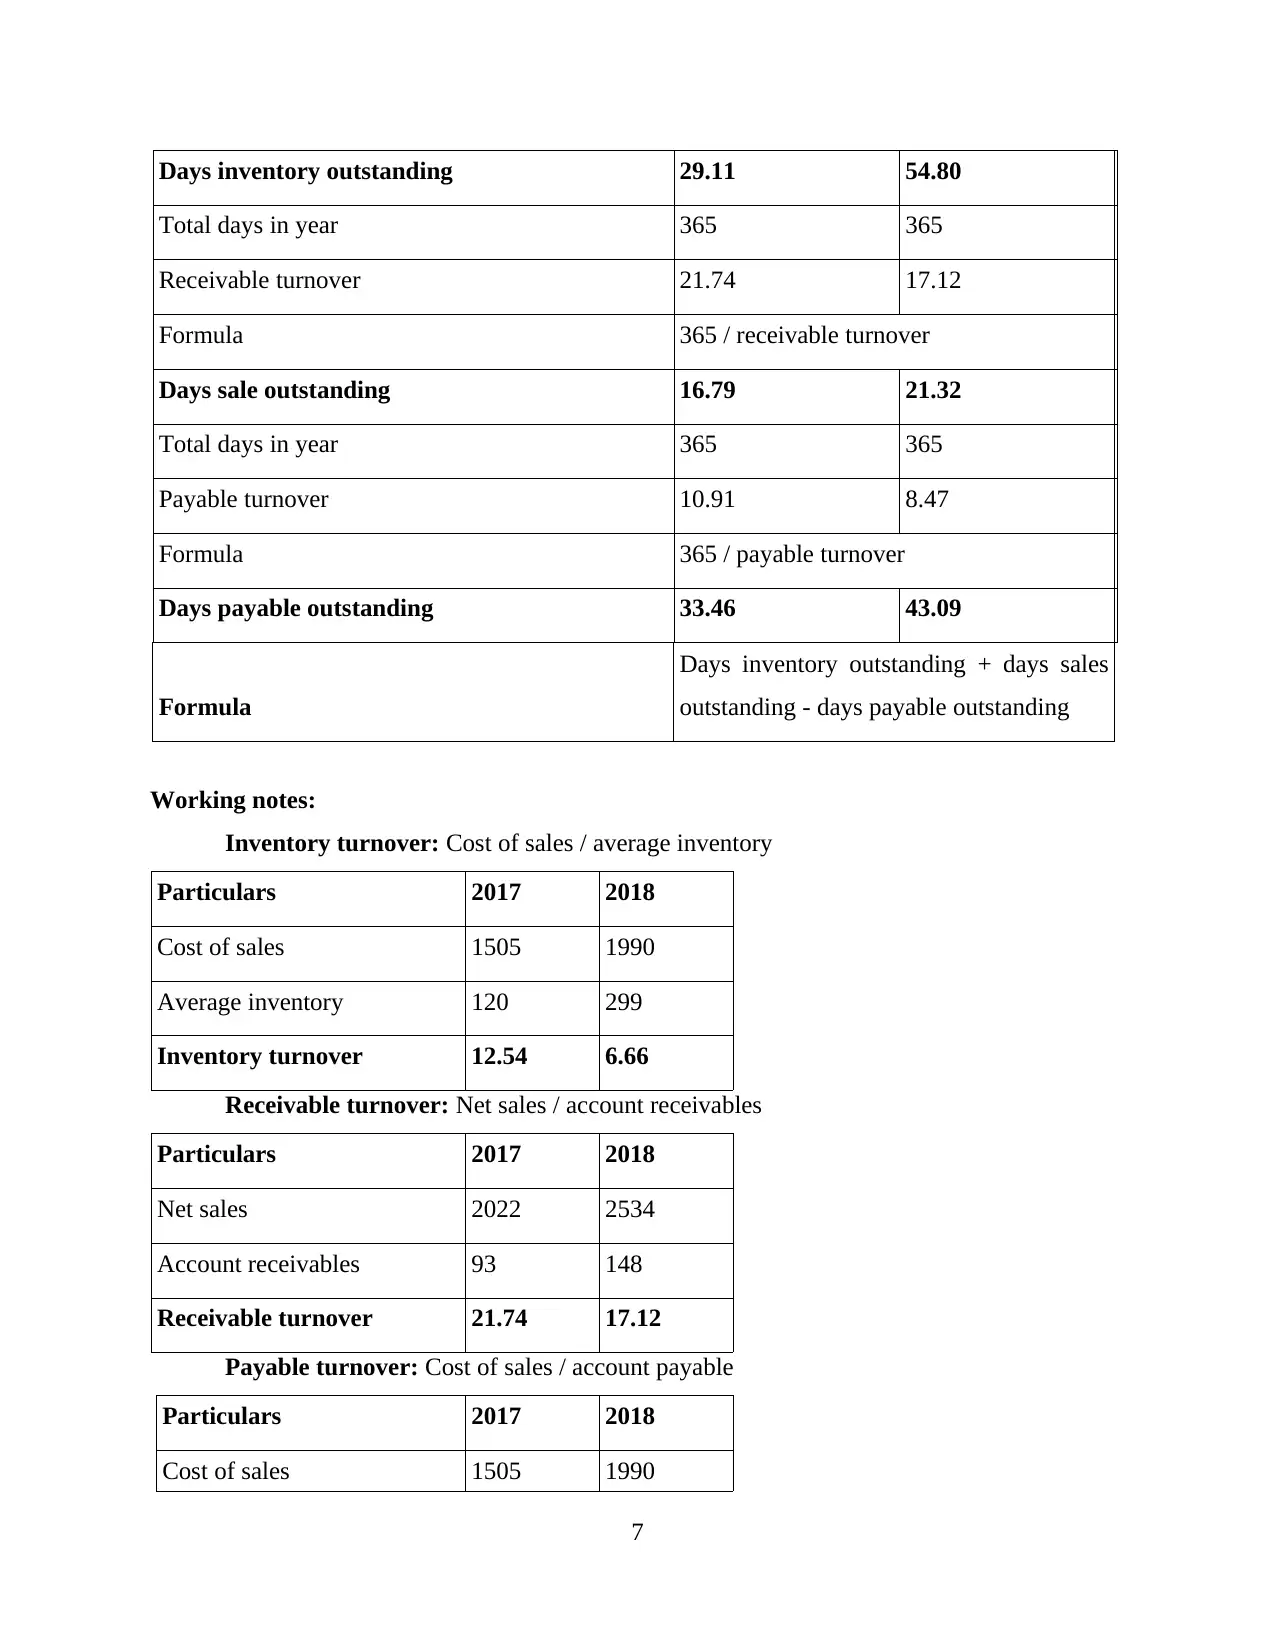
Days inventory outstanding 29.11 54.80
Total days in year 365 365
Receivable turnover 21.74 17.12
Formula 365 / receivable turnover
Days sale outstanding 16.79 21.32
Total days in year 365 365
Payable turnover 10.91 8.47
Formula 365 / payable turnover
Days payable outstanding 33.46 43.09
Formula
Days inventory outstanding + days sales
outstanding - days payable outstanding
Working notes:
Inventory turnover: Cost of sales / average inventory
Particulars 2017 2018
Cost of sales 1505 1990
Average inventory 120 299
Inventory turnover 12.54 6.66
Receivable turnover: Net sales / account receivables
Particulars 2017 2018
Net sales 2022 2534
Account receivables 93 148
Receivable turnover 21.74 17.12
Payable turnover: Cost of sales / account payable
Particulars 2017 2018
Cost of sales 1505 1990
7
Total days in year 365 365
Receivable turnover 21.74 17.12
Formula 365 / receivable turnover
Days sale outstanding 16.79 21.32
Total days in year 365 365
Payable turnover 10.91 8.47
Formula 365 / payable turnover
Days payable outstanding 33.46 43.09
Formula
Days inventory outstanding + days sales
outstanding - days payable outstanding
Working notes:
Inventory turnover: Cost of sales / average inventory
Particulars 2017 2018
Cost of sales 1505 1990
Average inventory 120 299
Inventory turnover 12.54 6.66
Receivable turnover: Net sales / account receivables
Particulars 2017 2018
Net sales 2022 2534
Account receivables 93 148
Receivable turnover 21.74 17.12
Payable turnover: Cost of sales / account payable
Particulars 2017 2018
Cost of sales 1505 1990
7
Paraphrase This Document
Need a fresh take? Get an instant paraphrase of this document with our AI Paraphraser
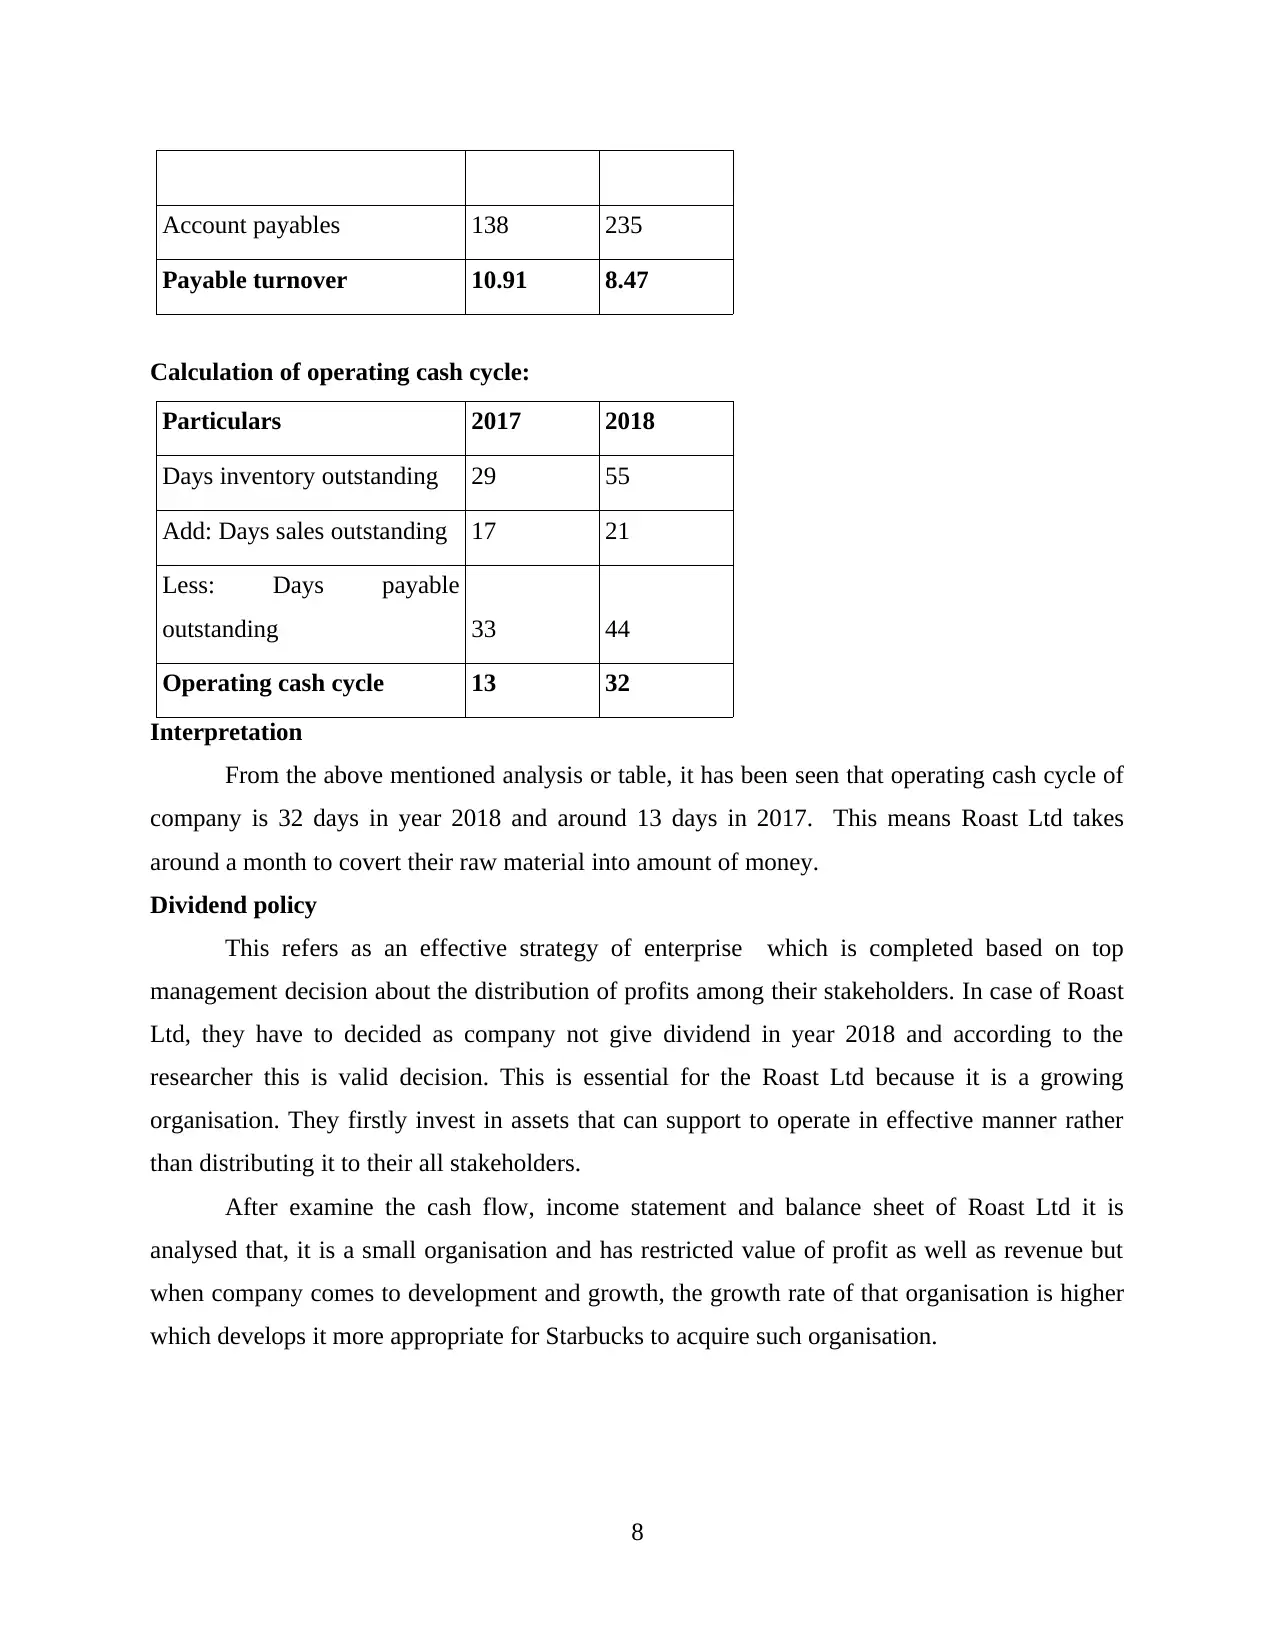
Account payables 138 235
Payable turnover 10.91 8.47
Calculation of operating cash cycle:
Particulars 2017 2018
Days inventory outstanding 29 55
Add: Days sales outstanding 17 21
Less: Days payable
outstanding 33 44
Operating cash cycle 13 32
Interpretation
From the above mentioned analysis or table, it has been seen that operating cash cycle of
company is 32 days in year 2018 and around 13 days in 2017. This means Roast Ltd takes
around a month to covert their raw material into amount of money.
Dividend policy
This refers as an effective strategy of enterprise which is completed based on top
management decision about the distribution of profits among their stakeholders. In case of Roast
Ltd, they have to decided as company not give dividend in year 2018 and according to the
researcher this is valid decision. This is essential for the Roast Ltd because it is a growing
organisation. They firstly invest in assets that can support to operate in effective manner rather
than distributing it to their all stakeholders.
After examine the cash flow, income statement and balance sheet of Roast Ltd it is
analysed that, it is a small organisation and has restricted value of profit as well as revenue but
when company comes to development and growth, the growth rate of that organisation is higher
which develops it more appropriate for Starbucks to acquire such organisation.
8
Part 3: Investment Appraisal and Sources of Finance
3.1 Investment Appraisal
Management Forecast
Roast limited is one of the growing firm which is planning to expand its business
operations in Romania by introducing new coffee outlet in the region. The company's
administration has decided to introduced this project in year 2017. The prediction by
management reflects that company will earn £300 million of revenue in year 2017 which will
increase in 2018 as £560 million, £740 million in year 2019, £900 million in 2020 and in year
2021, £1120 millions. High variable cost will be incur by company on its operations and will
secure adequate cash flows. The forecasted values of cash inflows includes £60 million in year
2017, in 2018 the value is £112 million, £148 millions in year 2019, £180 millions and £224
millions in year 2020 and 2021.
The above mentioned analysis depicts that organisation will generate higher profits and
revenues in tenure of 5 years. In the forecast of management, no contingencies are included
which may results in financial problems (Seshan and Yang, 2014).
Investment Appraisal Techniques
Payback period
Payback period can be defined as the time which a company needed to recover the initial
investment made by it. This is an investment appraisal approach that is assistive to company in
determining that how much time is taken by it to recoup the initial investments made. It is
observed that the payback period of company is to be 4 years which determines that it recovers
£500 millions of investment in the period of four years only. There are some advantages and
drawbacks of utilizing payback period technique. Companies use this tool as it is easily
understandable and simple to use which do not require any additional skills to calculate payback
period. It administers quick solution and is utilize in uncertainty situation. Apart from these
advantages, there are some disadvantages also as the technique involves unlike coverage of cash
flows and ignorance to time value of money. An analysis can be limit by this approach by
disregard return on investment as well profitability margin (Starcke and Brand, 2012).
Accounting Rate of Return
Accounting rate of return is also average rate of return (ARR) which can be defined as a
financial ratio that is utilized in capital budgeting. The time value of money concept is not taken
9
⊘ This is a preview!⊘
Do you want full access?
Subscribe today to unlock all pages.
Trusted by 1+ million students worldwide
1 out of 17
Related Documents


Your All-in-One AI-Powered Toolkit for Academic Success.
+13062052269
info@desklib.com
Available 24*7 on WhatsApp / Email
![[object Object]](/_next/static/media/star-bottom.7253800d.svg)
Unlock your academic potential
Copyright © 2020–2026 A2Z Services. All Rights Reserved. Developed and managed by ZUCOL.