In-depth Financial Performance Analysis of Spritzer BHD, Malaysia
VerifiedAdded on 2023/04/07
|20
|3359
|221
Report
AI Summary
This report provides a comprehensive financial performance analysis of Spritzer BHD, a Malaysian water bottling company. It examines various financial aspects, including competitor and industry analysis, liquidity, profitability, and efficiency ratios. The report calculates working capital, analyzes the company's capital structure, and evaluates stock performance. Key findings indicate improvements in liquidity ratios, stable gross profit margins, but concerns regarding net profit margins and return on capital employed. The efficiency analysis reveals a good inventory control system, but challenges in collecting receivables. The report concludes with recommendations for maintaining optimal working capital levels and improving profitability.
Running head: FINANCIAL PERFORMANCE ANALYSIS
Financial Performance Analysis
Name of the Student
Name of the University
Author Note
Financial Performance Analysis
Name of the Student
Name of the University
Author Note
Paraphrase This Document
Need a fresh take? Get an instant paraphrase of this document with our AI Paraphraser
1FINANCIAL PERFORMANCE ANALYSIS
Executive Summary
The purpose of the project is to determine the financial position of a company by measuring the
financial performances of the Spritzer Company. Different tools of measuring the financial
performance has been utilised in this report. A water producing, packaging and bottling
manufacturing company, namely Spritzer has been selected in this report. The profitability,
liquidity and efficiency ratios have been calculated. The working capital has been calculated and
the capital structure of the company is also analysed. The stock performance analysis has also
been portrayed in this report. The report is concluded by proper discussion of the financial
position of the company with lights on all the key financial indicators.
2FINANCIAL PERFORMANCE ANALYSIS
Table of Contents
Introduction......................................................................................................................................3
Discussion........................................................................................................................................3
Competitor Analysis....................................................................................................................3
Industry Analysis.........................................................................................................................4
Financial Analysis.......................................................................................................................4
Ratio Analysis..............................................................................................................................5
Working Capital Management.....................................................................................................9
Stock Ratio Analysis..................................................................................................................12
Stock Performance Analysis......................................................................................................14
Conclusion and Recommendations................................................................................................14
References......................................................................................................................................16
⊘ This is a preview!⊘
Do you want full access?
Subscribe today to unlock all pages.
Trusted by 1+ million students worldwide
3FINANCIAL PERFORMANCE ANALYSIS
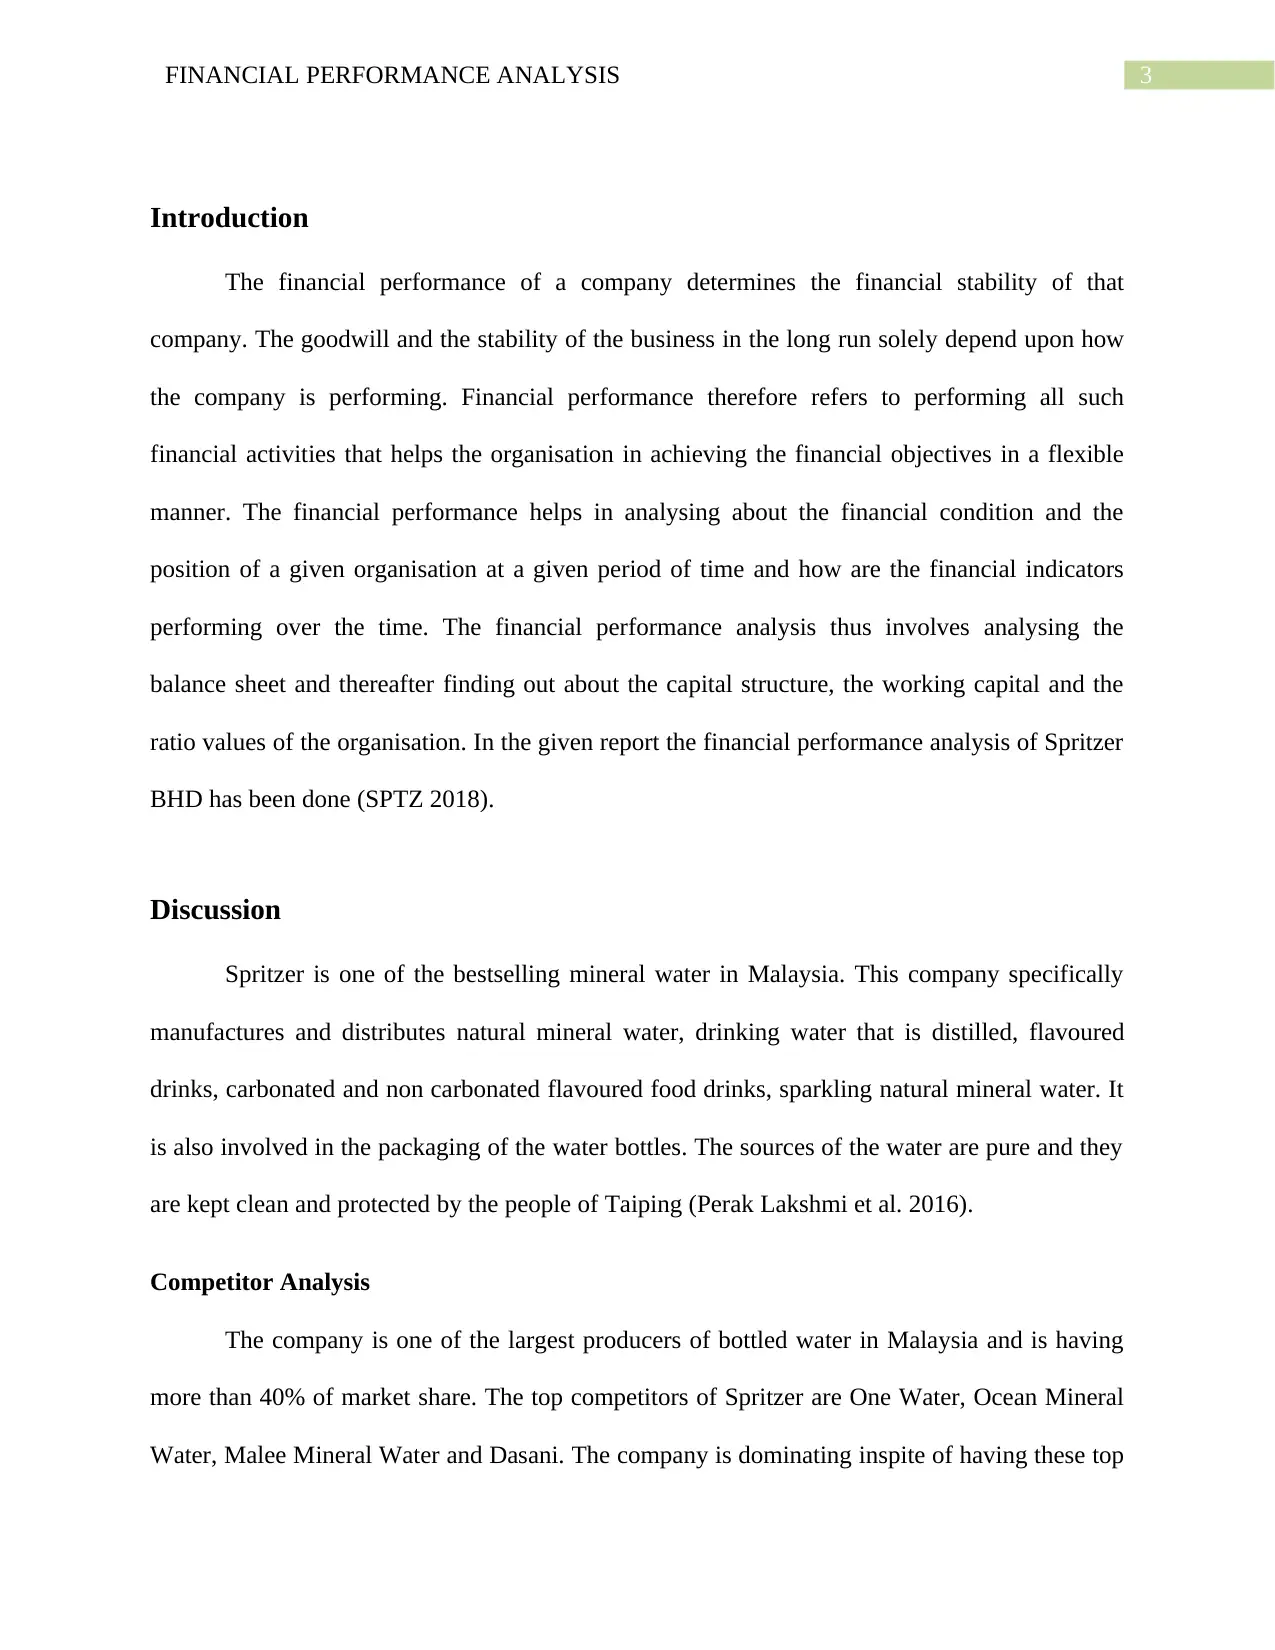
Introduction
The financial performance of a company determines the financial stability of that
company. The goodwill and the stability of the business in the long run solely depend upon how
the company is performing. Financial performance therefore refers to performing all such
financial activities that helps the organisation in achieving the financial objectives in a flexible
manner. The financial performance helps in analysing about the financial condition and the
position of a given organisation at a given period of time and how are the financial indicators
performing over the time. The financial performance analysis thus involves analysing the
balance sheet and thereafter finding out about the capital structure, the working capital and the
ratio values of the organisation. In the given report the financial performance analysis of Spritzer
BHD has been done (SPTZ 2018).
Discussion
Spritzer is one of the bestselling mineral water in Malaysia. This company specifically
manufactures and distributes natural mineral water, drinking water that is distilled, flavoured
drinks, carbonated and non carbonated flavoured food drinks, sparkling natural mineral water. It
is also involved in the packaging of the water bottles. The sources of the water are pure and they
are kept clean and protected by the people of Taiping (Perak Lakshmi et al. 2016).
Competitor Analysis
The company is one of the largest producers of bottled water in Malaysia and is having
more than 40% of market share. The top competitors of Spritzer are One Water, Ocean Mineral
Water, Malee Mineral Water and Dasani. The company is dominating inspite of having these top
Paraphrase This Document
Need a fresh take? Get an instant paraphrase of this document with our AI Paraphraser
4FINANCIAL PERFORMANCE ANALYSIS
competitors because of its differentiation in the product, the low cost of production and the high
entry of entry and exit barriers in this industry (Easton and Sommers 2018).
Industry Analysis
The company has a good and clean source of water at the facility at Taiping facility
because of which it can sell its product at higher prices than the other drinking waters. The
company also have its own bottle and cap manufacturing unit, its own warehouse and also owns
a distribution channel (Finance.yahoo.com 2017). The bottles produced by the company also
have a unique shape that does not waste any spaces unnecessarily. There are different bottles for
different types of age group for example the Spritzer pop bottles are targeted towards the kids.
The green colour on the bottle with a large logo on the front has been done in order to make the
bottle look nature friendly. Therefore the company has positioned themselves as one of the most
nature friendly water producer as well as bottle manufacturers (Markets.ft.com 2017). The
market of this company is segmented as per the basis of its flavour type, origin as well as sales
channel. The company involves a number of friendly hands in their activities. The key players
involved with this company are Hoxie Spritzer, The Grand Canyon Wine Co., Union Wine
Company, Porch Pounder, Latitude Beverage Co. Mancan Wine LLC. and Francis and Ford
Coppola Winery (Rodrigues and Rodrigues 2018).
Financial Analysis
The financial position of the company has been determined by calculating the various
kinds of ratios like the liquidity ratio, the profitability ratios, capital structure ratios, working
capital as well as the stock performance analysis. The following paragraphs explains the
company’s performance with respect to each of these financial ratios (Islam 2014).
5FINANCIAL PERFORMANCE ANALYSIS
Ratio Analysis
Ratio analysis helps in understanding the financial position of the company with respect
to its customers. The various key financial indicators are determined and analysed to find
different kind of ratios. The solvency, the efficiency and the profitability of the firm can be
accurately assessed with this analysis (Marketscreener.com 2018).
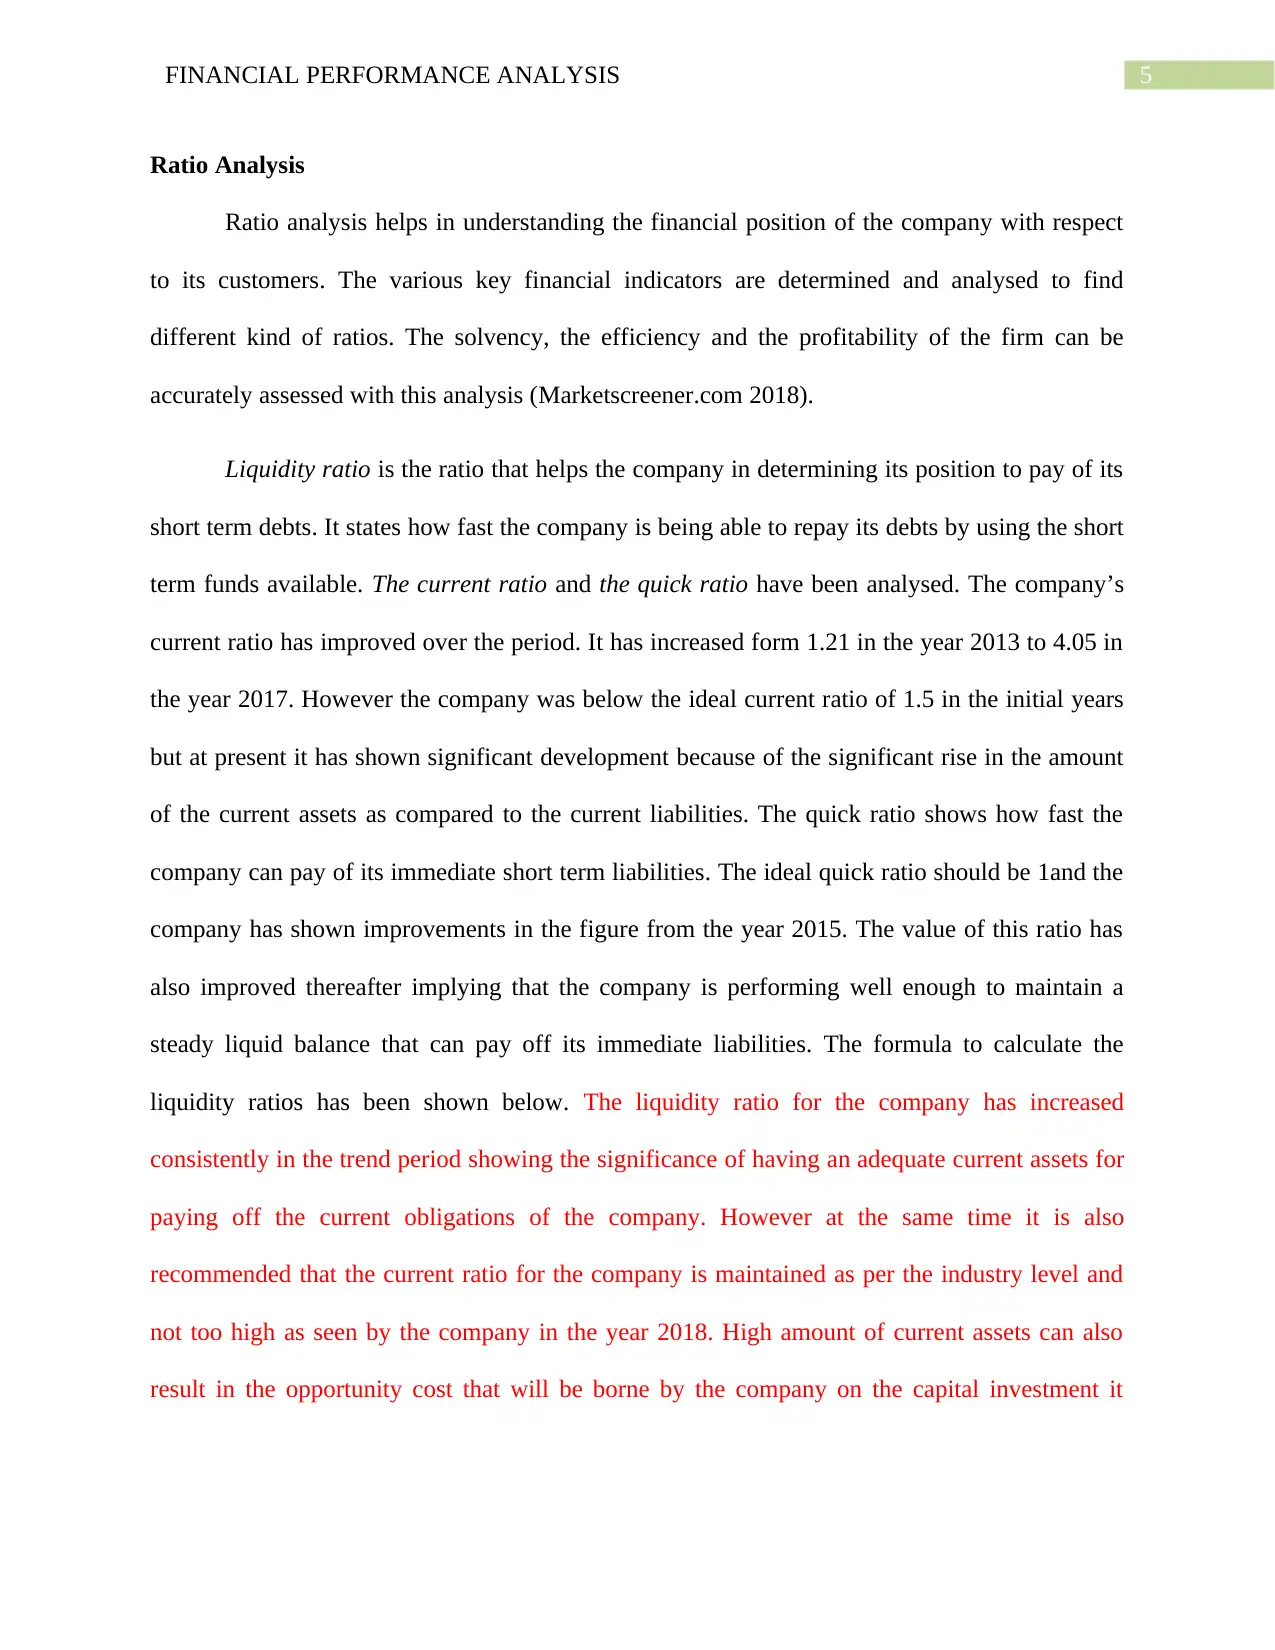
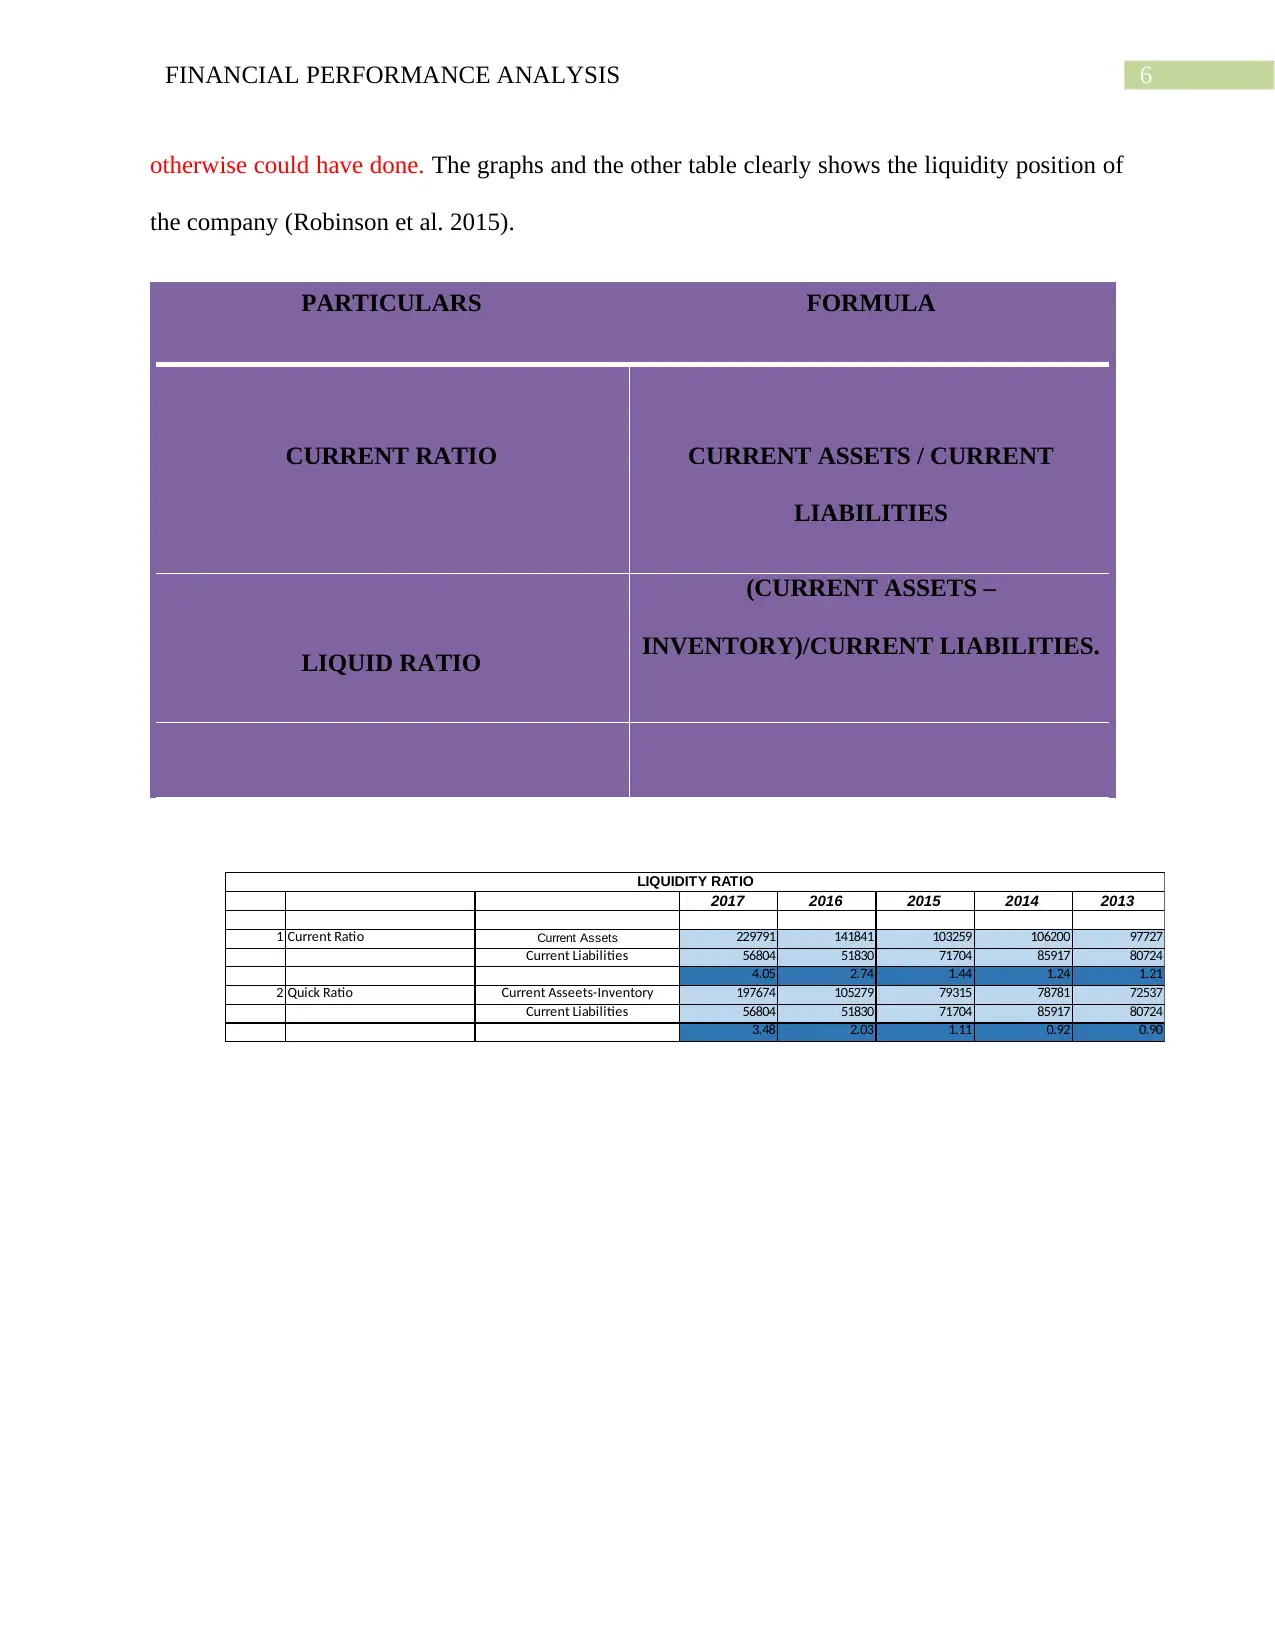
Liquidity ratio is the ratio that helps the company in determining its position to pay of its
short term debts. It states how fast the company is being able to repay its debts by using the short
term funds available. The current ratio and the quick ratio have been analysed. The company’s
current ratio has improved over the period. It has increased form 1.21 in the year 2013 to 4.05 in
the year 2017. However the company was below the ideal current ratio of 1.5 in the initial years
but at present it has shown significant development because of the significant rise in the amount
of the current assets as compared to the current liabilities. The quick ratio shows how fast the
company can pay of its immediate short term liabilities. The ideal quick ratio should be 1and the
company has shown improvements in the figure from the year 2015. The value of this ratio has
also improved thereafter implying that the company is performing well enough to maintain a
steady liquid balance that can pay off its immediate liabilities. The formula to calculate the
liquidity ratios has been shown below. The liquidity ratio for the company has increased
consistently in the trend period showing the significance of having an adequate current assets for
paying off the current obligations of the company. However at the same time it is also
recommended that the current ratio for the company is maintained as per the industry level and
not too high as seen by the company in the year 2018. High amount of current assets can also
result in the opportunity cost that will be borne by the company on the capital investment it
Ratio Analysis
Ratio analysis helps in understanding the financial position of the company with respect
to its customers. The various key financial indicators are determined and analysed to find
different kind of ratios. The solvency, the efficiency and the profitability of the firm can be
accurately assessed with this analysis (Marketscreener.com 2018).
Liquidity ratio is the ratio that helps the company in determining its position to pay of its
short term debts. It states how fast the company is being able to repay its debts by using the short
term funds available. The current ratio and the quick ratio have been analysed. The company’s
current ratio has improved over the period. It has increased form 1.21 in the year 2013 to 4.05 in
the year 2017. However the company was below the ideal current ratio of 1.5 in the initial years
but at present it has shown significant development because of the significant rise in the amount
of the current assets as compared to the current liabilities. The quick ratio shows how fast the
company can pay of its immediate short term liabilities. The ideal quick ratio should be 1and the
company has shown improvements in the figure from the year 2015. The value of this ratio has
also improved thereafter implying that the company is performing well enough to maintain a
steady liquid balance that can pay off its immediate liabilities. The formula to calculate the
liquidity ratios has been shown below. The liquidity ratio for the company has increased
consistently in the trend period showing the significance of having an adequate current assets for
paying off the current obligations of the company. However at the same time it is also
recommended that the current ratio for the company is maintained as per the industry level and
not too high as seen by the company in the year 2018. High amount of current assets can also
result in the opportunity cost that will be borne by the company on the capital investment it
⊘ This is a preview!⊘
Do you want full access?
Subscribe today to unlock all pages.
Trusted by 1+ million students worldwide
6FINANCIAL PERFORMANCE ANALYSIS
otherwise could have done. The graphs and the other table clearly shows the liquidity position of
the company (Robinson et al. 2015).
PARTICULARS FORMULA
CURRENT RATIO CURRENT ASSETS / CURRENT
LIABILITIES
LIQUID RATIO
(CURRENT ASSETS –
INVENTORY)/CURRENT LIABILITIES.
2017 2016 2015 2014 2013
1 Current Ratio Current Assets 229791 141841 103259 106200 97727
Current Liabilities 56804 51830 71704 85917 80724
4.05 2.74 1.44 1.24 1.21
2 Quick Ratio Current Asseets-Inventory 197674 105279 79315 78781 72537
Current Liabilities 56804 51830 71704 85917 80724
3.48 2.03 1.11 0.92 0.90
LIQUIDITY RATIO
Paraphrase This Document
Need a fresh take? Get an instant paraphrase of this document with our AI Paraphraser
7FINANCIAL PERFORMANCE ANALYSIS
2017 2016 2015 2014 2013
0.00
0.50
1.00
1.50
2.00
2.50
3.00
3.50
4.00
4.50
Liquidity Rati o
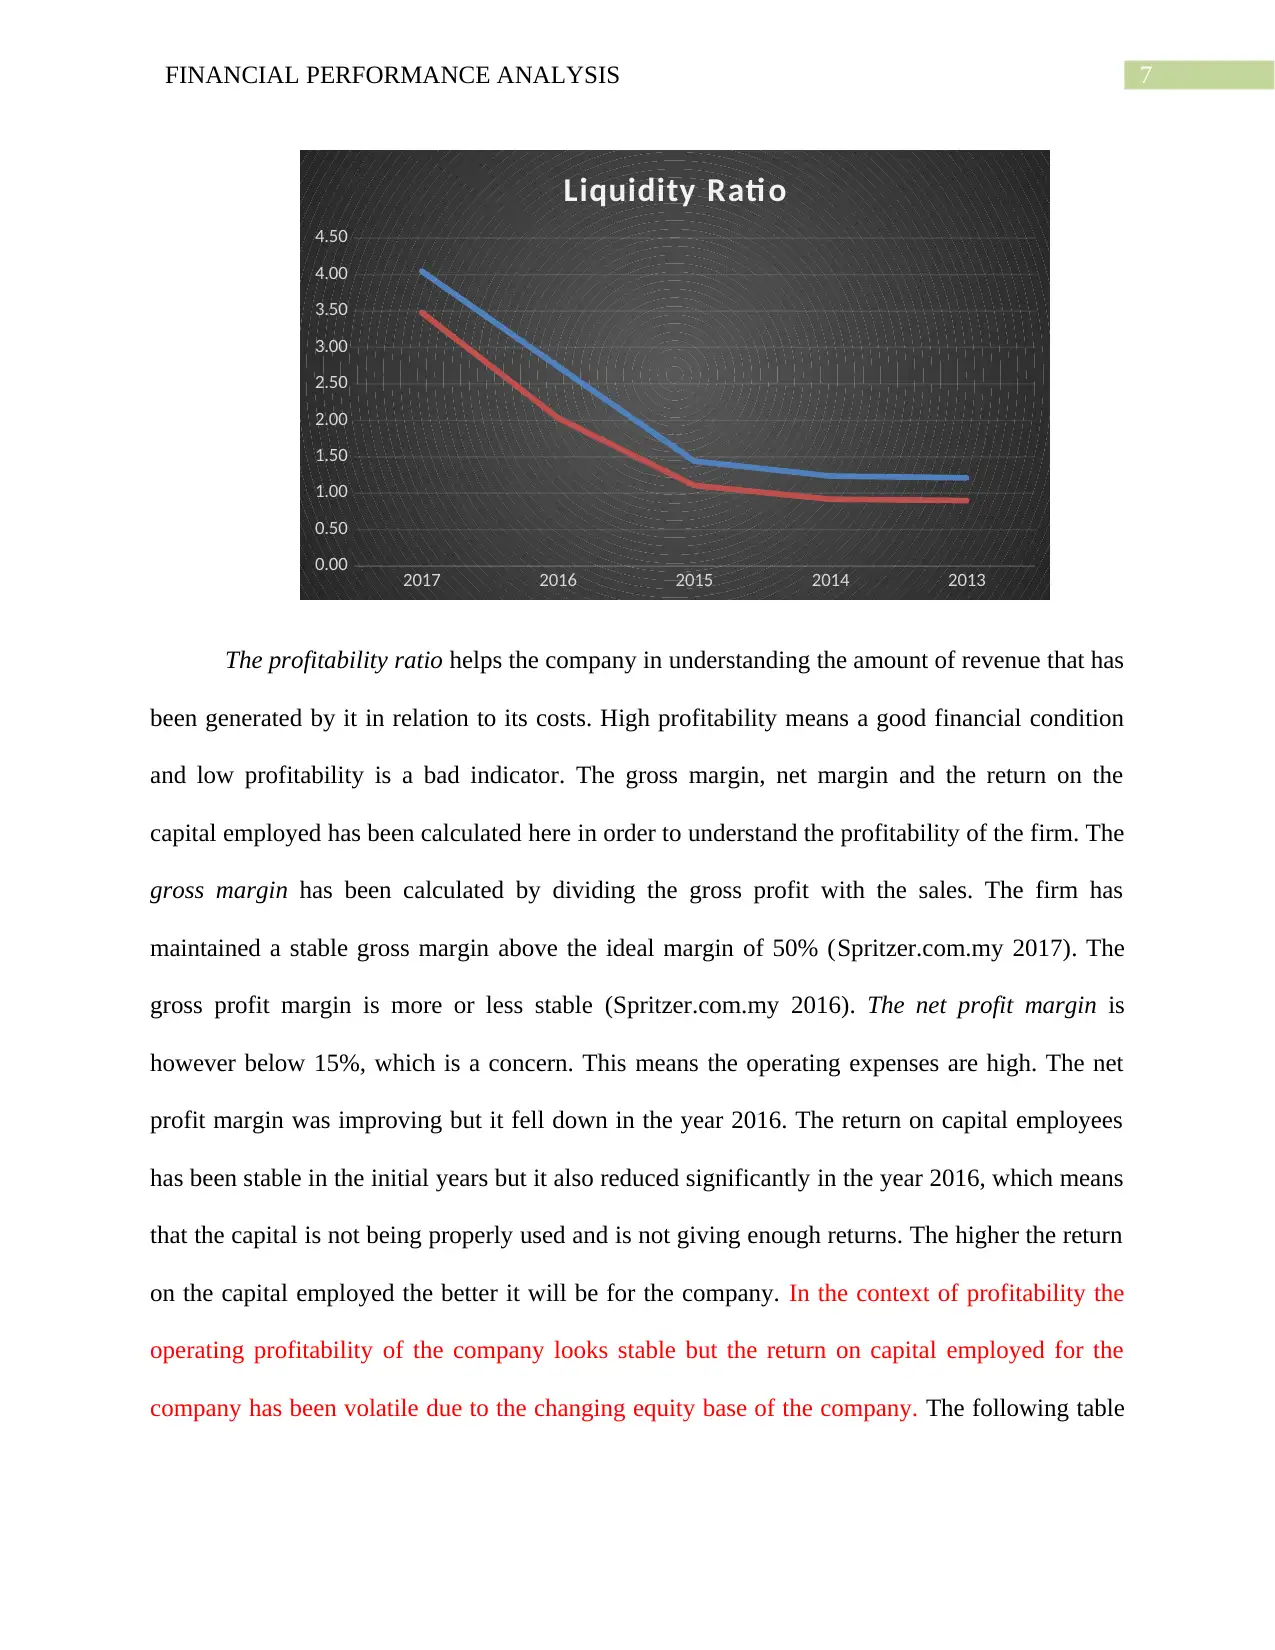
The profitability ratio helps the company in understanding the amount of revenue that has
been generated by it in relation to its costs. High profitability means a good financial condition
and low profitability is a bad indicator. The gross margin, net margin and the return on the
capital employed has been calculated here in order to understand the profitability of the firm. The
gross margin has been calculated by dividing the gross profit with the sales. The firm has
maintained a stable gross margin above the ideal margin of 50% (Spritzer.com.my 2017). The
gross profit margin is more or less stable (Spritzer.com.my 2016). The net profit margin is
however below 15%, which is a concern. This means the operating expenses are high. The net
profit margin was improving but it fell down in the year 2016. The return on capital employees
has been stable in the initial years but it also reduced significantly in the year 2016, which means
that the capital is not being properly used and is not giving enough returns. The higher the return
on the capital employed the better it will be for the company. In the context of profitability the
operating profitability of the company looks stable but the return on capital employed for the
company has been volatile due to the changing equity base of the company. The following table
2017 2016 2015 2014 2013
0.00
0.50
1.00
1.50
2.00
2.50
3.00
3.50
4.00
4.50
Liquidity Rati o
The profitability ratio helps the company in understanding the amount of revenue that has
been generated by it in relation to its costs. High profitability means a good financial condition
and low profitability is a bad indicator. The gross margin, net margin and the return on the
capital employed has been calculated here in order to understand the profitability of the firm. The
gross margin has been calculated by dividing the gross profit with the sales. The firm has
maintained a stable gross margin above the ideal margin of 50% (Spritzer.com.my 2017). The
gross profit margin is more or less stable (Spritzer.com.my 2016). The net profit margin is
however below 15%, which is a concern. This means the operating expenses are high. The net
profit margin was improving but it fell down in the year 2016. The return on capital employees
has been stable in the initial years but it also reduced significantly in the year 2016, which means
that the capital is not being properly used and is not giving enough returns. The higher the return
on the capital employed the better it will be for the company. In the context of profitability the
operating profitability of the company looks stable but the return on capital employed for the
company has been volatile due to the changing equity base of the company. The following table
8FINANCIAL PERFORMANCE ANALYSIS
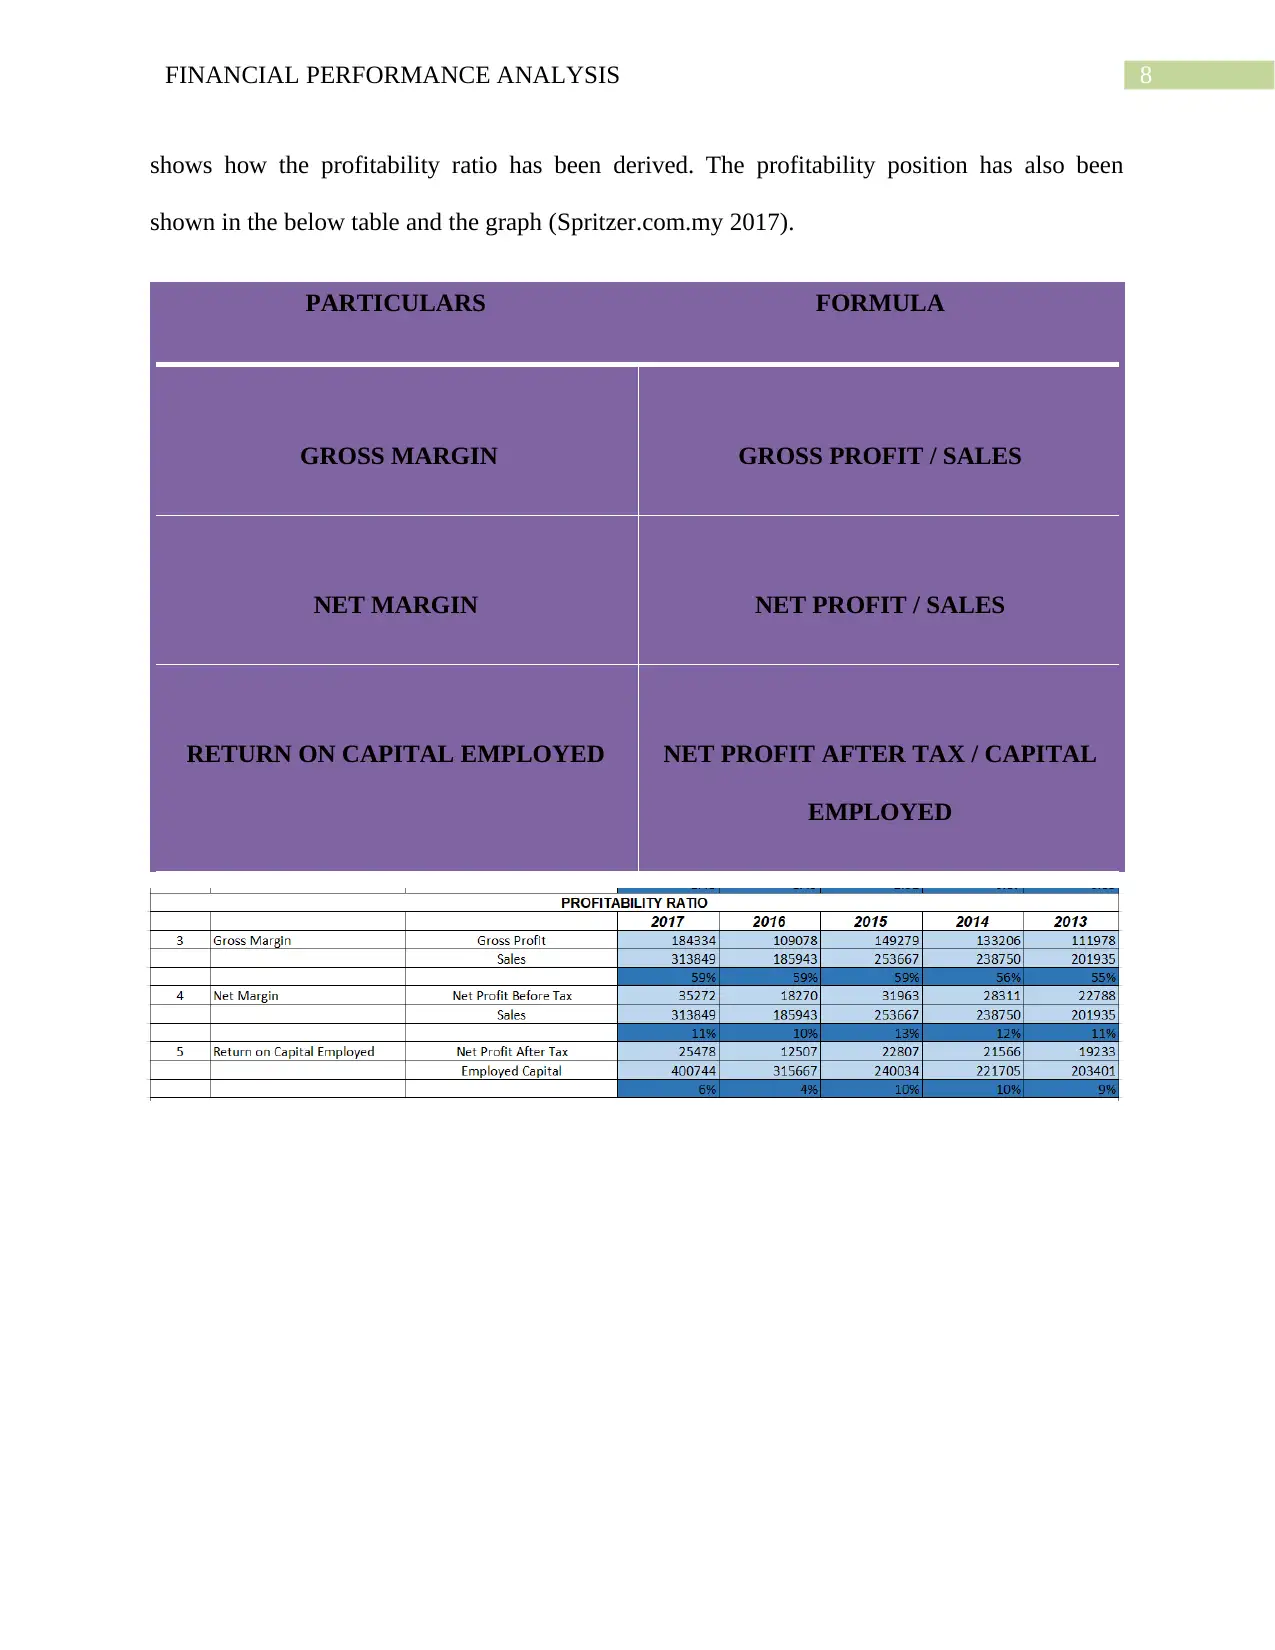
shows how the profitability ratio has been derived. The profitability position has also been
shown in the below table and the graph (Spritzer.com.my 2017).
PARTICULARS FORMULA
GROSS MARGIN GROSS PROFIT / SALES
NET MARGIN NET PROFIT / SALES
RETURN ON CAPITAL EMPLOYED NET PROFIT AFTER TAX / CAPITAL
EMPLOYED
⊘ This is a preview!⊘
Do you want full access?
Subscribe today to unlock all pages.
Trusted by 1+ million students worldwide
9FINANCIAL PERFORMANCE ANALYSIS
2017 2016 2015 2014 2013
0.00%
10.00%
20.00%
30.00%
40.00%
50.00%
60.00%
70.00%
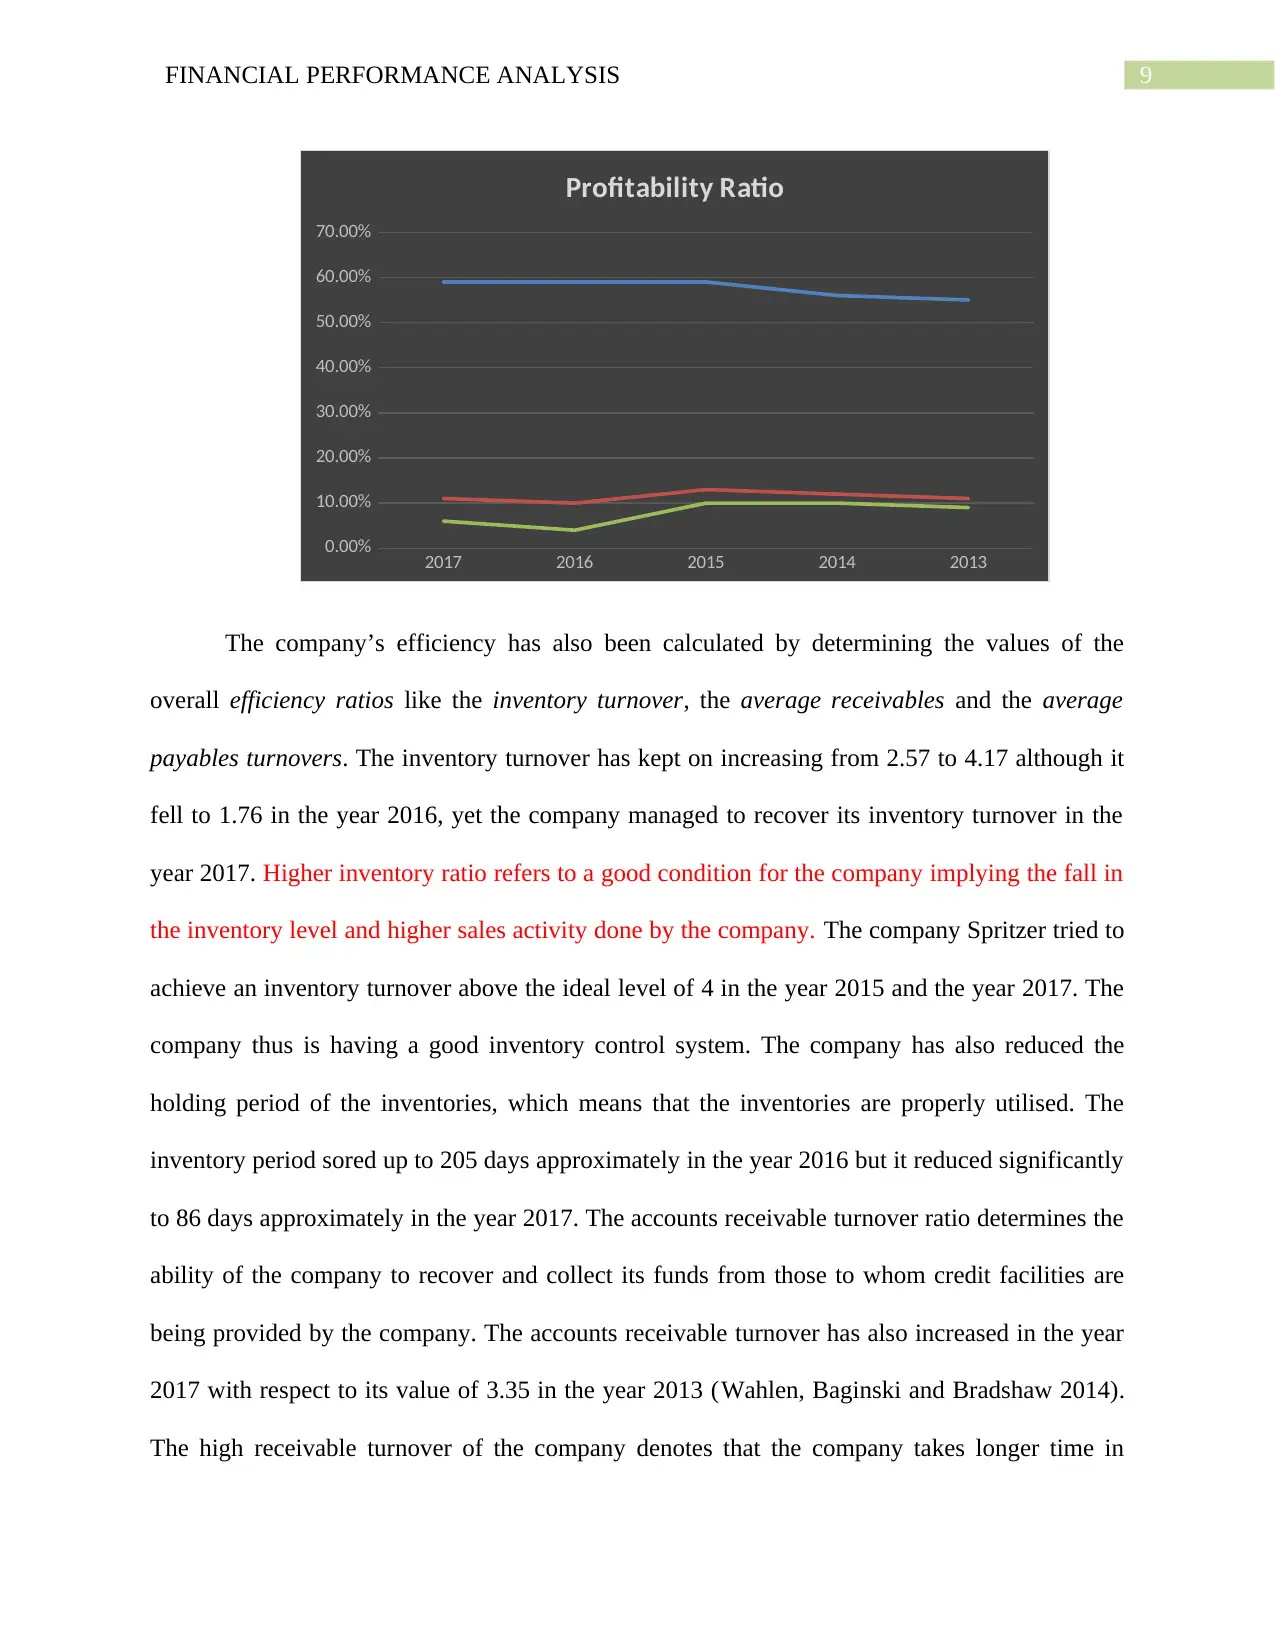
Profitability Ratio
The company’s efficiency has also been calculated by determining the values of the
overall efficiency ratios like the inventory turnover, the average receivables and the average
payables turnovers. The inventory turnover has kept on increasing from 2.57 to 4.17 although it
fell to 1.76 in the year 2016, yet the company managed to recover its inventory turnover in the
year 2017. Higher inventory ratio refers to a good condition for the company implying the fall in
the inventory level and higher sales activity done by the company. The company Spritzer tried to
achieve an inventory turnover above the ideal level of 4 in the year 2015 and the year 2017. The
company thus is having a good inventory control system. The company has also reduced the
holding period of the inventories, which means that the inventories are properly utilised. The
inventory period sored up to 205 days approximately in the year 2016 but it reduced significantly
to 86 days approximately in the year 2017. The accounts receivable turnover ratio determines the
ability of the company to recover and collect its funds from those to whom credit facilities are
being provided by the company. The accounts receivable turnover has also increased in the year
2017 with respect to its value of 3.35 in the year 2013 (Wahlen, Baginski and Bradshaw 2014).
The high receivable turnover of the company denotes that the company takes longer time in
2017 2016 2015 2014 2013
0.00%
10.00%
20.00%
30.00%
40.00%
50.00%
60.00%
70.00%
Profitability Ratio
The company’s efficiency has also been calculated by determining the values of the
overall efficiency ratios like the inventory turnover, the average receivables and the average
payables turnovers. The inventory turnover has kept on increasing from 2.57 to 4.17 although it
fell to 1.76 in the year 2016, yet the company managed to recover its inventory turnover in the
year 2017. Higher inventory ratio refers to a good condition for the company implying the fall in
the inventory level and higher sales activity done by the company. The company Spritzer tried to
achieve an inventory turnover above the ideal level of 4 in the year 2015 and the year 2017. The
company thus is having a good inventory control system. The company has also reduced the
holding period of the inventories, which means that the inventories are properly utilised. The
inventory period sored up to 205 days approximately in the year 2016 but it reduced significantly
to 86 days approximately in the year 2017. The accounts receivable turnover ratio determines the
ability of the company to recover and collect its funds from those to whom credit facilities are
being provided by the company. The accounts receivable turnover has also increased in the year
2017 with respect to its value of 3.35 in the year 2013 (Wahlen, Baginski and Bradshaw 2014).
The high receivable turnover of the company denotes that the company takes longer time in
Paraphrase This Document
Need a fresh take? Get an instant paraphrase of this document with our AI Paraphraser
10FINANCIAL PERFORMANCE ANALYSIS
collecting the receivables. The company takes more than 2 months approximately in minimum to
collect its receivables. However it has been seen that the company faced troubles in the year
2016 and has performed much better in order to improve in the year 2017. The year 2017 shows
that in this year the company has taken the minimum number of days to collect its revenues. The
company has also reduced its average payment period to a large extent. The quick payment of
the payables determines the high liquidity and the efficiency of the company in paying of its
liabilities at a fast pace. The accounts payable ratio measures the number of days that the
company usually takes to pay off its creditors. The average payment period in the year 2013 was
110days and it reduced to 74 days in the year 2017 (Williams and Dobelman 2017).
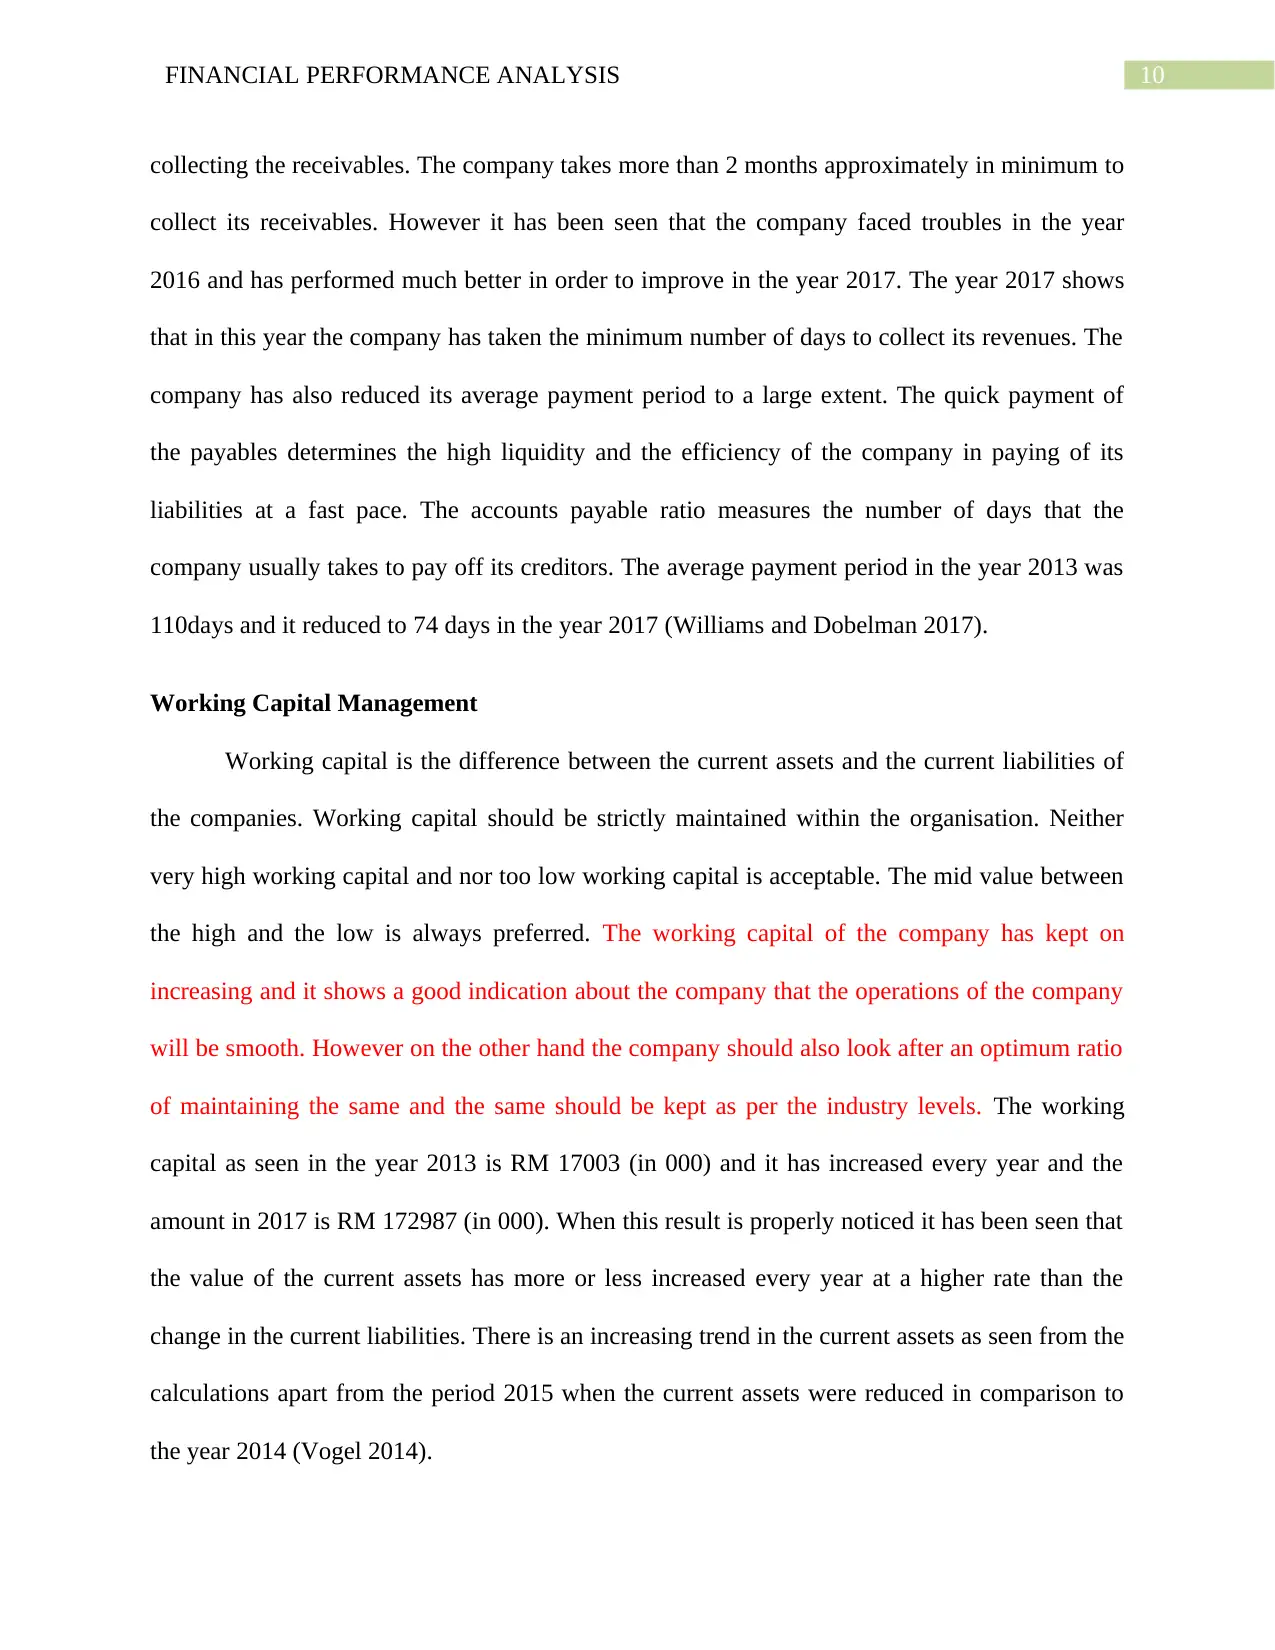
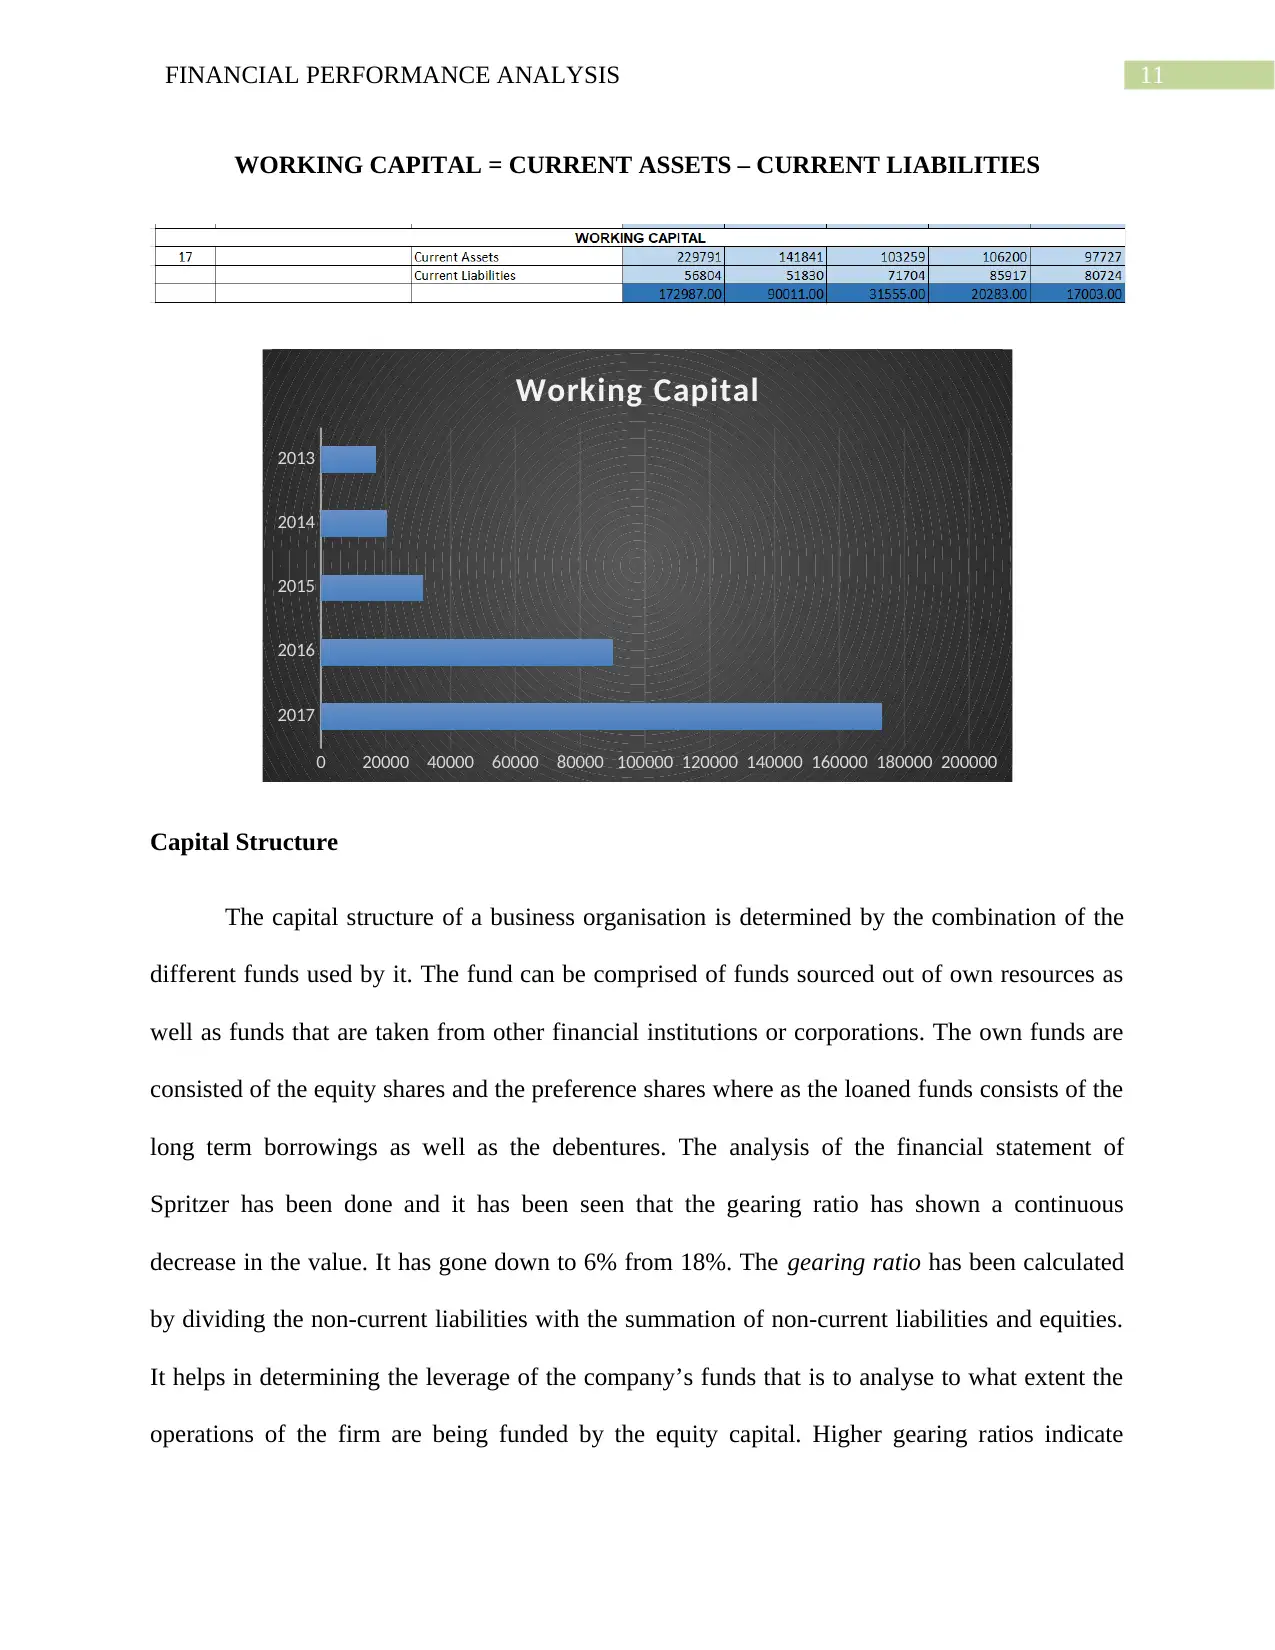
Working Capital Management
Working capital is the difference between the current assets and the current liabilities of
the companies. Working capital should be strictly maintained within the organisation. Neither
very high working capital and nor too low working capital is acceptable. The mid value between
the high and the low is always preferred. The working capital of the company has kept on
increasing and it shows a good indication about the company that the operations of the company
will be smooth. However on the other hand the company should also look after an optimum ratio
of maintaining the same and the same should be kept as per the industry levels. The working
capital as seen in the year 2013 is RM 17003 (in 000) and it has increased every year and the
amount in 2017 is RM 172987 (in 000). When this result is properly noticed it has been seen that
the value of the current assets has more or less increased every year at a higher rate than the
change in the current liabilities. There is an increasing trend in the current assets as seen from the
calculations apart from the period 2015 when the current assets were reduced in comparison to
the year 2014 (Vogel 2014).
collecting the receivables. The company takes more than 2 months approximately in minimum to
collect its receivables. However it has been seen that the company faced troubles in the year
2016 and has performed much better in order to improve in the year 2017. The year 2017 shows
that in this year the company has taken the minimum number of days to collect its revenues. The
company has also reduced its average payment period to a large extent. The quick payment of
the payables determines the high liquidity and the efficiency of the company in paying of its
liabilities at a fast pace. The accounts payable ratio measures the number of days that the
company usually takes to pay off its creditors. The average payment period in the year 2013 was
110days and it reduced to 74 days in the year 2017 (Williams and Dobelman 2017).
Working Capital Management
Working capital is the difference between the current assets and the current liabilities of
the companies. Working capital should be strictly maintained within the organisation. Neither
very high working capital and nor too low working capital is acceptable. The mid value between
the high and the low is always preferred. The working capital of the company has kept on
increasing and it shows a good indication about the company that the operations of the company
will be smooth. However on the other hand the company should also look after an optimum ratio
of maintaining the same and the same should be kept as per the industry levels. The working
capital as seen in the year 2013 is RM 17003 (in 000) and it has increased every year and the
amount in 2017 is RM 172987 (in 000). When this result is properly noticed it has been seen that
the value of the current assets has more or less increased every year at a higher rate than the
change in the current liabilities. There is an increasing trend in the current assets as seen from the
calculations apart from the period 2015 when the current assets were reduced in comparison to
the year 2014 (Vogel 2014).
11FINANCIAL PERFORMANCE ANALYSIS
WORKING CAPITAL = CURRENT ASSETS – CURRENT LIABILITIES
2017
2016
2015
2014
2013
0 20000 40000 60000 80000 100000 120000 140000 160000 180000 200000
Working Capital
Capital Structure
The capital structure of a business organisation is determined by the combination of the
different funds used by it. The fund can be comprised of funds sourced out of own resources as
well as funds that are taken from other financial institutions or corporations. The own funds are
consisted of the equity shares and the preference shares where as the loaned funds consists of the
long term borrowings as well as the debentures. The analysis of the financial statement of
Spritzer has been done and it has been seen that the gearing ratio has shown a continuous
decrease in the value. It has gone down to 6% from 18%. The gearing ratio has been calculated
by dividing the non-current liabilities with the summation of non-current liabilities and equities.
It helps in determining the leverage of the company’s funds that is to analyse to what extent the
operations of the firm are being funded by the equity capital. Higher gearing ratios indicate
⊘ This is a preview!⊘
Do you want full access?
Subscribe today to unlock all pages.
Trusted by 1+ million students worldwide
1 out of 20
Related Documents


Your All-in-One AI-Powered Toolkit for Academic Success.
+13062052269
info@desklib.com
Available 24*7 on WhatsApp / Email
![[object Object]](/_next/static/media/star-bottom.7253800d.svg)
Unlock your academic potential
Copyright © 2020–2026 A2Z Services. All Rights Reserved. Developed and managed by ZUCOL.