ACC10007 Financial Analysis: Super Retail Group Performance
VerifiedAdded on 2023/04/21
|16
|3458
|357
Report
AI Summary
This report presents a comprehensive financial analysis of Super Retail Group, an Australian retailer, utilizing financial statements from 2016 to 2018. The analysis employs financial ratios, including liquidity, solvency, and profitability ratios, to assess the company's performance. Liquidity is evaluated using the current and quick ratios, solvency through gearing ratios, and profitability through net profit margin, return on capital employed, return on equity, and return on total assets. Additionally, the report examines cash flow statements, focusing on operating, investing, and financing activities. The report also includes an assessment of the external environment, considering political, social, economic, and technological factors that may impact the company's performance. The goal is to provide stakeholders with a clear understanding of Super Retail Group's financial health and operational efficiency.
FINANCE
Paraphrase This Document
Need a fresh take? Get an instant paraphrase of this document with our AI Paraphraser
Executive summary
This report carries out a discussion on the super retail group of Australia. This report analyses
and examines the performance of company with the help of financial analysis such as cash
flow analysis and ratio analysis. The company commits to deal in the retailing of outdoor,
sport, and auto leisure products in New Zealand and Australia. Further, the report discusses
the non-financial assessment through external environment affects the company.
Contents
Executive summary...............................................................................................................................1
Introduction...........................................................................................................................................3
Introduction of the company..................................................................................................................3
Introduction of the industry...................................................................................................................3
Analysis of Financial report for three years (2016, 2017, and 2018).....................................................4
Cash flows for three years (2016, 2017, and 2018)................................................................................9
Assessment of non-financial environment...........................................................................................11
Conclusion...........................................................................................................................................12
Appendix.............................................................................................................................................12
Bibliography........................................................................................................................................14
⊘ This is a preview!⊘
Do you want full access?
Subscribe today to unlock all pages.
Trusted by 1+ million students worldwide
Introduction
This report brings out the analysis of Super Retail Group with the help of financial statements
of three recent years 2016, 2017, and 2018. For analysing, this report uses financial ratios and
evaluation of cash flow statements by looking at the three important cash flow operations,
which are operating, investing, and financing activities (Ponikvar, Kejžar, and Peljhan, 2018).
Introduction of the company
Super retail group is among the famous top ten retailers who is listed on ASX (Australian
stock exchange) (SUPER RETAIL GROUP LIMITED SUL, 2018). The company offers
automotive accessories, and parts, tools and equipment for marine, motorbike products,
handyman items that include car care products, embedded car navigation, lighting, filters,
additives, seat covers, footwear, and other performance products. The headquarters of the
company is in Brisbane, its network is being extended to more than 670 retail stores, and
around 12000 team members are engaged across Australia, China, and New Zealand. Apart
from being a largest retailer of Australia, the company includes housing iconic brands such as
boating camping fishing, BCF, rebel, super cheap auto, and Macpac with a generation of $2.5
billion as an annual turnover (SUPER RETAIL GROUP LIMITED SUL, 2018).
Introduction of the industry
The retail sector of Australia is anticipated to be valued at 1010 USD billion by the end of
2024. The retail sector is distributed on the basis of different product categories, market
dynamics, and the distribution channels. As the country is blessed with high per capita GDP
rate which is valued at USD 50000. The retail sector of the country has noticed lower
increase in the wages and increasing household debt. Strong growth supported by low interest
rates, housing market, and increase in household credit has affected the customer-spending
pattern. Some of the major companies that drive retail industry includes Aldi group,
Paraphrase This Document
Need a fresh take? Get an instant paraphrase of this document with our AI Paraphraser
Woolworth Group ltd., Wesfarmers, Big W, JB Hi-Fi ltd, Myer group ltd, and Kmart
Australia and Kogan ltd (SUPER RETAIL GROUP LIMITED SUL, 2018).
Analysis of Financial report for three years (2016, 2017, and 2018)
Financial ratio is a tool used by the manager to evaluate the company`s performance in order
to reflect it to its stakeholders. Here, the calculation has the comparison of three years that is
2016, 2017, and 2018 (Vats, and Patel, 2017).
Liquidity ratios
It refers to the metrics which is used by the company to use it in order to determine the
debtor`s ability to pay off its current liabilities. This payment obligation does not include debt
obligations that are raised in the name of huge external capital. A high liquidity ratio means
that company is liquid enough and is in better conditions top pay off the outstanding debts.
Here, to calculate the liquidity, the analysis has used current ratio and quick ratio.
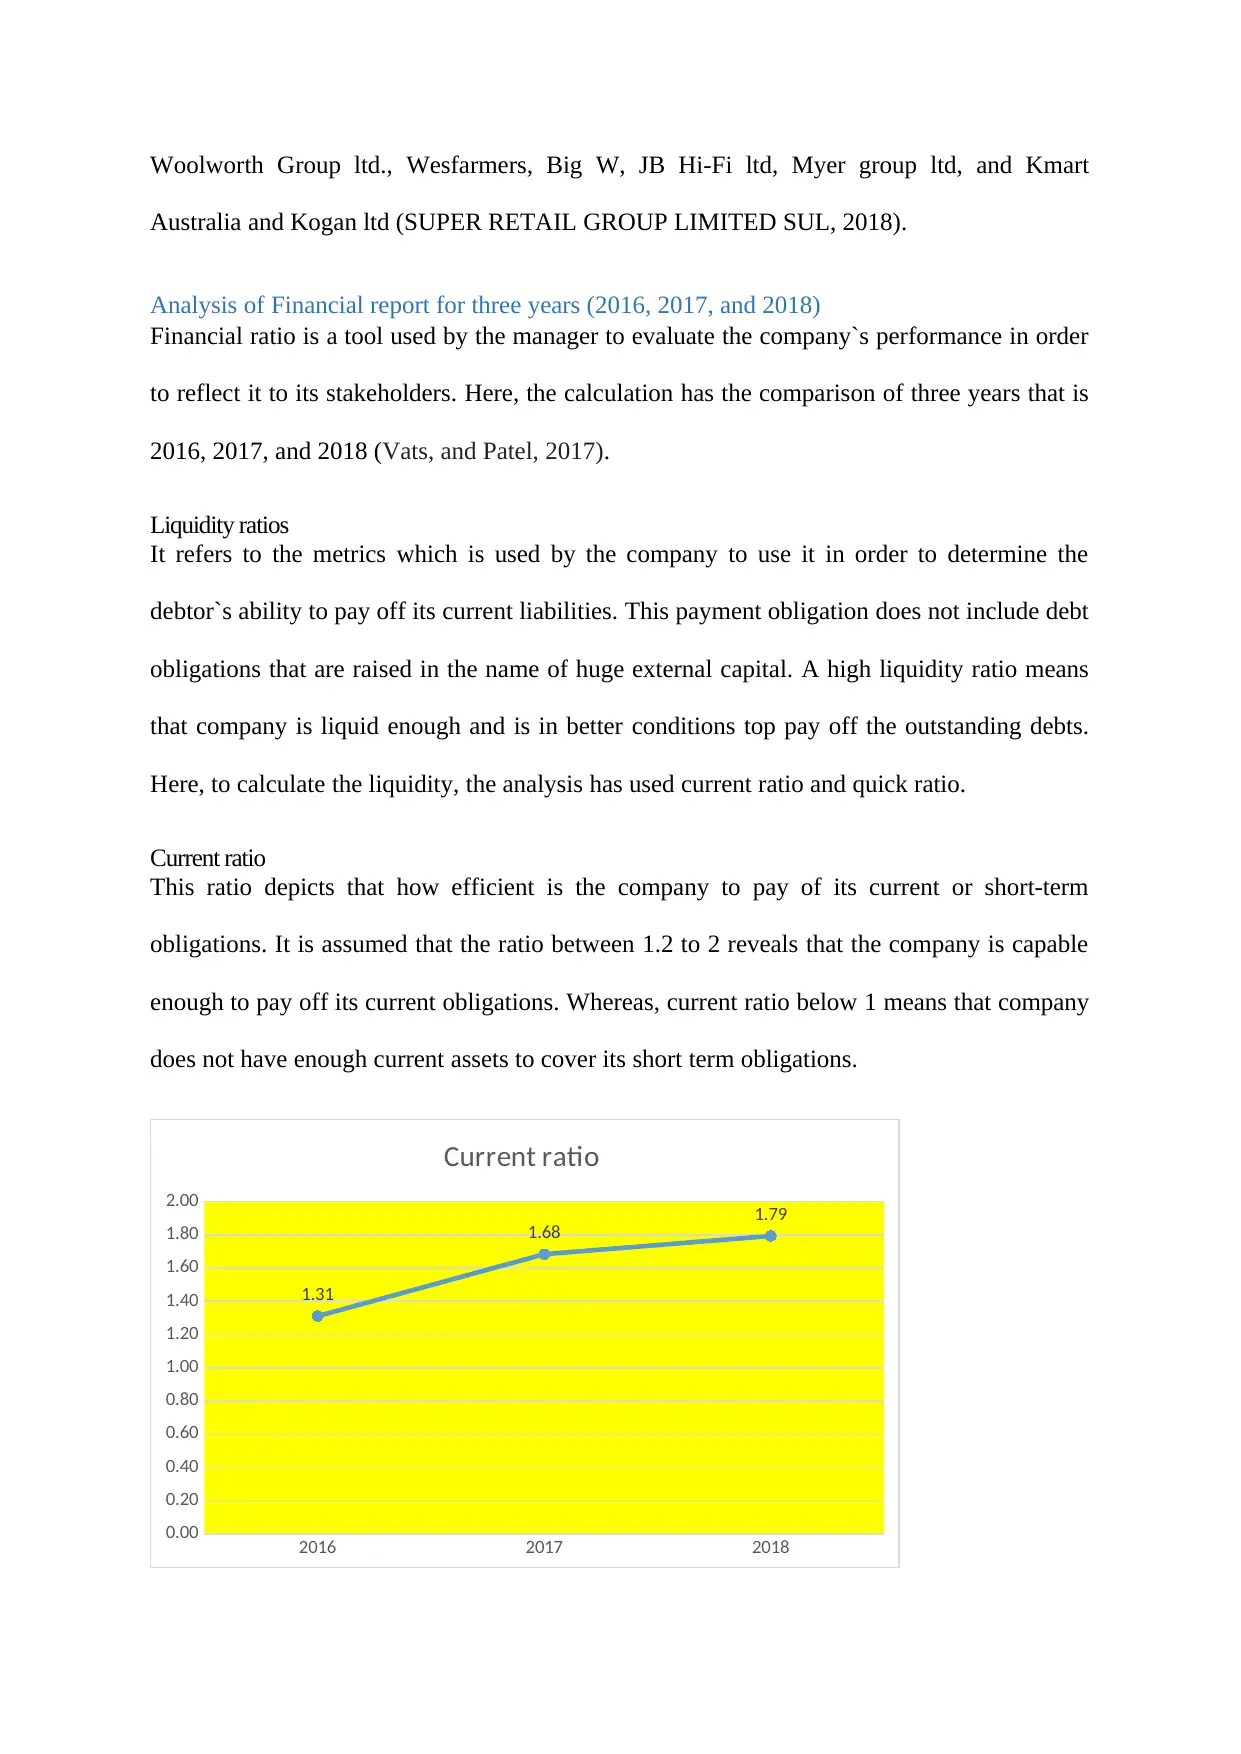
Current ratio
This ratio depicts that how efficient is the company to pay of its current or short-term
obligations. It is assumed that the ratio between 1.2 to 2 reveals that the company is capable
enough to pay off its current obligations. Whereas, current ratio below 1 means that company
does not have enough current assets to cover its short term obligations.
2016 2017 2018
0.00
0.20
0.40
0.60
0.80
1.00
1.20
1.40
1.60
1.80
2.00
1.31
1.68 1.79
Current ratio
Australia and Kogan ltd (SUPER RETAIL GROUP LIMITED SUL, 2018).
Analysis of Financial report for three years (2016, 2017, and 2018)
Financial ratio is a tool used by the manager to evaluate the company`s performance in order
to reflect it to its stakeholders. Here, the calculation has the comparison of three years that is
2016, 2017, and 2018 (Vats, and Patel, 2017).
Liquidity ratios
It refers to the metrics which is used by the company to use it in order to determine the
debtor`s ability to pay off its current liabilities. This payment obligation does not include debt
obligations that are raised in the name of huge external capital. A high liquidity ratio means
that company is liquid enough and is in better conditions top pay off the outstanding debts.
Here, to calculate the liquidity, the analysis has used current ratio and quick ratio.
Current ratio
This ratio depicts that how efficient is the company to pay of its current or short-term
obligations. It is assumed that the ratio between 1.2 to 2 reveals that the company is capable
enough to pay off its current obligations. Whereas, current ratio below 1 means that company
does not have enough current assets to cover its short term obligations.
2016 2017 2018
0.00
0.20
0.40
0.60
0.80
1.00
1.20
1.40
1.60
1.80
2.00
1.31
1.68 1.79
Current ratio
(Source: by author)
The above graph indicates that the company has enough funds generated from the current
assets to pay off its current obligations. The graph indicates that for all the three years, the
ratio is between 1.2 to 2. For 2016, the company has a current ratio of 1.31, for 2017, the
company has current ratio of 1.68, and finally it reached to near standard of 2:1 in 2018. This
means the company kept increasing its ability to pay off its obligations (Wood, 2016).
Solvency ratios
Solvency Ratio
Capital structure ratio 2016 2017 2018
gearing ratio* (as suggested) 35.70 -47.26 44.20
This ratio is similar while calculating the risk such as it includes company`s total capital
(non-current liabilities + equity). As every ratio, it also has ideal ratio. It indicates a ratio
between 35 to 50 %, and a higher leverage depicts high risk. More leverage increases the
interest obligations that further reduces EPS. Form the above table it is seen that each year,
the company has efficiently engaged debt and to a considerable level that do not hampers the
dividend of the shareholders. In 2016, the company maintained 35 percent of gearing ratio
and in 2018, gearing ratio increased that means the company has employed more debt. In
2017, the company lended long-term loan as the table indicates that -47 percent (Thornblad,
Zeitzmann, and Carlson, 2018).
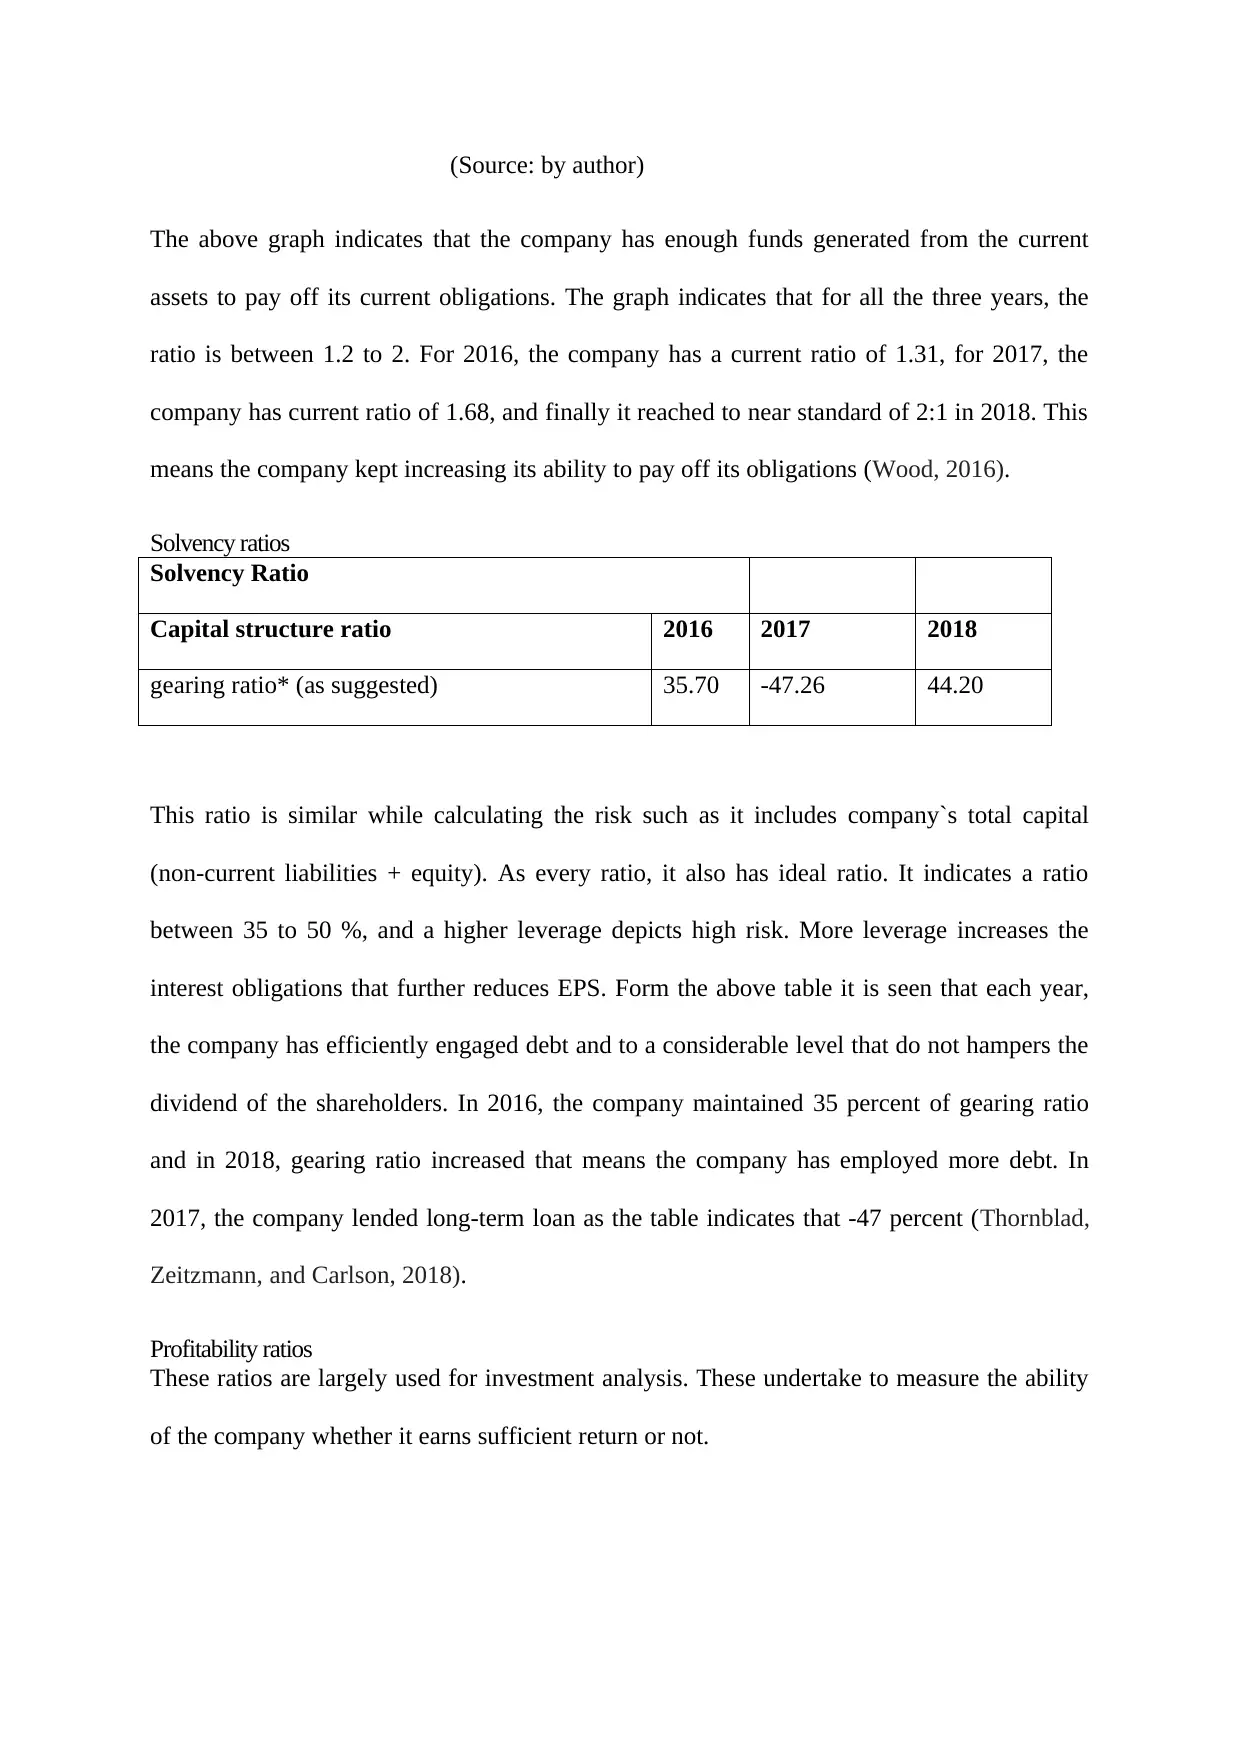
Profitability ratios
These ratios are largely used for investment analysis. These undertake to measure the ability
of the company whether it earns sufficient return or not.
The above graph indicates that the company has enough funds generated from the current
assets to pay off its current obligations. The graph indicates that for all the three years, the
ratio is between 1.2 to 2. For 2016, the company has a current ratio of 1.31, for 2017, the
company has current ratio of 1.68, and finally it reached to near standard of 2:1 in 2018. This
means the company kept increasing its ability to pay off its obligations (Wood, 2016).
Solvency ratios
Solvency Ratio
Capital structure ratio 2016 2017 2018
gearing ratio* (as suggested) 35.70 -47.26 44.20
This ratio is similar while calculating the risk such as it includes company`s total capital
(non-current liabilities + equity). As every ratio, it also has ideal ratio. It indicates a ratio
between 35 to 50 %, and a higher leverage depicts high risk. More leverage increases the
interest obligations that further reduces EPS. Form the above table it is seen that each year,
the company has efficiently engaged debt and to a considerable level that do not hampers the
dividend of the shareholders. In 2016, the company maintained 35 percent of gearing ratio
and in 2018, gearing ratio increased that means the company has employed more debt. In
2017, the company lended long-term loan as the table indicates that -47 percent (Thornblad,
Zeitzmann, and Carlson, 2018).
Profitability ratios
These ratios are largely used for investment analysis. These undertake to measure the ability
of the company whether it earns sufficient return or not.
⊘ This is a preview!⊘
Do you want full access?
Subscribe today to unlock all pages.
Trusted by 1+ million students worldwide
2016 2017 2018
2%
4%
5%
Net profit margin
(Source: by author)
From the above graph, it can be interpreted that the net profit margin has shown an increase
in 2017 and 2018 as compared to 2016. The reasons for such increase is clear such as
increase in total sales has increased the profit too or the company has managed to reduce its
indirect expenses. As an analysis, the company is performing very well as 2%, 4% and 5%
are very less according to the industry. It should at least maintain 10-20 percent of net profit
margin. In order to improve, the company should increase its revenue and control its
expenses (Kowalik, 2018).
Paraphrase This Document
Need a fresh take? Get an instant paraphrase of this document with our AI Paraphraser
2016 2017 2018
0%
5%
10%
15%
20%
25%
30%
Return on Capital Employed
(Source: by author)
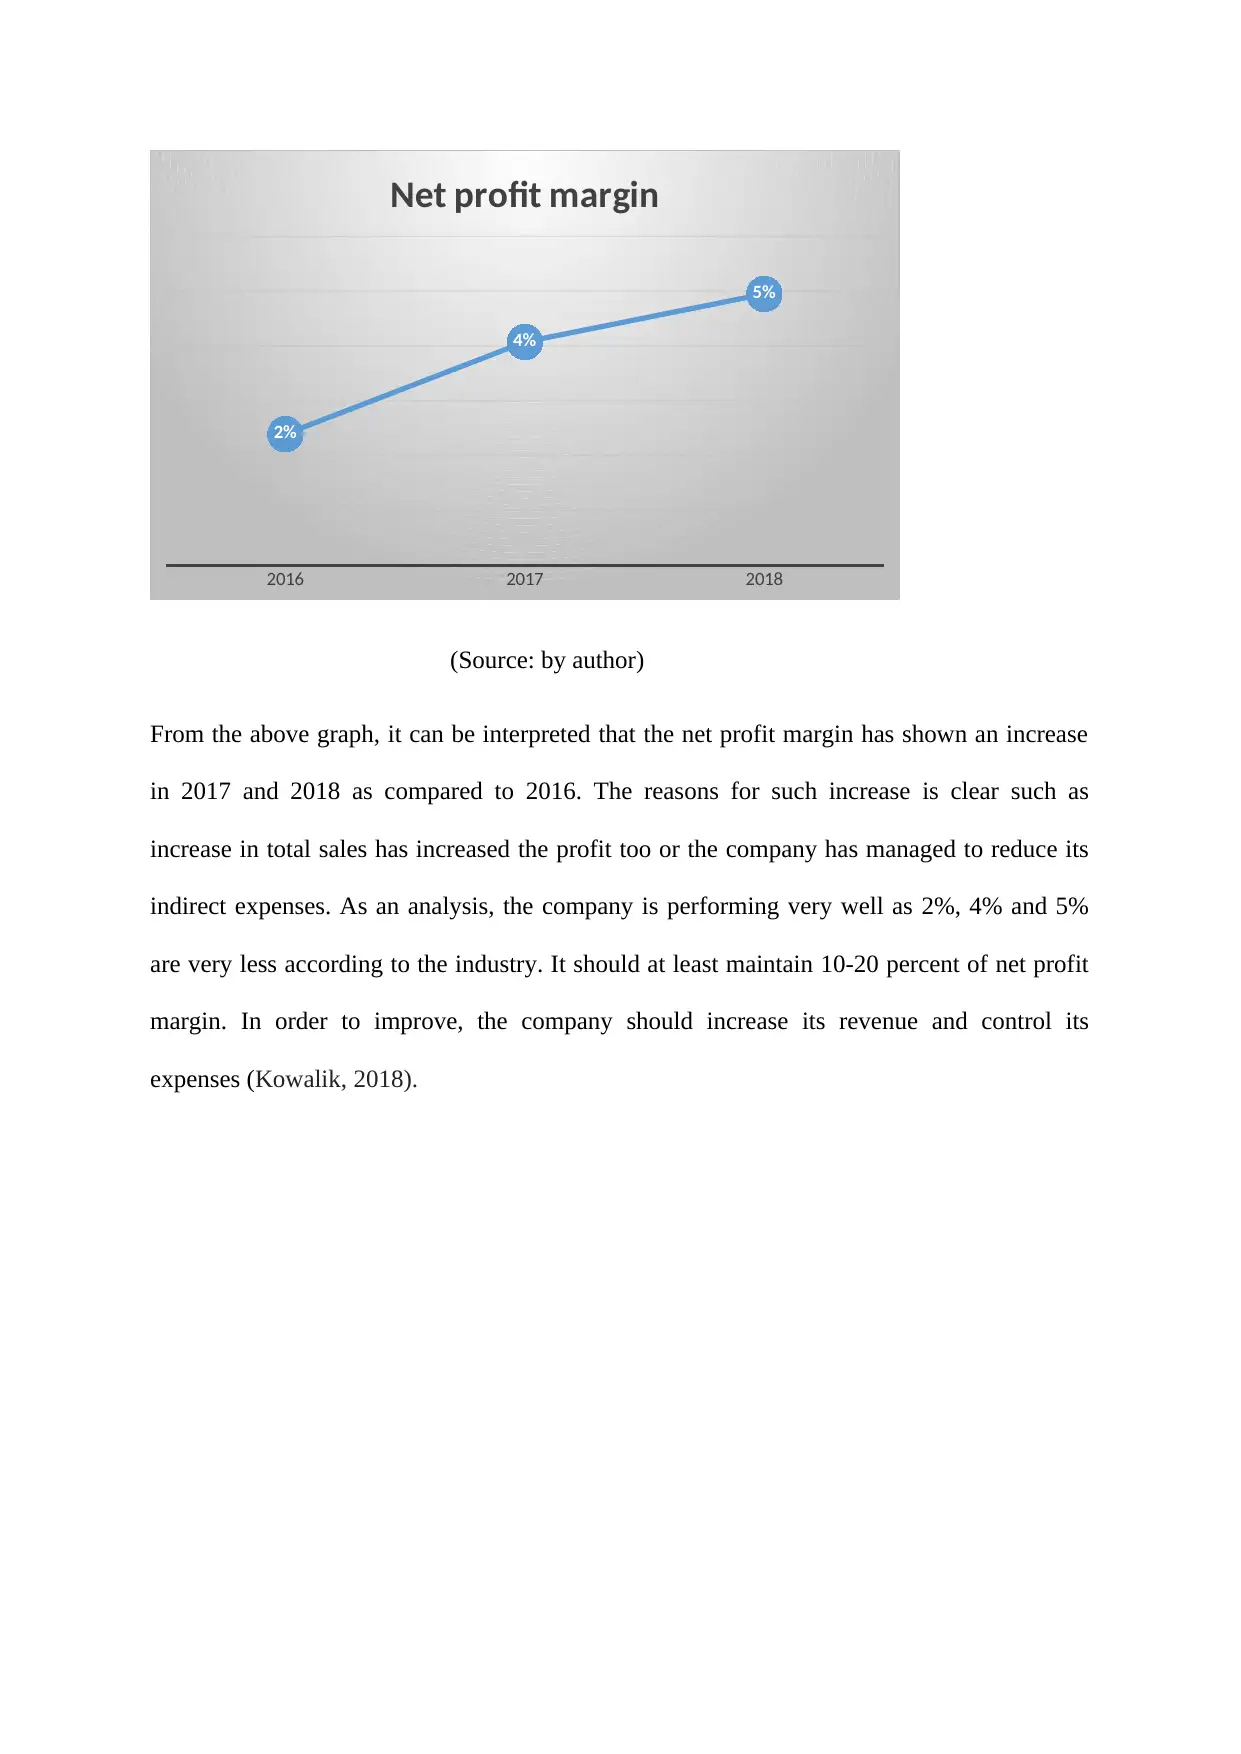
Return on capital employed measures the returns that is achieved by the business by
employing the capital. It should always be of higher percentage as compared to the rate at
which it borrows or else any increase in borrowing will lead to reduction in shareholder`s
earning. A feasible rate is the one that is greater than the rate at which the company borrows.
From the above graph, it can be said that the company gives a considerable return on the
capital employed which was nearly 15 percent but it reduced in 2017, as it was only 11
percent that indicates that the rate of borrowing of increased as seen in the cash flow. The
company has increased its long-term borrowing that resulted into decrease in return on capital
employed. Whereas, in 2018 the company maintained its return with 24 percent (SUPER
RETAIL GROUP, 2017).
0%
5%
10%
15%
20%
25%
30%
Return on Capital Employed
(Source: by author)
Return on capital employed measures the returns that is achieved by the business by
employing the capital. It should always be of higher percentage as compared to the rate at
which it borrows or else any increase in borrowing will lead to reduction in shareholder`s
earning. A feasible rate is the one that is greater than the rate at which the company borrows.
From the above graph, it can be said that the company gives a considerable return on the
capital employed which was nearly 15 percent but it reduced in 2017, as it was only 11
percent that indicates that the rate of borrowing of increased as seen in the cash flow. The
company has increased its long-term borrowing that resulted into decrease in return on capital
employed. Whereas, in 2018 the company maintained its return with 24 percent (SUPER
RETAIL GROUP, 2017).
2016 2017 2018
0%
2%
4%
6%
8%
10%
12%
14%
16%
18%
Return on Equity
(Source: by author)
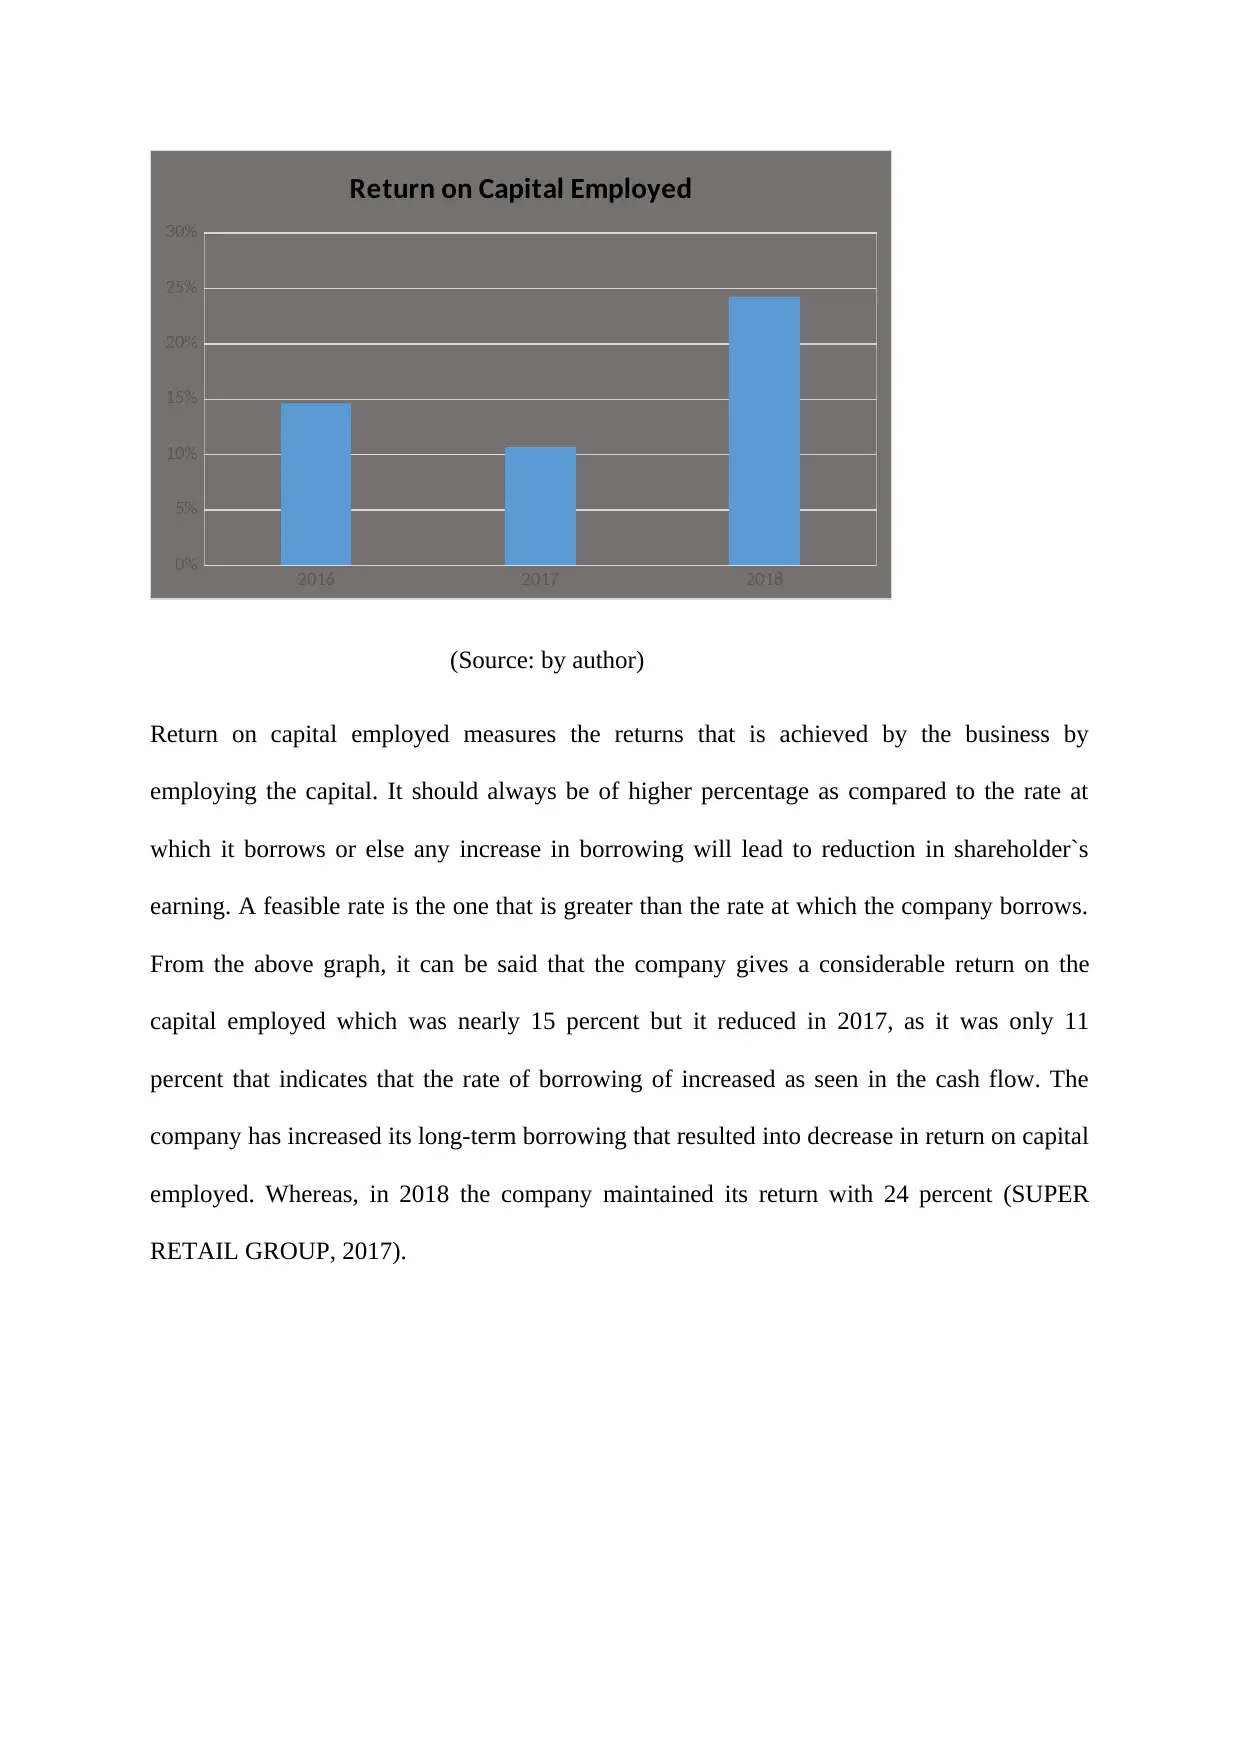
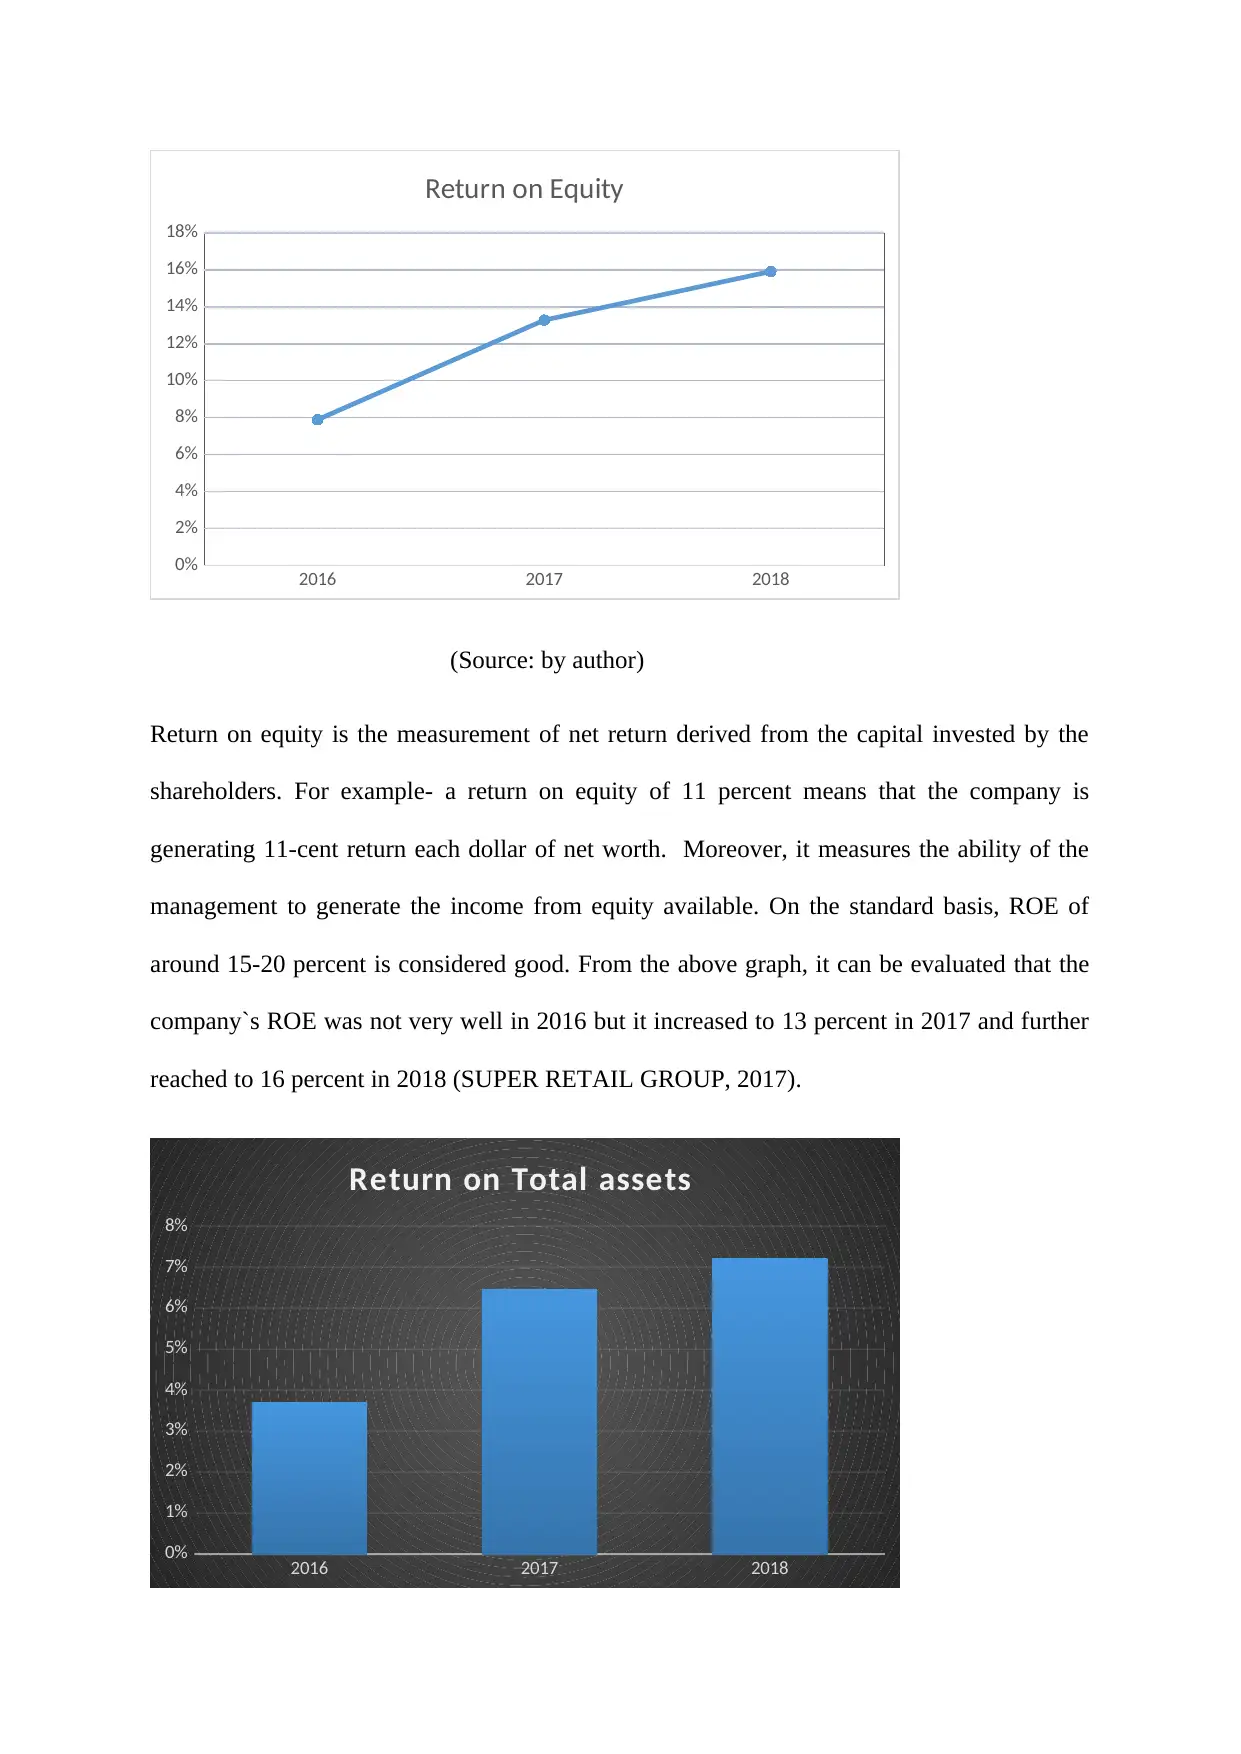
Return on equity is the measurement of net return derived from the capital invested by the
shareholders. For example- a return on equity of 11 percent means that the company is
generating 11-cent return each dollar of net worth. Moreover, it measures the ability of the
management to generate the income from equity available. On the standard basis, ROE of
around 15-20 percent is considered good. From the above graph, it can be evaluated that the
company`s ROE was not very well in 2016 but it increased to 13 percent in 2017 and further
reached to 16 percent in 2018 (SUPER RETAIL GROUP, 2017).
2016 2017 2018
0%
1%
2%
3%
4%
5%
6%
7%
8%
Return on Total assets
0%
2%
4%
6%
8%
10%
12%
14%
16%
18%
Return on Equity
(Source: by author)
Return on equity is the measurement of net return derived from the capital invested by the
shareholders. For example- a return on equity of 11 percent means that the company is
generating 11-cent return each dollar of net worth. Moreover, it measures the ability of the
management to generate the income from equity available. On the standard basis, ROE of
around 15-20 percent is considered good. From the above graph, it can be evaluated that the
company`s ROE was not very well in 2016 but it increased to 13 percent in 2017 and further
reached to 16 percent in 2018 (SUPER RETAIL GROUP, 2017).
2016 2017 2018
0%
1%
2%
3%
4%
5%
6%
7%
8%
Return on Total assets
⊘ This is a preview!⊘
Do you want full access?
Subscribe today to unlock all pages.
Trusted by 1+ million students worldwide
(Source: by author)
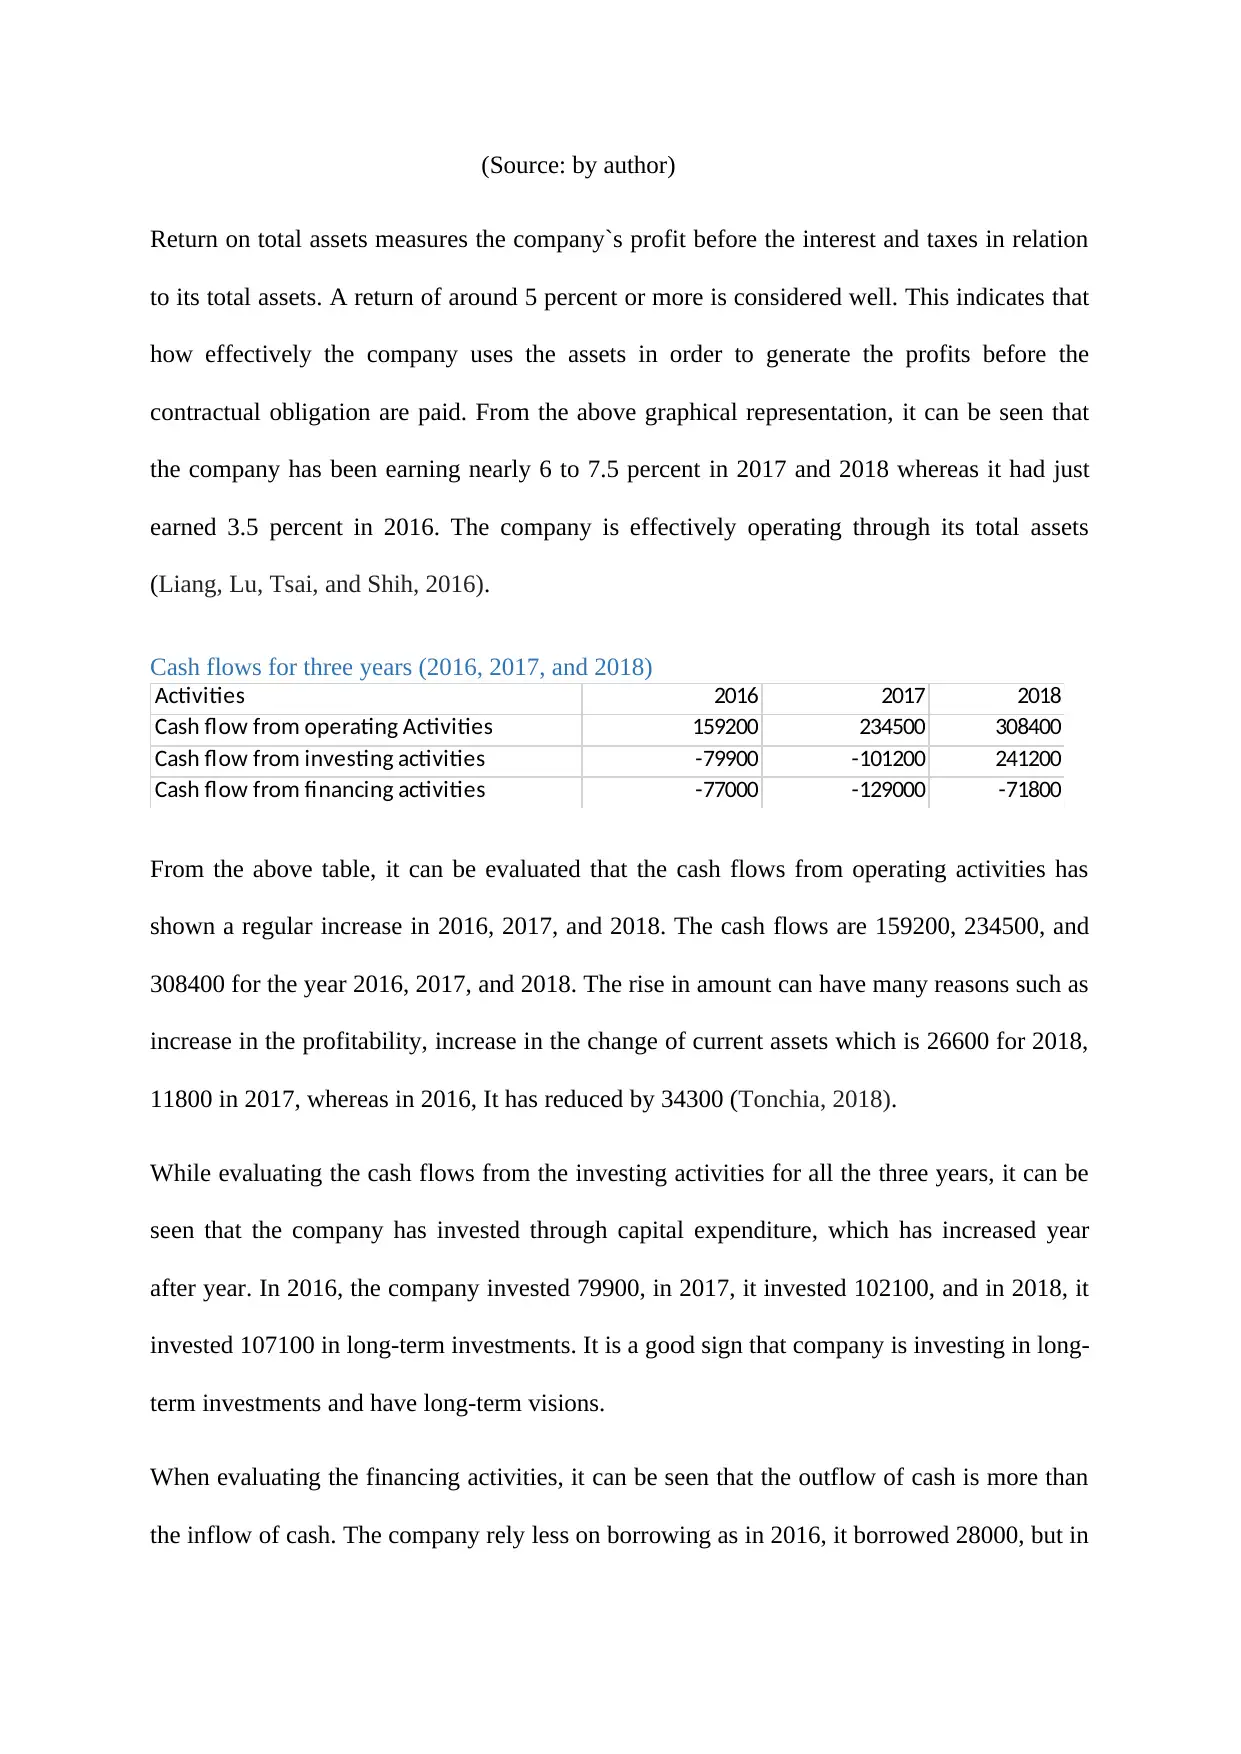
Return on total assets measures the company`s profit before the interest and taxes in relation
to its total assets. A return of around 5 percent or more is considered well. This indicates that
how effectively the company uses the assets in order to generate the profits before the
contractual obligation are paid. From the above graphical representation, it can be seen that
the company has been earning nearly 6 to 7.5 percent in 2017 and 2018 whereas it had just
earned 3.5 percent in 2016. The company is effectively operating through its total assets
(Liang, Lu, Tsai, and Shih, 2016).
Cash flows for three years (2016, 2017, and 2018)
Activities 2016 2017 2018
Cash flow from operating Activities 159200 234500 308400
Cash flow from investing activities -79900 -101200 241200
Cash flow from financing activities -77000 -129000 -71800
From the above table, it can be evaluated that the cash flows from operating activities has
shown a regular increase in 2016, 2017, and 2018. The cash flows are 159200, 234500, and
308400 for the year 2016, 2017, and 2018. The rise in amount can have many reasons such as
increase in the profitability, increase in the change of current assets which is 26600 for 2018,
11800 in 2017, whereas in 2016, It has reduced by 34300 (Tonchia, 2018).
While evaluating the cash flows from the investing activities for all the three years, it can be
seen that the company has invested through capital expenditure, which has increased year
after year. In 2016, the company invested 79900, in 2017, it invested 102100, and in 2018, it
invested 107100 in long-term investments. It is a good sign that company is investing in long-
term investments and have long-term visions.
When evaluating the financing activities, it can be seen that the outflow of cash is more than
the inflow of cash. The company rely less on borrowing as in 2016, it borrowed 28000, but in
Paraphrase This Document
Need a fresh take? Get an instant paraphrase of this document with our AI Paraphraser
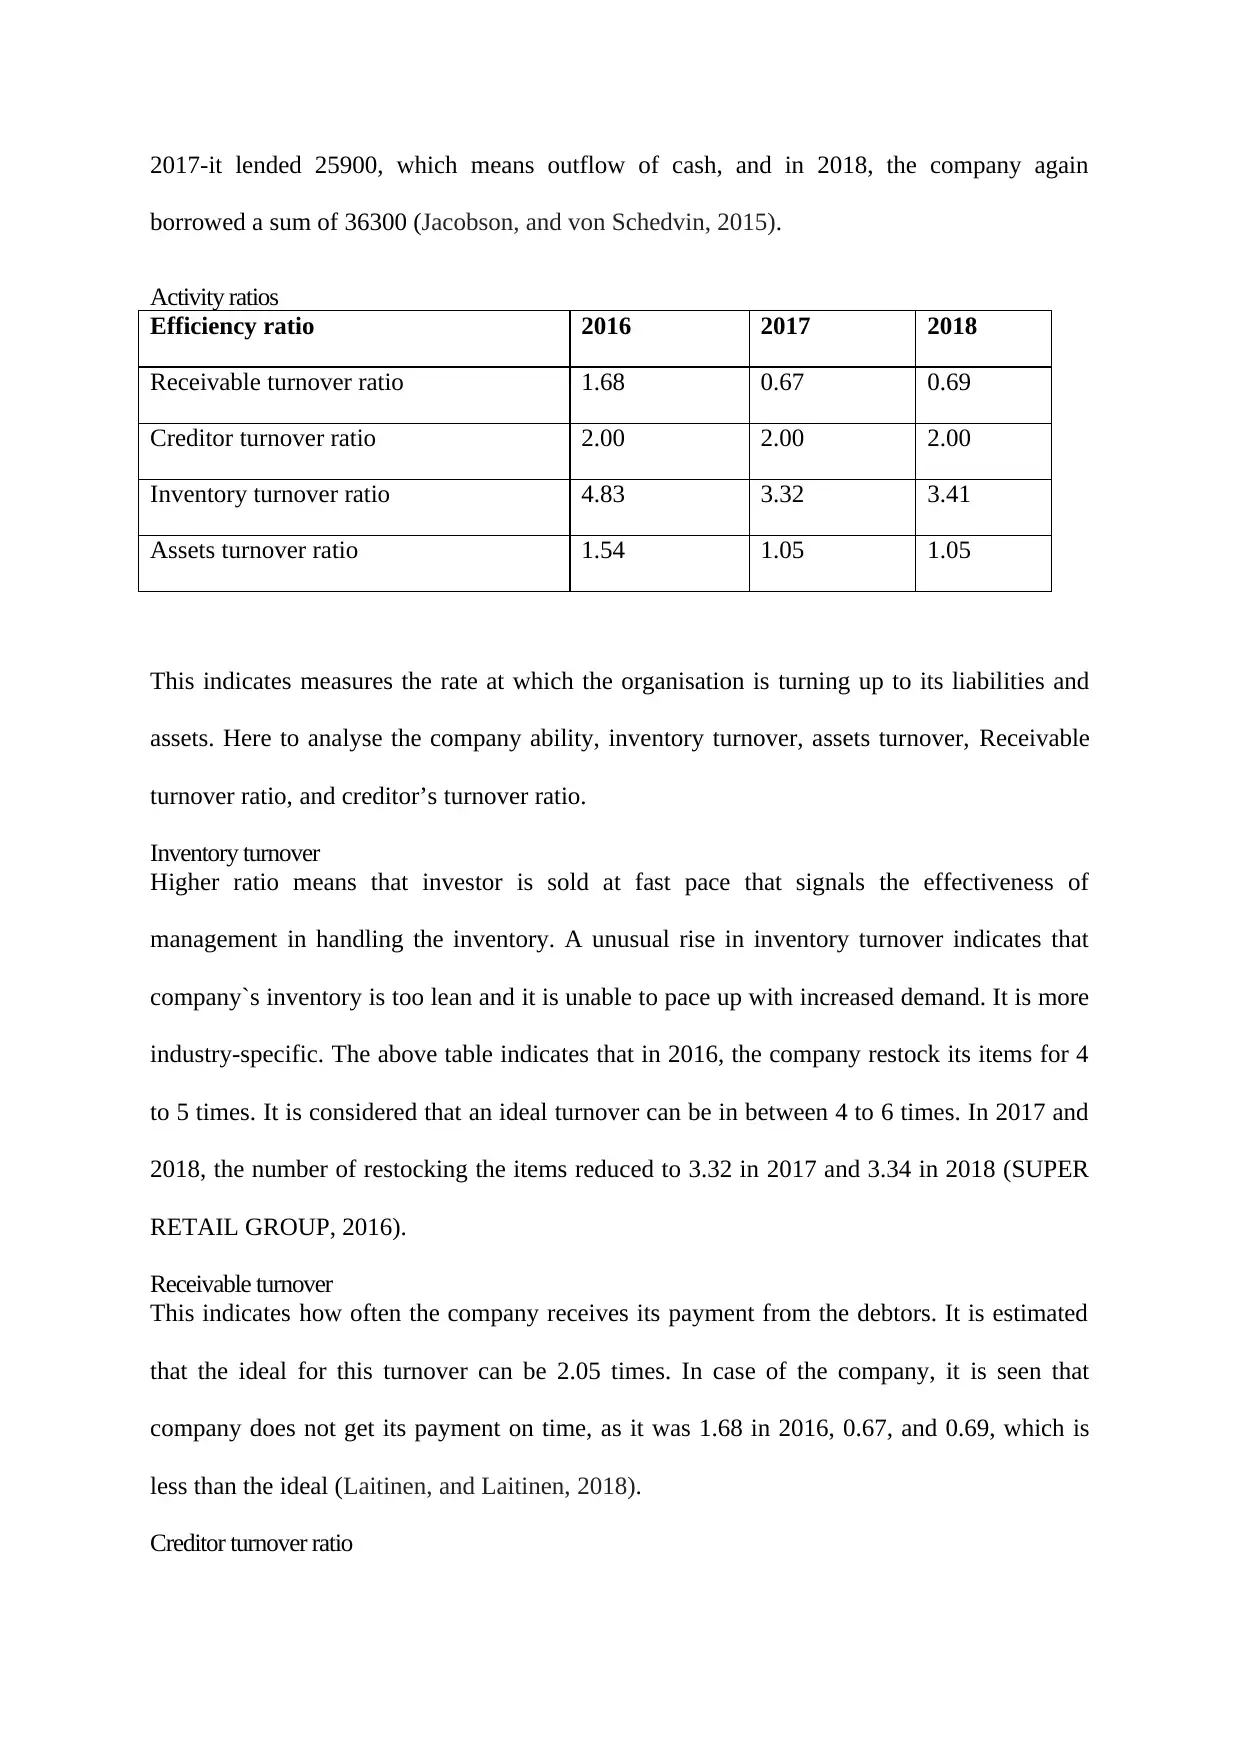
2017-it lended 25900, which means outflow of cash, and in 2018, the company again
borrowed a sum of 36300 (Jacobson, and von Schedvin, 2015).
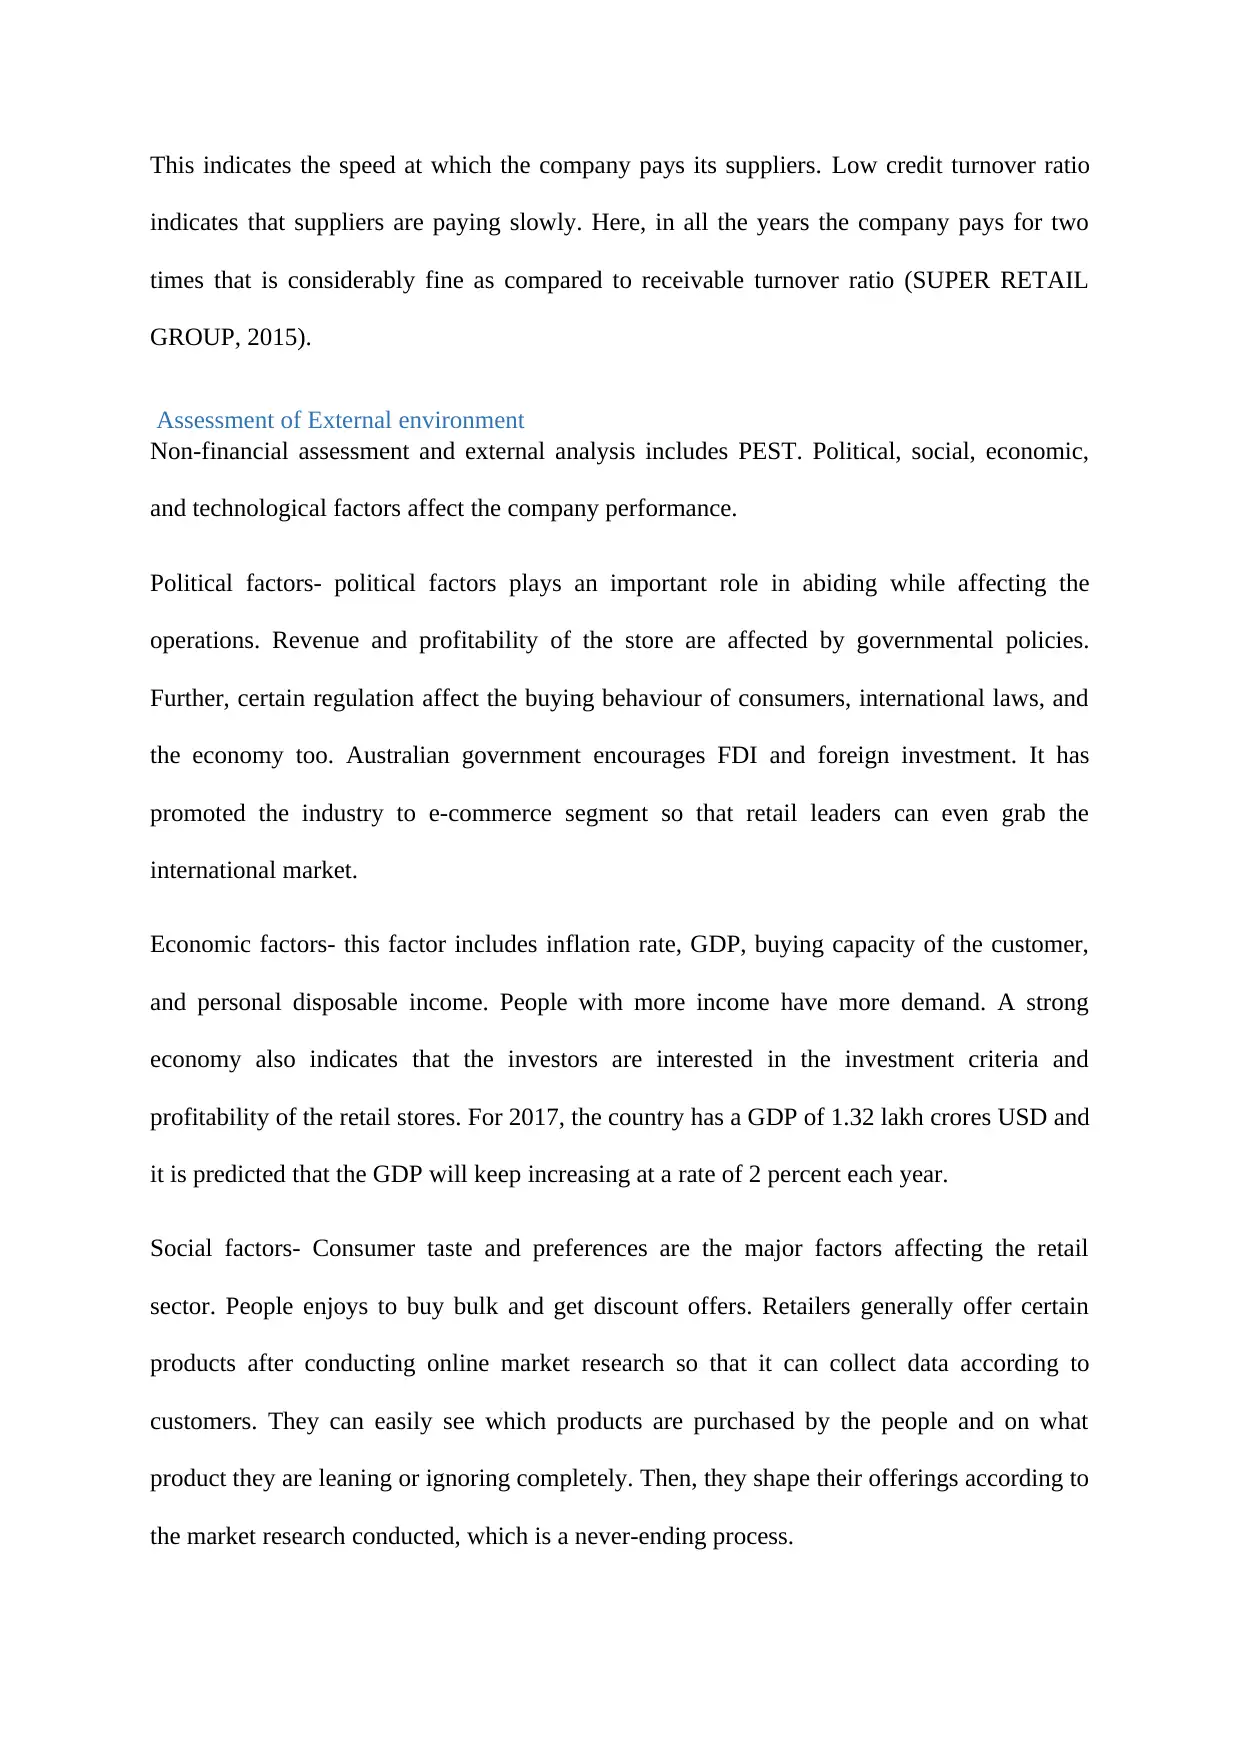
Activity ratios
Efficiency ratio 2016 2017 2018
Receivable turnover ratio 1.68 0.67 0.69
Creditor turnover ratio 2.00 2.00 2.00
Inventory turnover ratio 4.83 3.32 3.41
Assets turnover ratio 1.54 1.05 1.05
This indicates measures the rate at which the organisation is turning up to its liabilities and
assets. Here to analyse the company ability, inventory turnover, assets turnover, Receivable
turnover ratio, and creditor’s turnover ratio.
Inventory turnover
Higher ratio means that investor is sold at fast pace that signals the effectiveness of
management in handling the inventory. A unusual rise in inventory turnover indicates that
company`s inventory is too lean and it is unable to pace up with increased demand. It is more
industry-specific. The above table indicates that in 2016, the company restock its items for 4
to 5 times. It is considered that an ideal turnover can be in between 4 to 6 times. In 2017 and
2018, the number of restocking the items reduced to 3.32 in 2017 and 3.34 in 2018 (SUPER
RETAIL GROUP, 2016).
Receivable turnover
This indicates how often the company receives its payment from the debtors. It is estimated
that the ideal for this turnover can be 2.05 times. In case of the company, it is seen that
company does not get its payment on time, as it was 1.68 in 2016, 0.67, and 0.69, which is
less than the ideal (Laitinen, and Laitinen, 2018).
Creditor turnover ratio
borrowed a sum of 36300 (Jacobson, and von Schedvin, 2015).
Activity ratios
Efficiency ratio 2016 2017 2018
Receivable turnover ratio 1.68 0.67 0.69
Creditor turnover ratio 2.00 2.00 2.00
Inventory turnover ratio 4.83 3.32 3.41
Assets turnover ratio 1.54 1.05 1.05
This indicates measures the rate at which the organisation is turning up to its liabilities and
assets. Here to analyse the company ability, inventory turnover, assets turnover, Receivable
turnover ratio, and creditor’s turnover ratio.
Inventory turnover
Higher ratio means that investor is sold at fast pace that signals the effectiveness of
management in handling the inventory. A unusual rise in inventory turnover indicates that
company`s inventory is too lean and it is unable to pace up with increased demand. It is more
industry-specific. The above table indicates that in 2016, the company restock its items for 4
to 5 times. It is considered that an ideal turnover can be in between 4 to 6 times. In 2017 and
2018, the number of restocking the items reduced to 3.32 in 2017 and 3.34 in 2018 (SUPER
RETAIL GROUP, 2016).
Receivable turnover
This indicates how often the company receives its payment from the debtors. It is estimated
that the ideal for this turnover can be 2.05 times. In case of the company, it is seen that
company does not get its payment on time, as it was 1.68 in 2016, 0.67, and 0.69, which is
less than the ideal (Laitinen, and Laitinen, 2018).
Creditor turnover ratio
This indicates the speed at which the company pays its suppliers. Low credit turnover ratio
indicates that suppliers are paying slowly. Here, in all the years the company pays for two
times that is considerably fine as compared to receivable turnover ratio (SUPER RETAIL
GROUP, 2015).
Assessment of External environment
Non-financial assessment and external analysis includes PEST. Political, social, economic,
and technological factors affect the company performance.
Political factors- political factors plays an important role in abiding while affecting the
operations. Revenue and profitability of the store are affected by governmental policies.
Further, certain regulation affect the buying behaviour of consumers, international laws, and
the economy too. Australian government encourages FDI and foreign investment. It has
promoted the industry to e-commerce segment so that retail leaders can even grab the
international market.
Economic factors- this factor includes inflation rate, GDP, buying capacity of the customer,
and personal disposable income. People with more income have more demand. A strong
economy also indicates that the investors are interested in the investment criteria and
profitability of the retail stores. For 2017, the country has a GDP of 1.32 lakh crores USD and
it is predicted that the GDP will keep increasing at a rate of 2 percent each year.
Social factors- Consumer taste and preferences are the major factors affecting the retail
sector. People enjoys to buy bulk and get discount offers. Retailers generally offer certain
products after conducting online market research so that it can collect data according to
customers. They can easily see which products are purchased by the people and on what
product they are leaning or ignoring completely. Then, they shape their offerings according to
the market research conducted, which is a never-ending process.
⊘ This is a preview!⊘
Do you want full access?
Subscribe today to unlock all pages.
Trusted by 1+ million students worldwide
1 out of 16
Related Documents


Your All-in-One AI-Powered Toolkit for Academic Success.
+13062052269
info@desklib.com
Available 24*7 on WhatsApp / Email
![[object Object]](/_next/static/media/star-bottom.7253800d.svg)
Unlock your academic potential
Copyright © 2020–2026 A2Z Services. All Rights Reserved. Developed and managed by ZUCOL.