Financial Account Management Report: Tesco's Performance Analysis
VerifiedAdded on 2020/01/28
|16
|5301
|423
Report
AI Summary
This report provides a comprehensive analysis of Tesco's financial performance, focusing on the application of financial account management principles. It begins with an overview of Tesco, detailing its background and the rationale for its selection, followed by an examination of key announcements and events impacting the company. The core of the report involves a detailed assessment of Tesco's financial health, including the calculation and analysis of various financial ratios such as current ratio, quick ratio, asset turnover ratio, and inventory turnover ratio, to evaluate liquidity, operational performance, and risk expectations. The report highlights the fluctuations in Tesco's financial figures, comparing the years 2015 and 2016, and provides insights into the company's strengths and weaknesses. The report concludes with recommendations for prospective investors, based on the financial analysis, and includes references and an appendix for further details.

Financial
Account
Management
Account
Management
Paraphrase This Document
Need a fresh take? Get an instant paraphrase of this document with our AI Paraphraser
TABLE OF CONTENTS
INTRODUCTION...........................................................................................................................3
PART A: OVERVIEW...................................................................................................................3
Background to the company & why reason for which it was selected........................................3
Identification of key announcements or events...........................................................................4
PART B: FINANCIAL HEALTH...................................................................................................6
Computing and analyzing key financial ratios for the company.................................................6
PART C..........................................................................................................................................12
Financial strengths and weaknesses...........................................................................................12
Conclusion and recommendations.............................................................................................13
REFERENCES..............................................................................................................................15
APPENDIX....................................................................................................................................16
INTRODUCTION
Financial accounting management refers to the process of effective and efficient
management of funds for the purpose of meeting organizational objectives (Brigham and
Ehrhardt, 2013). This aspect is applied for managing long as well as short term resources for the
successful operations of business. Present report is based on Tesco which is a British
multinational grocery and general merchandise retailer of UK. This corporation is second largest
retailer in the world in accordance with revenue and third largest retailer on the basis of profits.
Furthermore, financial trends of company are identified with rationale of change as result of
internal and external environmental actions. In addition to this, financial ratios of company are
calculated and analyzed in relation to its ability to meet the financial ambitions. Moreover,
recommendations have also been provided to prospective investors for business by focusing
upon its strengths and weaknesses.
PART A: OVERVIEW
Background to the company & reason for which it was selected
Current report is based on Tesco which is a British multinational grocery retailer. It is the
grocery market leader in UK with having share around 28.4%. This corporation was found in the
year 1919 by Jack Cohen. However, the first store of Tesco opened in 1929 in Burnt Oak, Barnet
which was expanded rapidly. During 1990s, Tesco diversified itself into several areas such as
retailing, furniture, electronics, clothing as well as financial services. Along with that, telecom,
internet services, petrol and software are also included. This organization is listed on London
Stock Exchange and had market capitalization of £18.1 billion on 22nd April 2015. Tesco
introduced loyalty card in 1995 for attracting more buyers and persuading them to take quick
purchase decision. It was considered as the most effective strategy of marketing for retaining
buyers for longer time span.
Furthermore, in 2013, Tesco purchased the restaurant and cafe china Giraffe for £48.6
million and then during 2014, it opened restaurant in some of its stores. However, at present,
corporation is facing issue of declining sales. In the current financial year, shares of Tesco were
the biggest faller in FTSE 100. Here, investors were threatened because of uncertain and
deflationary market where discounting stores are outperforming. Owing to this, company is
cutting prices and also planning to sell off some of its other side businesses. It shows that firm is
⊘ This is a preview!⊘
Do you want full access?
Subscribe today to unlock all pages.
Trusted by 1+ million students worldwide
unable to manage its rate of return due to shifting of customers from one to another brand. For
this purpose, Tesco has been selected as there are variations in its financial performance over
recent years (Financial Times, 2016). Owing to this, Tesco has been selected for the current
report for assessing its financial performance over the last years.
Identification of key announcements or events
According to Chairman, John Allan, year 2015 was challenging for Tesco. However,
company remains extremely positive and confident about the future. Tesco proved to be an
iconic brand and an enormous employer which has huge responsibilities towards customers,
business partners, employees and shareholders as well as suppliers. Tesco is focused towards
corporate governance as it has a solid governance framework which is extremely transparent. In
the last year, company continued with the range of corporate renewal plans that have provided
great success to company. The corporate entity puts customers at the heart of business and makes
decisions based on their needs and wants. Recently, firm has sold its Homeplus business in
Korea which was a difficult decision, but was important for company to reposition finance of the
Group by generating £3.3bn of funds (Annual Report and Financial Statements, 2016). This
decision taken by company strengthened its balance sheet. decision taken for replacing the UK
defined benefit pension scheme with a contribution scheme that was seen as the most important
step which is taken by company to be competitive and sustainable for business partners in the
long run. Tesco got its images back as an investment grade and paying dividends. Main focus of
company is on achieving business goals for the long-term success. Corporate entity is reknowned
for stable pricing, improving services etc. It has simplified every food range on shop floor for
improving customer service which directly affects the financial position of business.
In the month of October 2015, Tesco was the first sole retailer within United Kingdom to
offer customers an immediate price along with brand guarantee. Through this, company does not
charge more in case competitors such as Asda, Morrison’s or Sainsbury are offering it with lesser
prices. Recently, business entity has launched new fresh food brands which are offered at great
prices. This is the way in which company attracts large number of customers by providing them
great value for money and fresh food under a roof. Organization has made improvements across
offers which have strengthened the market. Along with this, in Europe and Asia, Tesco has built
strong and positive sales momentum in the last year (Annual Report and Financial Statements,
Paraphrase This Document
Need a fresh take? Get an instant paraphrase of this document with our AI Paraphraser
2016). In Thailand, company has captured higher market share and transformation program
in Europe has boosted the business growth while reducing operating expenses.
Changes in key financial trends
Tesco is known one of the world’s largest retailers with having 4, 76, 000 colleagues who
serve customers daily in stores and online business. The range of offerings and value added
services have a crucial role in the financial performance of company. In the year 2015-16, group
sales of Tesco were £48.4bn which is declined from the last year, that is, £49.9bn. However,
group operating profit earned before exceptional items is £944m which is improved from the last
year as it was £940m. As a key financial performance statutory operating profit in 2016, Tesco
earned £1,046m. In this year, performance is improved as in 2015; company got statutory loss of
£ (5,750) million. Earnings per share for Tesco are declined in 2016 by .49 paisa. In 2015,
company was earning 5.46p, however in 2016, it has earned 4.97paisa (Annual Report and
Financial Statements, 2016). From the financial report of Tesco, it has been evident that net debt
is declined as compared to the previous years. In 2015, cited company was having net debt of £
(8.5) bn which is decreased to £ (5.1) bn in 2016. The values shown in group statement indicated
that company has earned total comprehensive income of £1,260m for the year 2016. However, in
2015, firm earned loss of £ (6,875) million. Total equity of Tesco is increased as compared to
previous years as in 2015; it had £7071 million as a total equity. Nonetheless, amount is
increased in 2016 to £8,616 million. Hence, there has been found a huge fluctuation in the key
financial figures of Tesco in both the years. Here, financial performance of the firm has
improved in 2016 (Annual Report and Financial Statements, 2016).
PART B: FINANCIAL HEALTH
Computing and analyzing key financial ratios for company
Financial ratios are important for assessing the financial position of an organization for
certain time span. It enables the corporation to arrange appropriate sources of finance by
providing right information to all important stakeholders (Brigham and Ehrhardt, 2013). Also,
important information related to liquidity and operational performance of Tesco can be extracted
with the ratio analysis. It includes several ratios such as liquidity, risk expectations, profitability
and price/earnings. These are explained below along with the calculation-
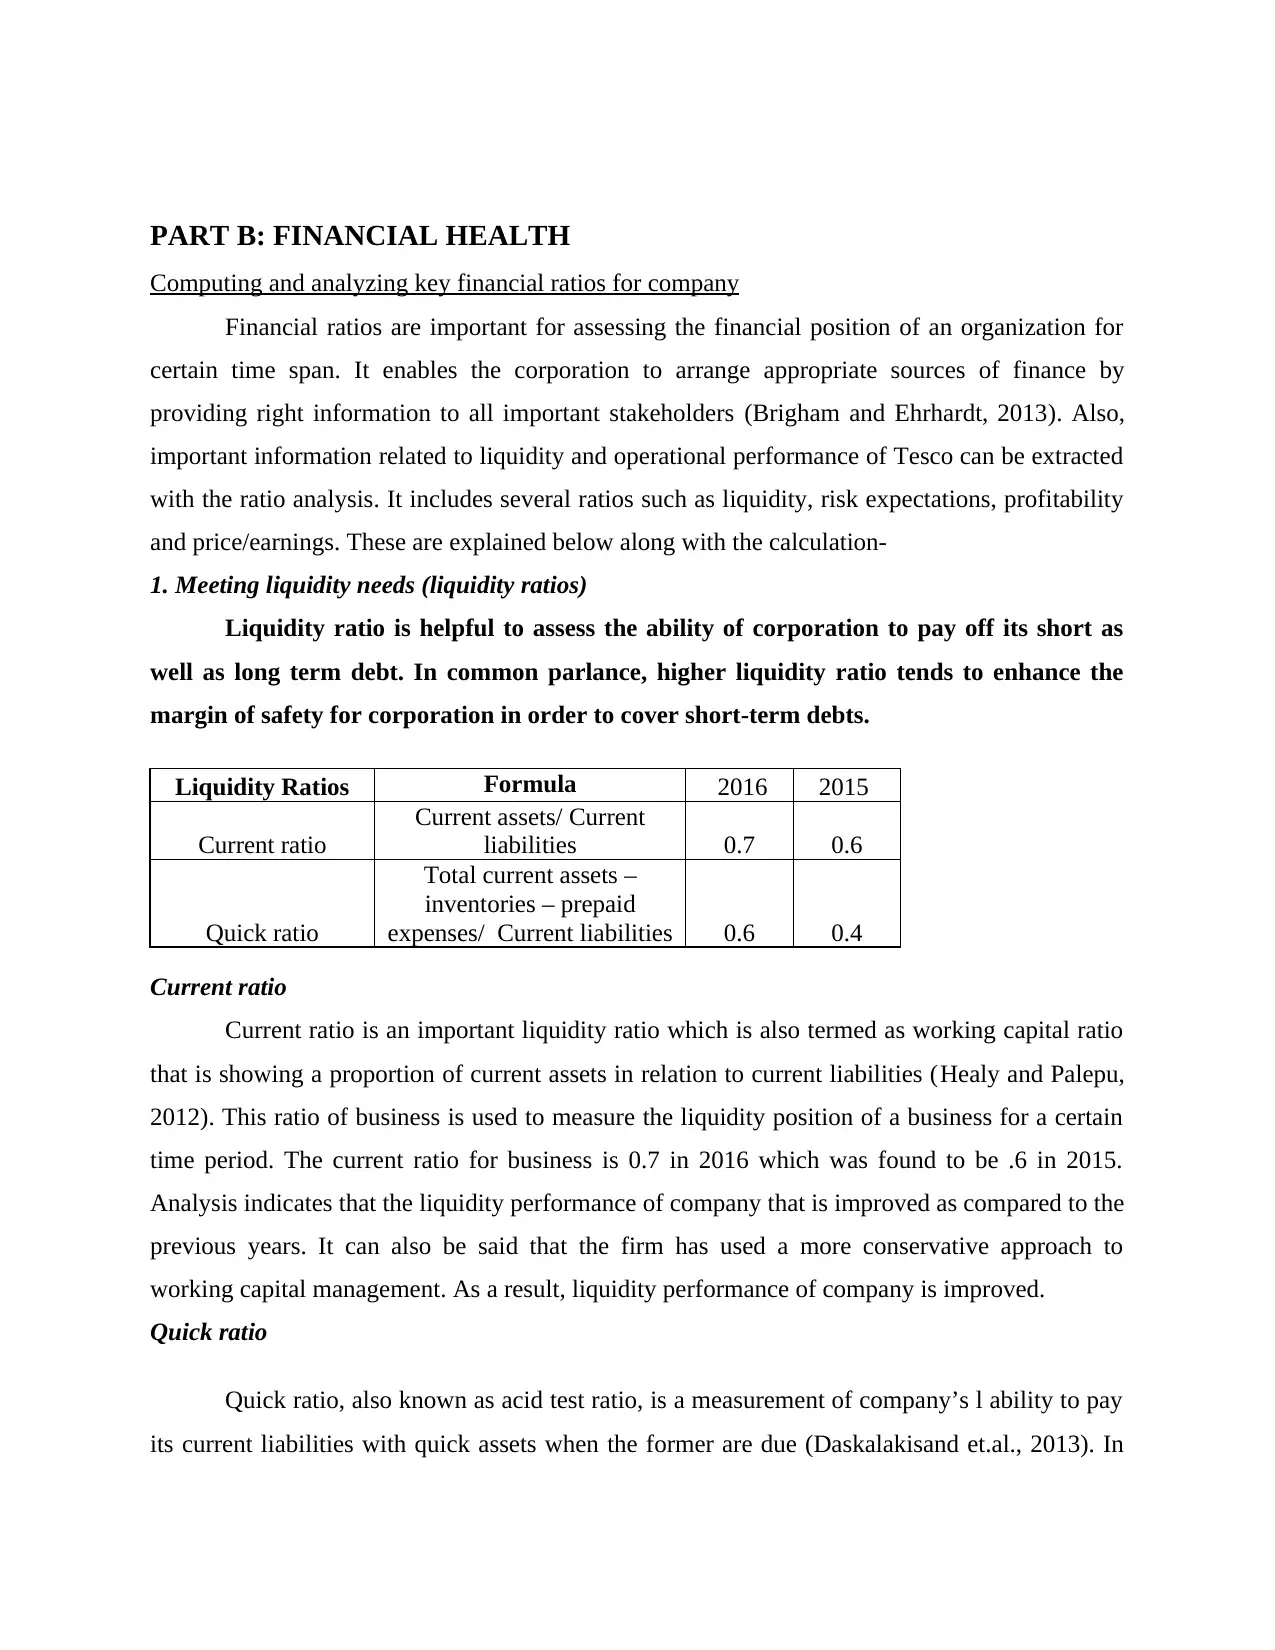
1. Meeting liquidity needs (liquidity ratios)
Liquidity ratio is helpful to assess the ability of corporation to pay off its short as
well as long term debt. In common parlance, higher liquidity ratio tends to enhance the
margin of safety for corporation in order to cover short-term debts.
Liquidity Ratios Formula 2016 2015
Current ratio
Current assets/ Current
liabilities 0.7 0.6
Quick ratio
Total current assets –
inventories – prepaid
expenses/ Current liabilities 0.6 0.4
Current ratio
Current ratio is an important liquidity ratio which is also termed as working capital ratio
that is showing a proportion of current assets in relation to current liabilities (Healy and Palepu,
2012). This ratio of business is used to measure the liquidity position of a business for a certain
time period. The current ratio for business is 0.7 in 2016 which was found to be .6 in 2015.
Analysis indicates that the liquidity performance of company that is improved as compared to the
previous years. It can also be said that the firm has used a more conservative approach to
working capital management. As a result, liquidity performance of company is improved.
Quick ratio
Quick ratio, also known as acid test ratio, is a measurement of company’s l ability to pay
its current liabilities with quick assets when the former are due (Daskalakisand et.al., 2013). In
Computing and analyzing key financial ratios for company
Financial ratios are important for assessing the financial position of an organization for
certain time span. It enables the corporation to arrange appropriate sources of finance by
providing right information to all important stakeholders (Brigham and Ehrhardt, 2013). Also,
important information related to liquidity and operational performance of Tesco can be extracted
with the ratio analysis. It includes several ratios such as liquidity, risk expectations, profitability
and price/earnings. These are explained below along with the calculation-
1. Meeting liquidity needs (liquidity ratios)
Liquidity ratio is helpful to assess the ability of corporation to pay off its short as
well as long term debt. In common parlance, higher liquidity ratio tends to enhance the
margin of safety for corporation in order to cover short-term debts.
Liquidity Ratios Formula 2016 2015
Current ratio
Current assets/ Current
liabilities 0.7 0.6
Quick ratio
Total current assets –
inventories – prepaid
expenses/ Current liabilities 0.6 0.4
Current ratio
Current ratio is an important liquidity ratio which is also termed as working capital ratio
that is showing a proportion of current assets in relation to current liabilities (Healy and Palepu,
2012). This ratio of business is used to measure the liquidity position of a business for a certain
time period. The current ratio for business is 0.7 in 2016 which was found to be .6 in 2015.
Analysis indicates that the liquidity performance of company that is improved as compared to the
previous years. It can also be said that the firm has used a more conservative approach to
working capital management. As a result, liquidity performance of company is improved.
Quick ratio
Quick ratio, also known as acid test ratio, is a measurement of company’s l ability to pay
its current liabilities with quick assets when the former are due (Daskalakisand et.al., 2013). In
⊘ This is a preview!⊘
Do you want full access?
Subscribe today to unlock all pages.
Trusted by 1+ million students worldwide
other words, it is a measurement of how company is able to pay short term liabilities with cash,
cash equivalents, short-term investments such as marketable securities, current account
receivables, etc. The higher quick ratio is favorable for company. Quick ratio for Tesco in 2015
was .4 which is improved to .6 in 2016. It can be said that liquidity position of company has
improved as compared to the previous year.
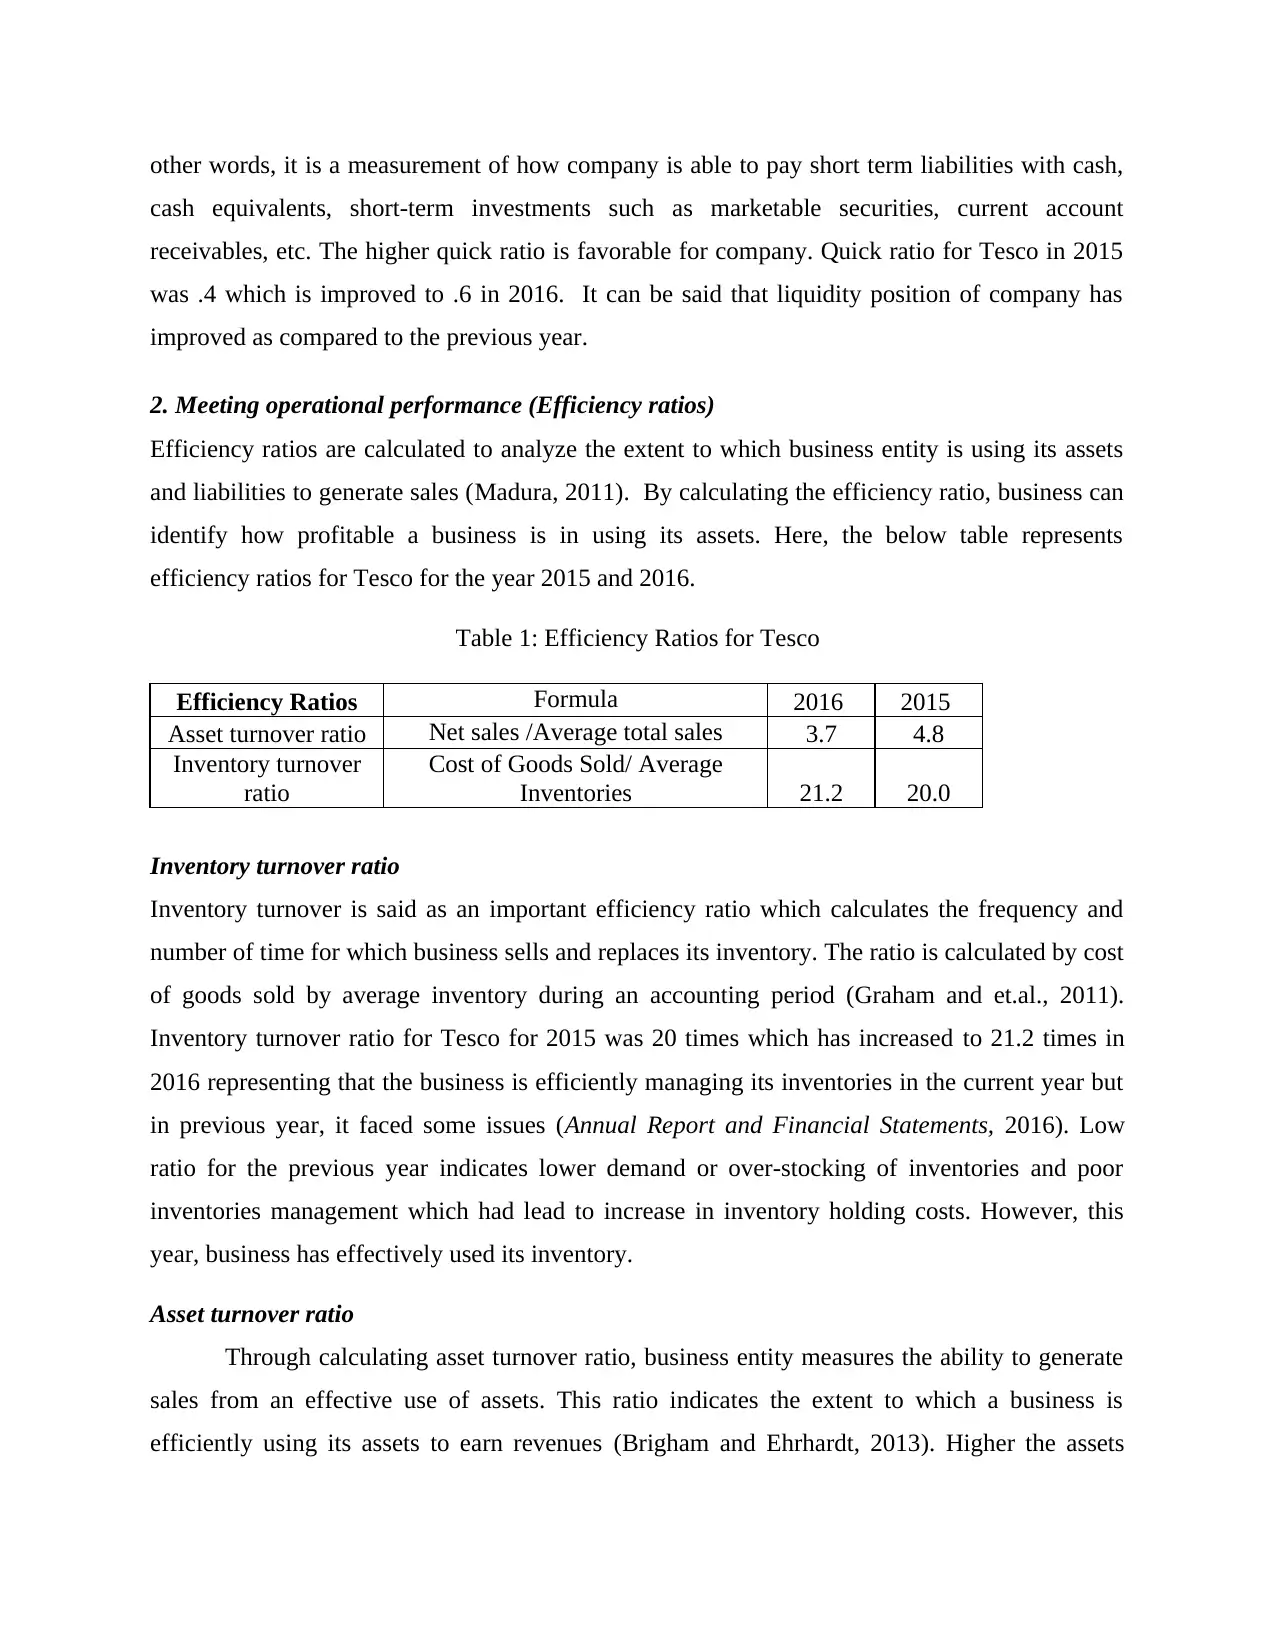
2. Meeting operational performance (Efficiency ratios)
Efficiency ratios are calculated to analyze the extent to which business entity is using its assets
and liabilities to generate sales (Madura, 2011). By calculating the efficiency ratio, business can
identify how profitable a business is in using its assets. Here, the below table represents
efficiency ratios for Tesco for the year 2015 and 2016.
Table 1: Efficiency Ratios for Tesco
Efficiency Ratios Formula 2016 2015
Asset turnover ratio Net sales /Average total sales 3.7 4.8
Inventory turnover
ratio
Cost of Goods Sold/ Average
Inventories 21.2 20.0
Inventory turnover ratio
Inventory turnover is said as an important efficiency ratio which calculates the frequency and
number of time for which business sells and replaces its inventory. The ratio is calculated by cost
of goods sold by average inventory during an accounting period (Graham and et.al., 2011).
Inventory turnover ratio for Tesco for 2015 was 20 times which has increased to 21.2 times in
2016 representing that the business is efficiently managing its inventories in the current year but
in previous year, it faced some issues (Annual Report and Financial Statements, 2016). Low
ratio for the previous year indicates lower demand or over-stocking of inventories and poor
inventories management which had lead to increase in inventory holding costs. However, this
year, business has effectively used its inventory.
Asset turnover ratio
Through calculating asset turnover ratio, business entity measures the ability to generate
sales from an effective use of assets. This ratio indicates the extent to which a business is
efficiently using its assets to earn revenues (Brigham and Ehrhardt, 2013). Higher the assets
cash equivalents, short-term investments such as marketable securities, current account
receivables, etc. The higher quick ratio is favorable for company. Quick ratio for Tesco in 2015
was .4 which is improved to .6 in 2016. It can be said that liquidity position of company has
improved as compared to the previous year.
2. Meeting operational performance (Efficiency ratios)
Efficiency ratios are calculated to analyze the extent to which business entity is using its assets
and liabilities to generate sales (Madura, 2011). By calculating the efficiency ratio, business can
identify how profitable a business is in using its assets. Here, the below table represents
efficiency ratios for Tesco for the year 2015 and 2016.
Table 1: Efficiency Ratios for Tesco
Efficiency Ratios Formula 2016 2015
Asset turnover ratio Net sales /Average total sales 3.7 4.8
Inventory turnover
ratio
Cost of Goods Sold/ Average
Inventories 21.2 20.0
Inventory turnover ratio
Inventory turnover is said as an important efficiency ratio which calculates the frequency and
number of time for which business sells and replaces its inventory. The ratio is calculated by cost
of goods sold by average inventory during an accounting period (Graham and et.al., 2011).
Inventory turnover ratio for Tesco for 2015 was 20 times which has increased to 21.2 times in
2016 representing that the business is efficiently managing its inventories in the current year but
in previous year, it faced some issues (Annual Report and Financial Statements, 2016). Low
ratio for the previous year indicates lower demand or over-stocking of inventories and poor
inventories management which had lead to increase in inventory holding costs. However, this
year, business has effectively used its inventory.
Asset turnover ratio
Through calculating asset turnover ratio, business entity measures the ability to generate
sales from an effective use of assets. This ratio indicates the extent to which a business is
efficiently using its assets to earn revenues (Brigham and Ehrhardt, 2013). Higher the assets
Paraphrase This Document
Need a fresh take? Get an instant paraphrase of this document with our AI Paraphraser
turnover ratio, it will be more favorable for the business. The asset turnover ratio for 2015 was
4.8 and for 2016, it decreased to 3.7 (Annual Report and Financial Statements, 2016). From the
analysis, it can be seen that in previous years, company has effectively used its assets to generate
higher sales. Hence, higher ratio in previous years was more favorable. In the previous year,
higher turnover ratio indicated that company has earned good revenues by using its assets
efficiently. In this year, firm has faced some issues regarding management or production
problems that have affected its asset turnover ratio.
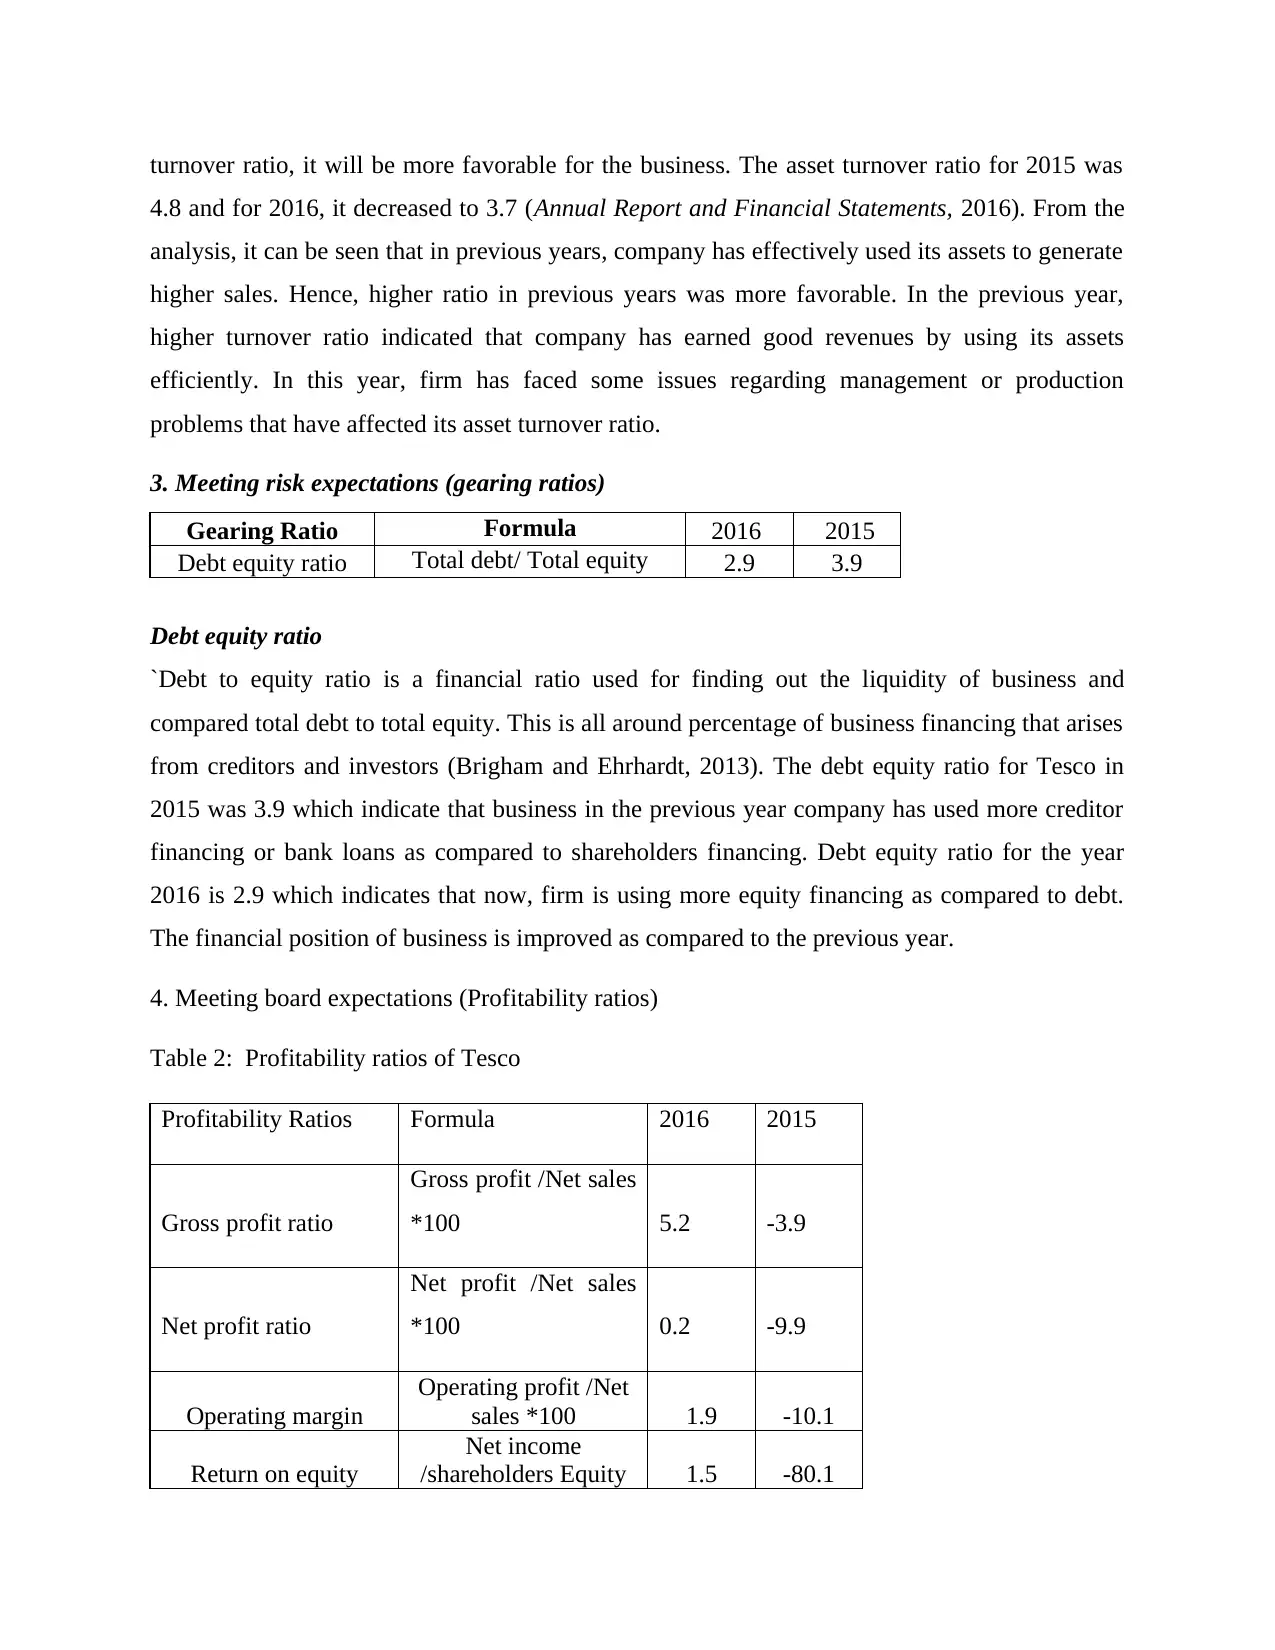
3. Meeting risk expectations (gearing ratios)
Gearing Ratio Formula 2016 2015
Debt equity ratio Total debt/ Total equity 2.9 3.9
Debt equity ratio
`Debt to equity ratio is a financial ratio used for finding out the liquidity of business and
compared total debt to total equity. This is all around percentage of business financing that arises
from creditors and investors (Brigham and Ehrhardt, 2013). The debt equity ratio for Tesco in
2015 was 3.9 which indicate that business in the previous year company has used more creditor
financing or bank loans as compared to shareholders financing. Debt equity ratio for the year
2016 is 2.9 which indicates that now, firm is using more equity financing as compared to debt.
The financial position of business is improved as compared to the previous year.
4. Meeting board expectations (Profitability ratios)
Table 2: Profitability ratios of Tesco
Profitability Ratios Formula 2016 2015
Gross profit ratio
Gross profit /Net sales
*100 5.2 -3.9
Net profit ratio
Net profit /Net sales
*100 0.2 -9.9
Operating margin
Operating profit /Net
sales *100 1.9 -10.1
Return on equity
Net income
/shareholders Equity 1.5 -80.1
4.8 and for 2016, it decreased to 3.7 (Annual Report and Financial Statements, 2016). From the
analysis, it can be seen that in previous years, company has effectively used its assets to generate
higher sales. Hence, higher ratio in previous years was more favorable. In the previous year,
higher turnover ratio indicated that company has earned good revenues by using its assets
efficiently. In this year, firm has faced some issues regarding management or production
problems that have affected its asset turnover ratio.
3. Meeting risk expectations (gearing ratios)
Gearing Ratio Formula 2016 2015
Debt equity ratio Total debt/ Total equity 2.9 3.9
Debt equity ratio
`Debt to equity ratio is a financial ratio used for finding out the liquidity of business and
compared total debt to total equity. This is all around percentage of business financing that arises
from creditors and investors (Brigham and Ehrhardt, 2013). The debt equity ratio for Tesco in
2015 was 3.9 which indicate that business in the previous year company has used more creditor
financing or bank loans as compared to shareholders financing. Debt equity ratio for the year
2016 is 2.9 which indicates that now, firm is using more equity financing as compared to debt.
The financial position of business is improved as compared to the previous year.
4. Meeting board expectations (Profitability ratios)
Table 2: Profitability ratios of Tesco
Profitability Ratios Formula 2016 2015
Gross profit ratio
Gross profit /Net sales
*100 5.2 -3.9
Net profit ratio
Net profit /Net sales
*100 0.2 -9.9
Operating margin
Operating profit /Net
sales *100 1.9 -10.1
Return on equity
Net income
/shareholders Equity 1.5 -80.1
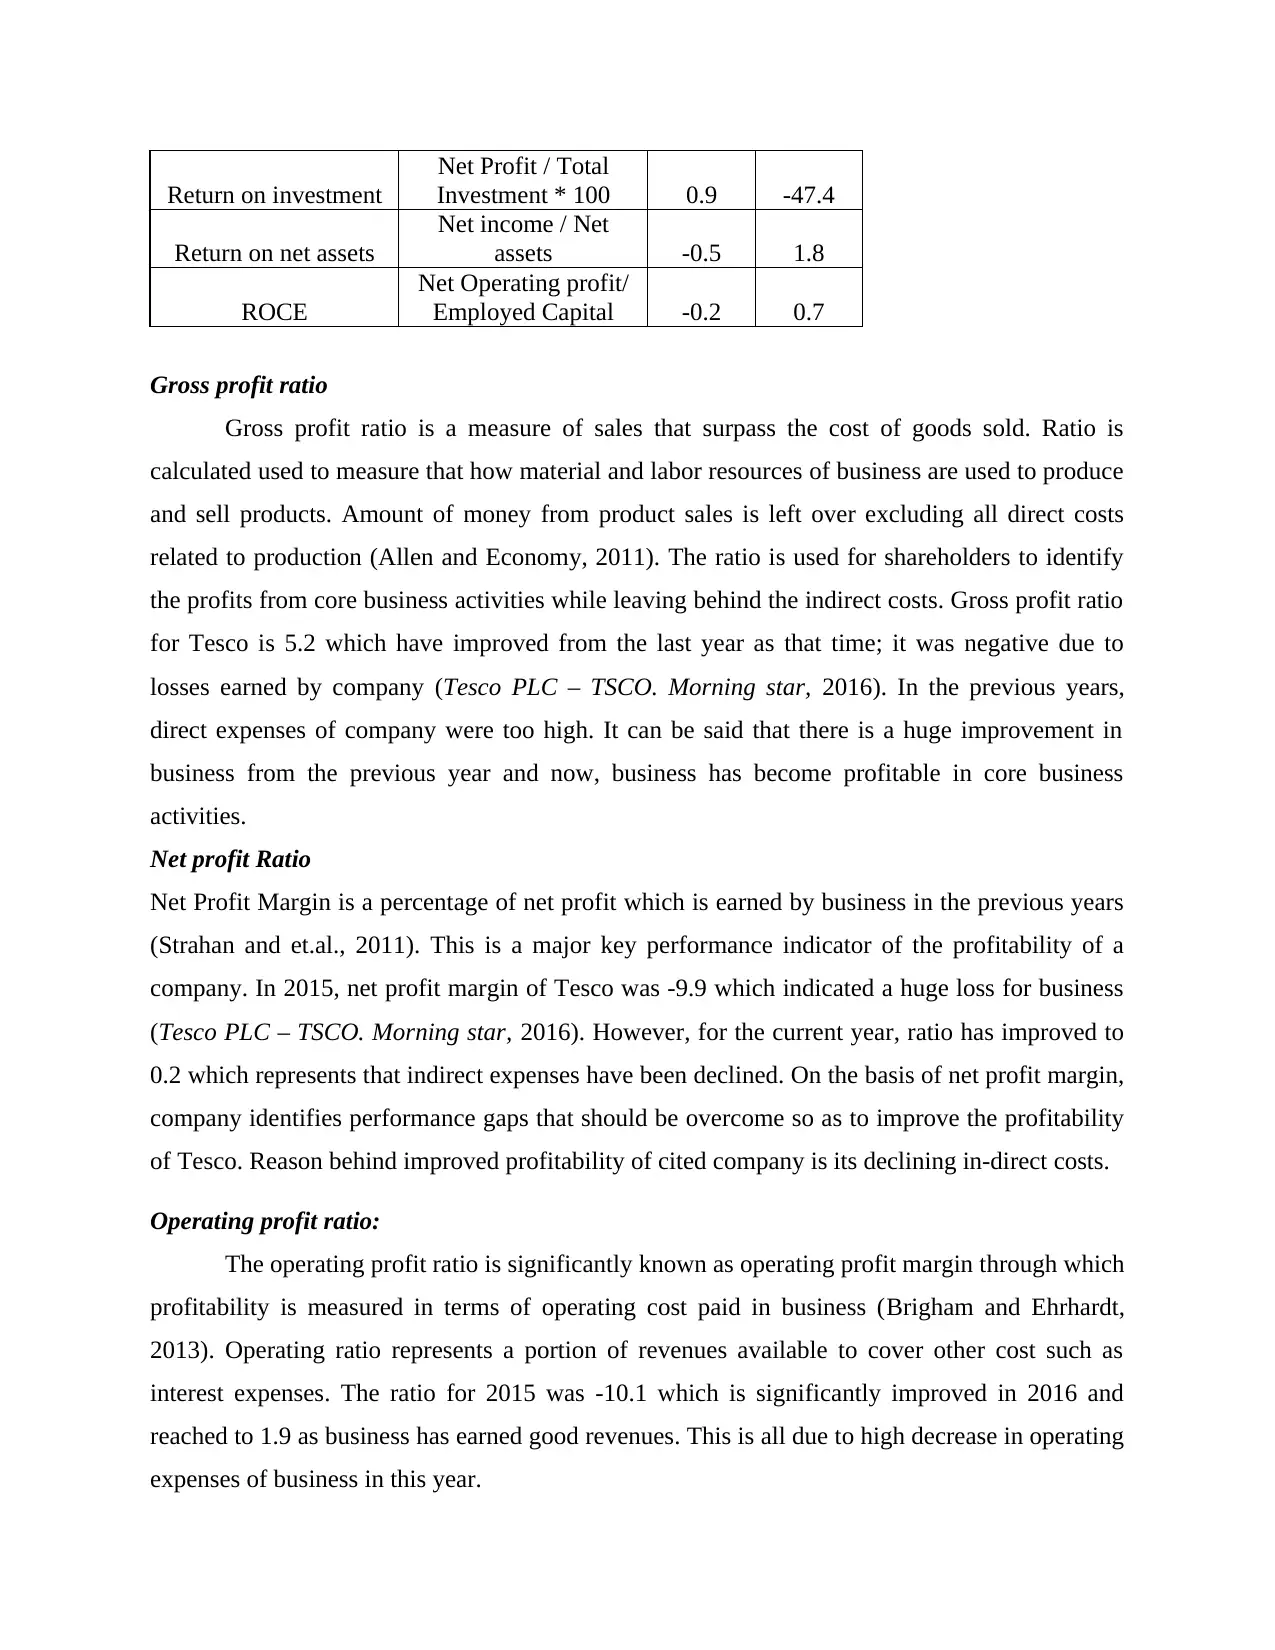
Return on investment
Net Profit / Total
Investment * 100 0.9 -47.4
Return on net assets
Net income / Net
assets -0.5 1.8
ROCE
Net Operating profit/
Employed Capital -0.2 0.7
Gross profit ratio
Gross profit ratio is a measure of sales that surpass the cost of goods sold. Ratio is
calculated used to measure that how material and labor resources of business are used to produce
and sell products. Amount of money from product sales is left over excluding all direct costs
related to production (Allen and Economy, 2011). The ratio is used for shareholders to identify
the profits from core business activities while leaving behind the indirect costs. Gross profit ratio
for Tesco is 5.2 which have improved from the last year as that time; it was negative due to
losses earned by company (Tesco PLC – TSCO. Morning star, 2016). In the previous years,
direct expenses of company were too high. It can be said that there is a huge improvement in
business from the previous year and now, business has become profitable in core business
activities.
Net profit Ratio
Net Profit Margin is a percentage of net profit which is earned by business in the previous years
(Strahan and et.al., 2011). This is a major key performance indicator of the profitability of a
company. In 2015, net profit margin of Tesco was -9.9 which indicated a huge loss for business
(Tesco PLC – TSCO. Morning star, 2016). However, for the current year, ratio has improved to
0.2 which represents that indirect expenses have been declined. On the basis of net profit margin,
company identifies performance gaps that should be overcome so as to improve the profitability
of Tesco. Reason behind improved profitability of cited company is its declining in-direct costs.
Operating profit ratio:
The operating profit ratio is significantly known as operating profit margin through which
profitability is measured in terms of operating cost paid in business (Brigham and Ehrhardt,
2013). Operating ratio represents a portion of revenues available to cover other cost such as
interest expenses. The ratio for 2015 was -10.1 which is significantly improved in 2016 and
reached to 1.9 as business has earned good revenues. This is all due to high decrease in operating
expenses of business in this year.
⊘ This is a preview!⊘
Do you want full access?
Subscribe today to unlock all pages.
Trusted by 1+ million students worldwide
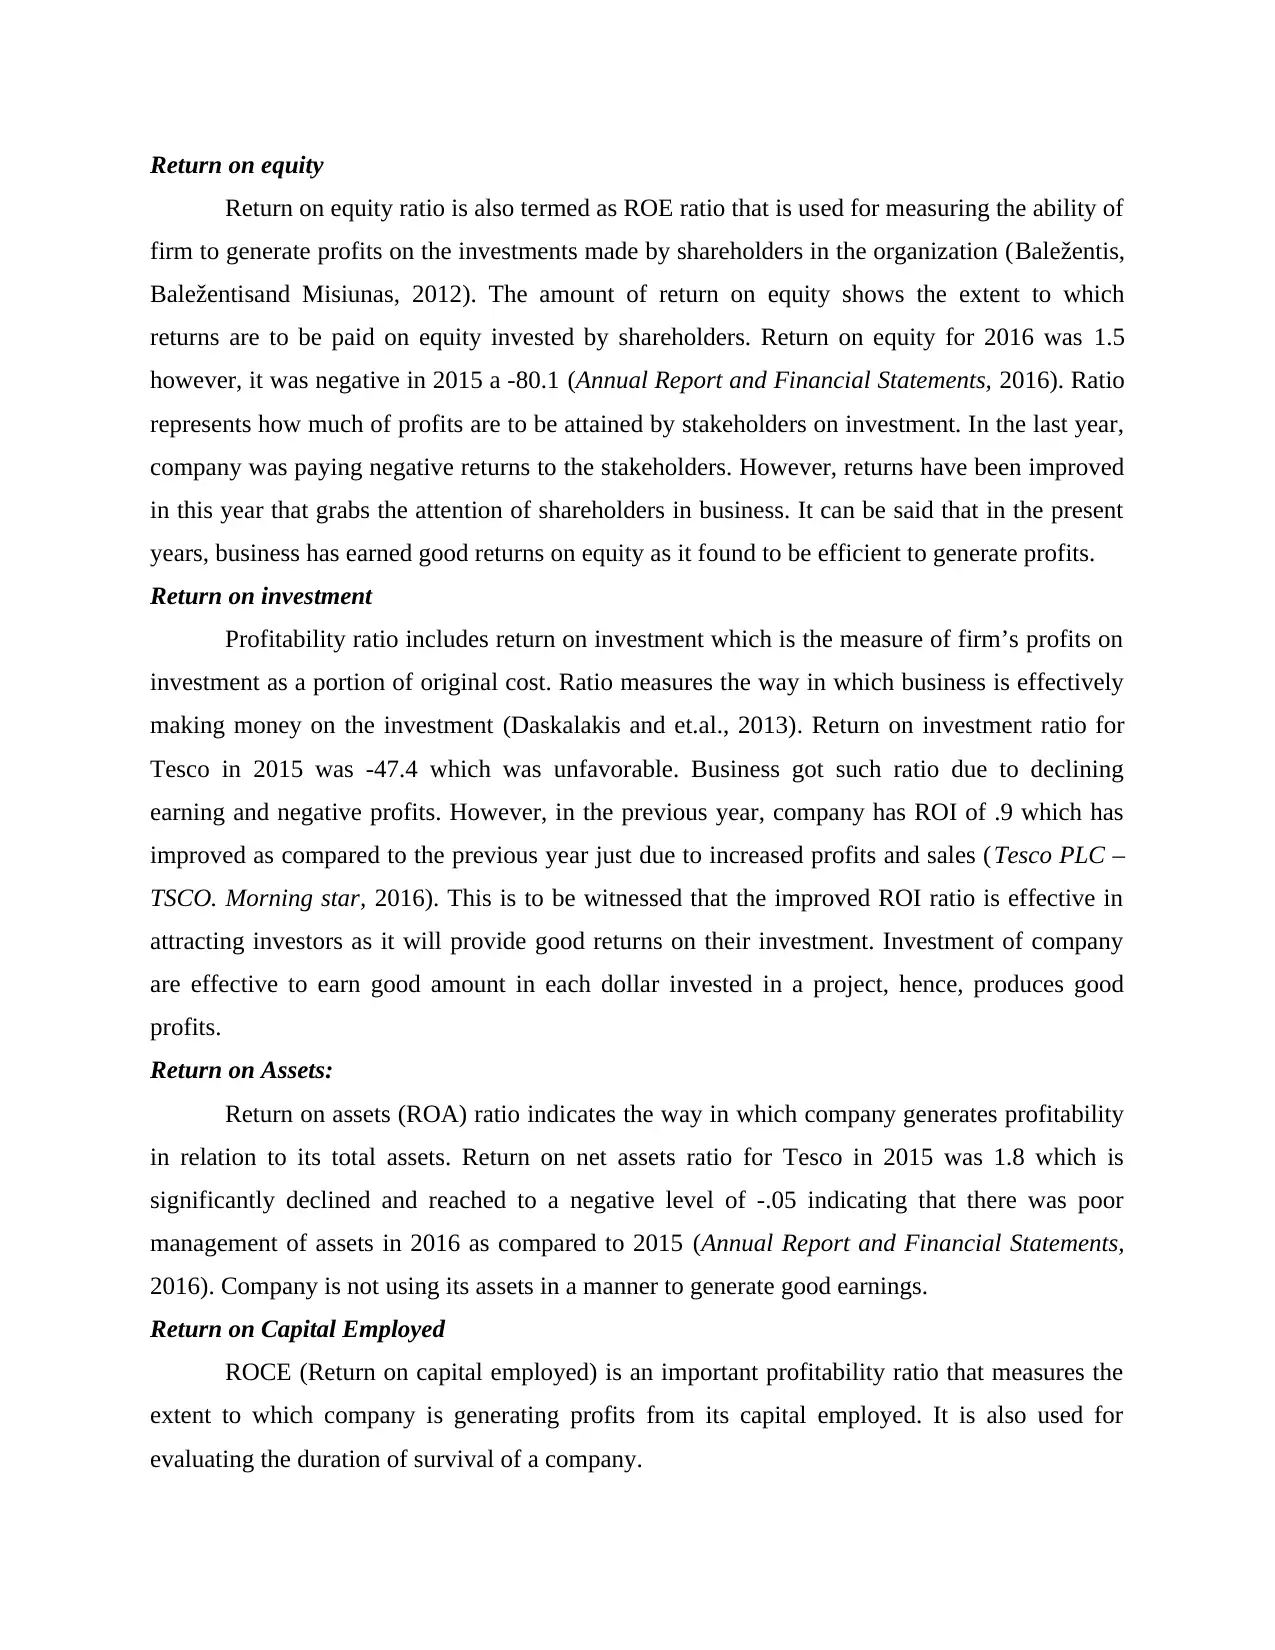
Return on equity
Return on equity ratio is also termed as ROE ratio that is used for measuring the ability of
firm to generate profits on the investments made by shareholders in the organization (Baležentis,
Baležentisand Misiunas, 2012). The amount of return on equity shows the extent to which
returns are to be paid on equity invested by shareholders. Return on equity for 2016 was 1.5
however, it was negative in 2015 a -80.1 (Annual Report and Financial Statements, 2016). Ratio
represents how much of profits are to be attained by stakeholders on investment. In the last year,
company was paying negative returns to the stakeholders. However, returns have been improved
in this year that grabs the attention of shareholders in business. It can be said that in the present
years, business has earned good returns on equity as it found to be efficient to generate profits.
Return on investment
Profitability ratio includes return on investment which is the measure of firm’s profits on
investment as a portion of original cost. Ratio measures the way in which business is effectively
making money on the investment (Daskalakis and et.al., 2013). Return on investment ratio for
Tesco in 2015 was -47.4 which was unfavorable. Business got such ratio due to declining
earning and negative profits. However, in the previous year, company has ROI of .9 which has
improved as compared to the previous year just due to increased profits and sales (Tesco PLC –
TSCO. Morning star, 2016). This is to be witnessed that the improved ROI ratio is effective in
attracting investors as it will provide good returns on their investment. Investment of company
are effective to earn good amount in each dollar invested in a project, hence, produces good
profits.
Return on Assets:
Return on assets (ROA) ratio indicates the way in which company generates profitability
in relation to its total assets. Return on net assets ratio for Tesco in 2015 was 1.8 which is
significantly declined and reached to a negative level of -.05 indicating that there was poor
management of assets in 2016 as compared to 2015 (Annual Report and Financial Statements,
2016). Company is not using its assets in a manner to generate good earnings.
Return on Capital Employed
ROCE (Return on capital employed) is an important profitability ratio that measures the
extent to which company is generating profits from its capital employed. It is also used for
evaluating the duration of survival of a company.
Paraphrase This Document
Need a fresh take? Get an instant paraphrase of this document with our AI Paraphraser
The investors of business are keen to identify the way in which business is generating
return on capital employed on each dollar of capital employed. In the year 2015, company
generated .7 as a return to capital employed which has declined in 2016 and reached to the
negative level of -.02 which indicated that investors will be de-motivated to invest in Tesco.
Hence, company’s long-term financing strategies are not in a line with financial goals (Annual
Report and Financial Statements, 2016).
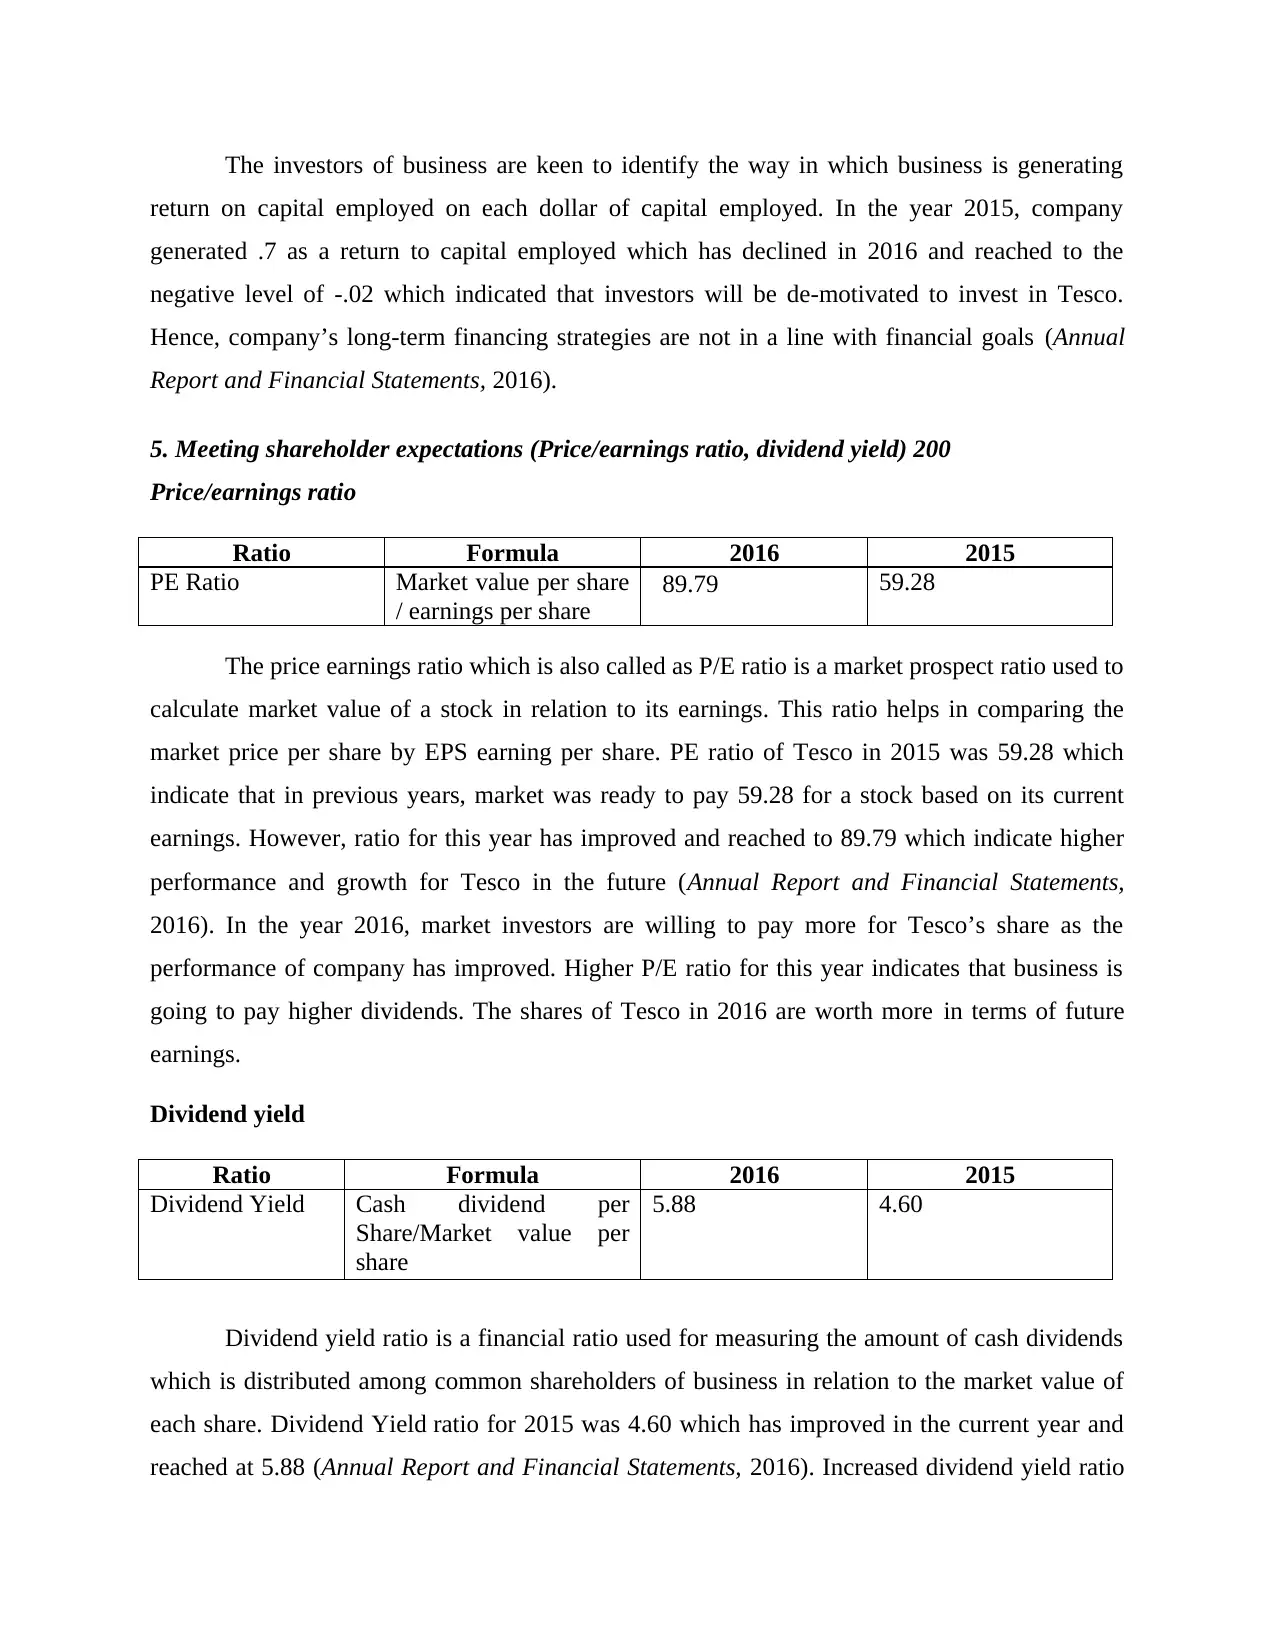
5. Meeting shareholder expectations (Price/earnings ratio, dividend yield) 200
Price/earnings ratio
Ratio Formula 2016 2015
PE Ratio Market value per share
/ earnings per share
89.79 59.28
The price earnings ratio which is also called as P/E ratio is a market prospect ratio used to
calculate market value of a stock in relation to its earnings. This ratio helps in comparing the
market price per share by EPS earning per share. PE ratio of Tesco in 2015 was 59.28 which
indicate that in previous years, market was ready to pay 59.28 for a stock based on its current
earnings. However, ratio for this year has improved and reached to 89.79 which indicate higher
performance and growth for Tesco in the future (Annual Report and Financial Statements,
2016). In the year 2016, market investors are willing to pay more for Tesco’s share as the
performance of company has improved. Higher P/E ratio for this year indicates that business is
going to pay higher dividends. The shares of Tesco in 2016 are worth more in terms of future
earnings.
Dividend yield
Ratio Formula 2016 2015
Dividend Yield Cash dividend per
Share/Market value per
share
5.88 4.60
Dividend yield ratio is a financial ratio used for measuring the amount of cash dividends
which is distributed among common shareholders of business in relation to the market value of
each share. Dividend Yield ratio for 2015 was 4.60 which has improved in the current year and
reached at 5.88 (Annual Report and Financial Statements, 2016). Increased dividend yield ratio
return on capital employed on each dollar of capital employed. In the year 2015, company
generated .7 as a return to capital employed which has declined in 2016 and reached to the
negative level of -.02 which indicated that investors will be de-motivated to invest in Tesco.
Hence, company’s long-term financing strategies are not in a line with financial goals (Annual
Report and Financial Statements, 2016).
5. Meeting shareholder expectations (Price/earnings ratio, dividend yield) 200
Price/earnings ratio
Ratio Formula 2016 2015
PE Ratio Market value per share
/ earnings per share
89.79 59.28
The price earnings ratio which is also called as P/E ratio is a market prospect ratio used to
calculate market value of a stock in relation to its earnings. This ratio helps in comparing the
market price per share by EPS earning per share. PE ratio of Tesco in 2015 was 59.28 which
indicate that in previous years, market was ready to pay 59.28 for a stock based on its current
earnings. However, ratio for this year has improved and reached to 89.79 which indicate higher
performance and growth for Tesco in the future (Annual Report and Financial Statements,
2016). In the year 2016, market investors are willing to pay more for Tesco’s share as the
performance of company has improved. Higher P/E ratio for this year indicates that business is
going to pay higher dividends. The shares of Tesco in 2016 are worth more in terms of future
earnings.
Dividend yield
Ratio Formula 2016 2015
Dividend Yield Cash dividend per
Share/Market value per
share
5.88 4.60
Dividend yield ratio is a financial ratio used for measuring the amount of cash dividends
which is distributed among common shareholders of business in relation to the market value of
each share. Dividend Yield ratio for 2015 was 4.60 which has improved in the current year and
reached at 5.88 (Annual Report and Financial Statements, 2016). Increased dividend yield ratio
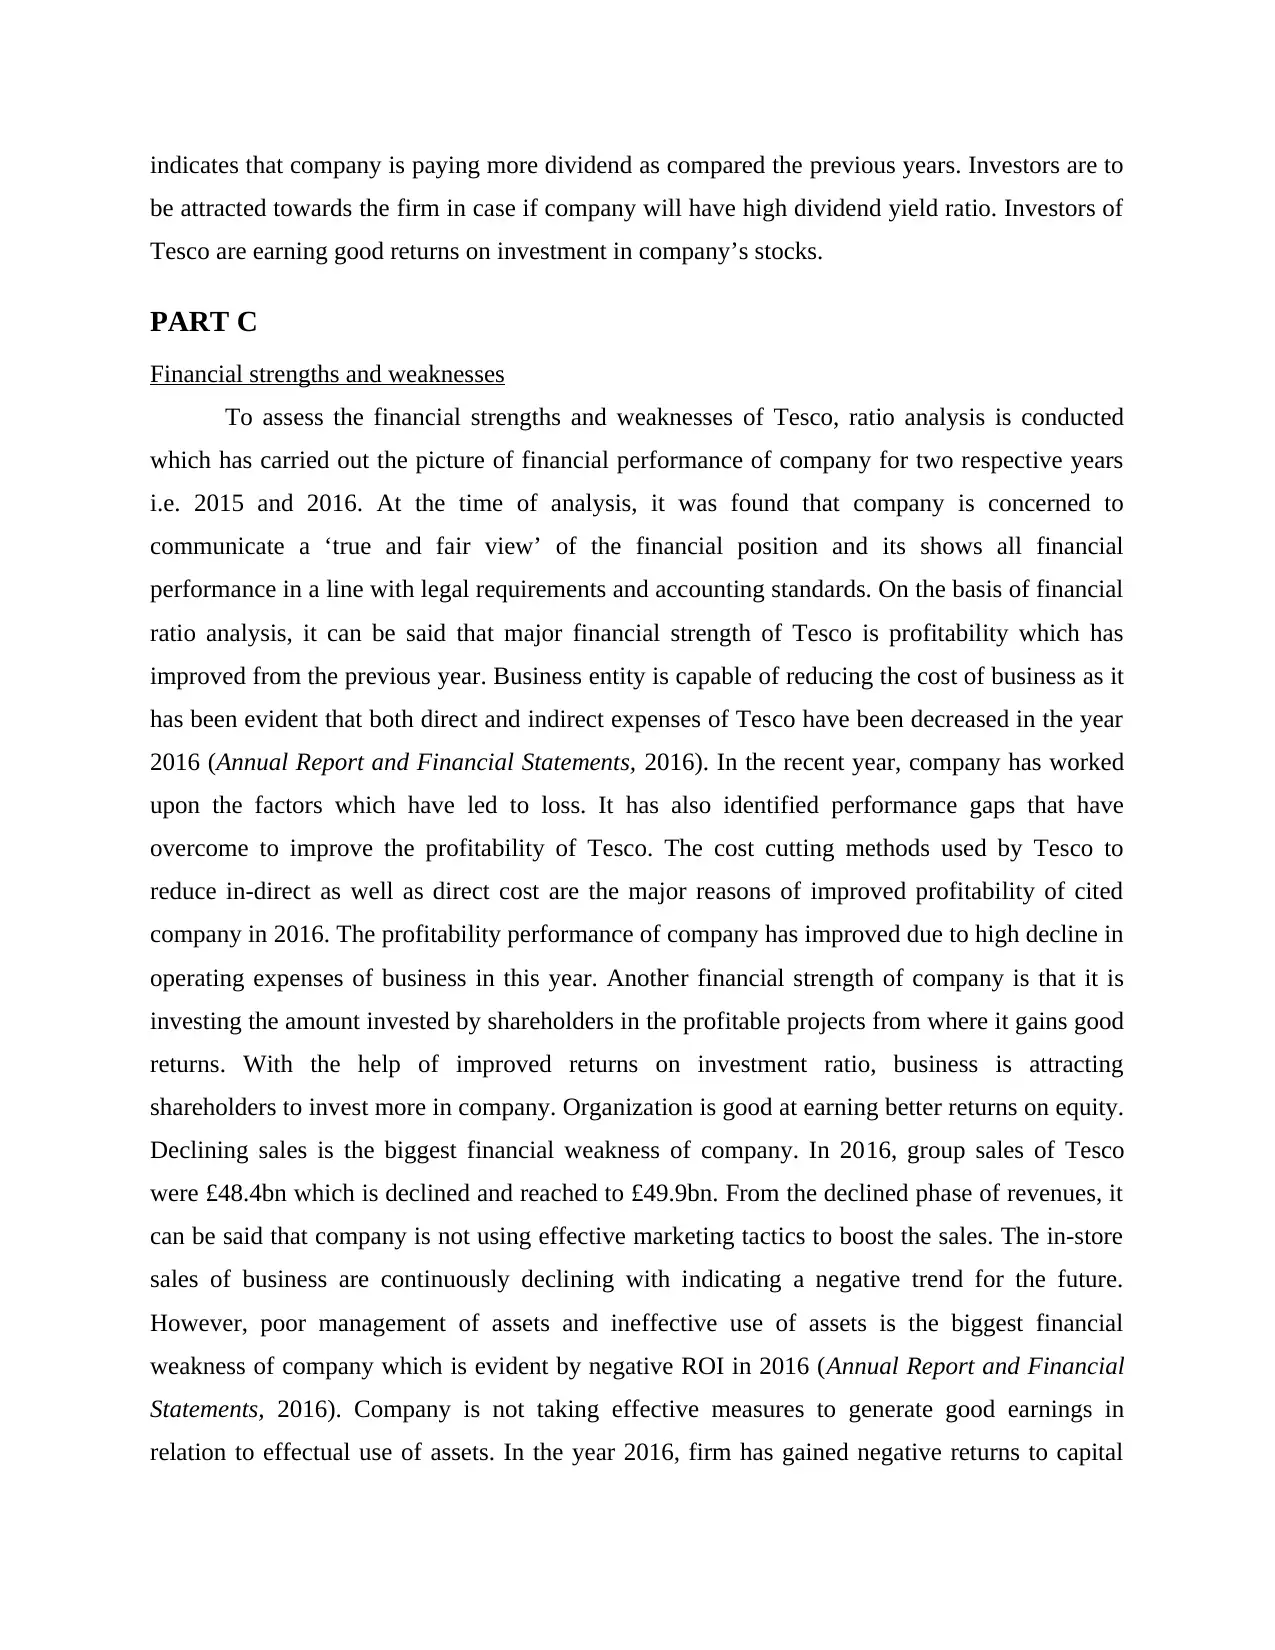
indicates that company is paying more dividend as compared the previous years. Investors are to
be attracted towards the firm in case if company will have high dividend yield ratio. Investors of
Tesco are earning good returns on investment in company’s stocks.
PART C
Financial strengths and weaknesses
To assess the financial strengths and weaknesses of Tesco, ratio analysis is conducted
which has carried out the picture of financial performance of company for two respective years
i.e. 2015 and 2016. At the time of analysis, it was found that company is concerned to
communicate a ‘true and fair view’ of the financial position and its shows all financial
performance in a line with legal requirements and accounting standards. On the basis of financial
ratio analysis, it can be said that major financial strength of Tesco is profitability which has
improved from the previous year. Business entity is capable of reducing the cost of business as it
has been evident that both direct and indirect expenses of Tesco have been decreased in the year
2016 (Annual Report and Financial Statements, 2016). In the recent year, company has worked
upon the factors which have led to loss. It has also identified performance gaps that have
overcome to improve the profitability of Tesco. The cost cutting methods used by Tesco to
reduce in-direct as well as direct cost are the major reasons of improved profitability of cited
company in 2016. The profitability performance of company has improved due to high decline in
operating expenses of business in this year. Another financial strength of company is that it is
investing the amount invested by shareholders in the profitable projects from where it gains good
returns. With the help of improved returns on investment ratio, business is attracting
shareholders to invest more in company. Organization is good at earning better returns on equity.
Declining sales is the biggest financial weakness of company. In 2016, group sales of Tesco
were £48.4bn which is declined and reached to £49.9bn. From the declined phase of revenues, it
can be said that company is not using effective marketing tactics to boost the sales. The in-store
sales of business are continuously declining with indicating a negative trend for the future.
However, poor management of assets and ineffective use of assets is the biggest financial
weakness of company which is evident by negative ROI in 2016 (Annual Report and Financial
Statements, 2016). Company is not taking effective measures to generate good earnings in
relation to effectual use of assets. In the year 2016, firm has gained negative returns to capital
⊘ This is a preview!⊘
Do you want full access?
Subscribe today to unlock all pages.
Trusted by 1+ million students worldwide
1 out of 16
Related Documents


Your All-in-One AI-Powered Toolkit for Academic Success.
+13062052269
info@desklib.com
Available 24*7 on WhatsApp / Email
![[object Object]](/_next/static/media/star-bottom.7253800d.svg)
Unlock your academic potential
Copyright © 2020–2026 A2Z Services. All Rights Reserved. Developed and managed by ZUCOL.