Comprehensive Financial Analysis and Comparison: Tesco and Sainsbury
VerifiedAdded on  2021/02/19
|25
|3947
|54
Report
AI Summary
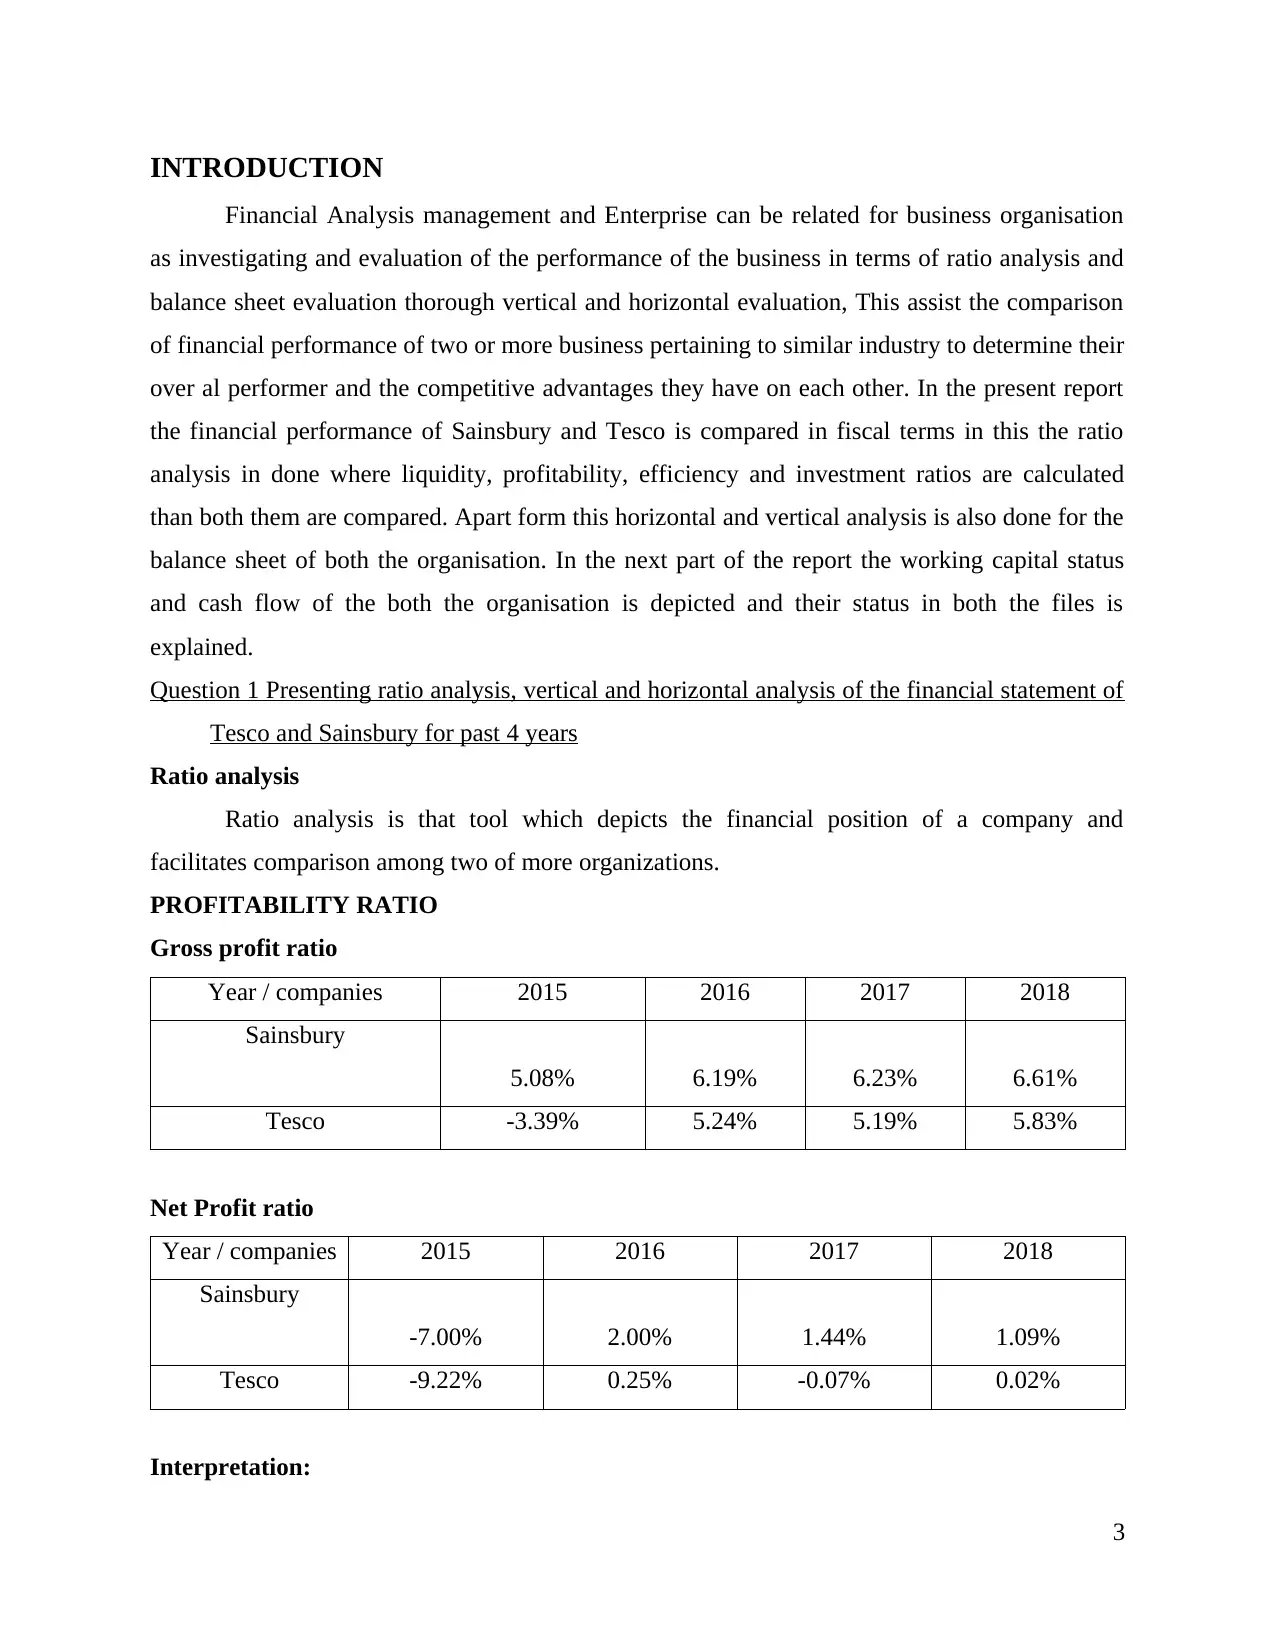
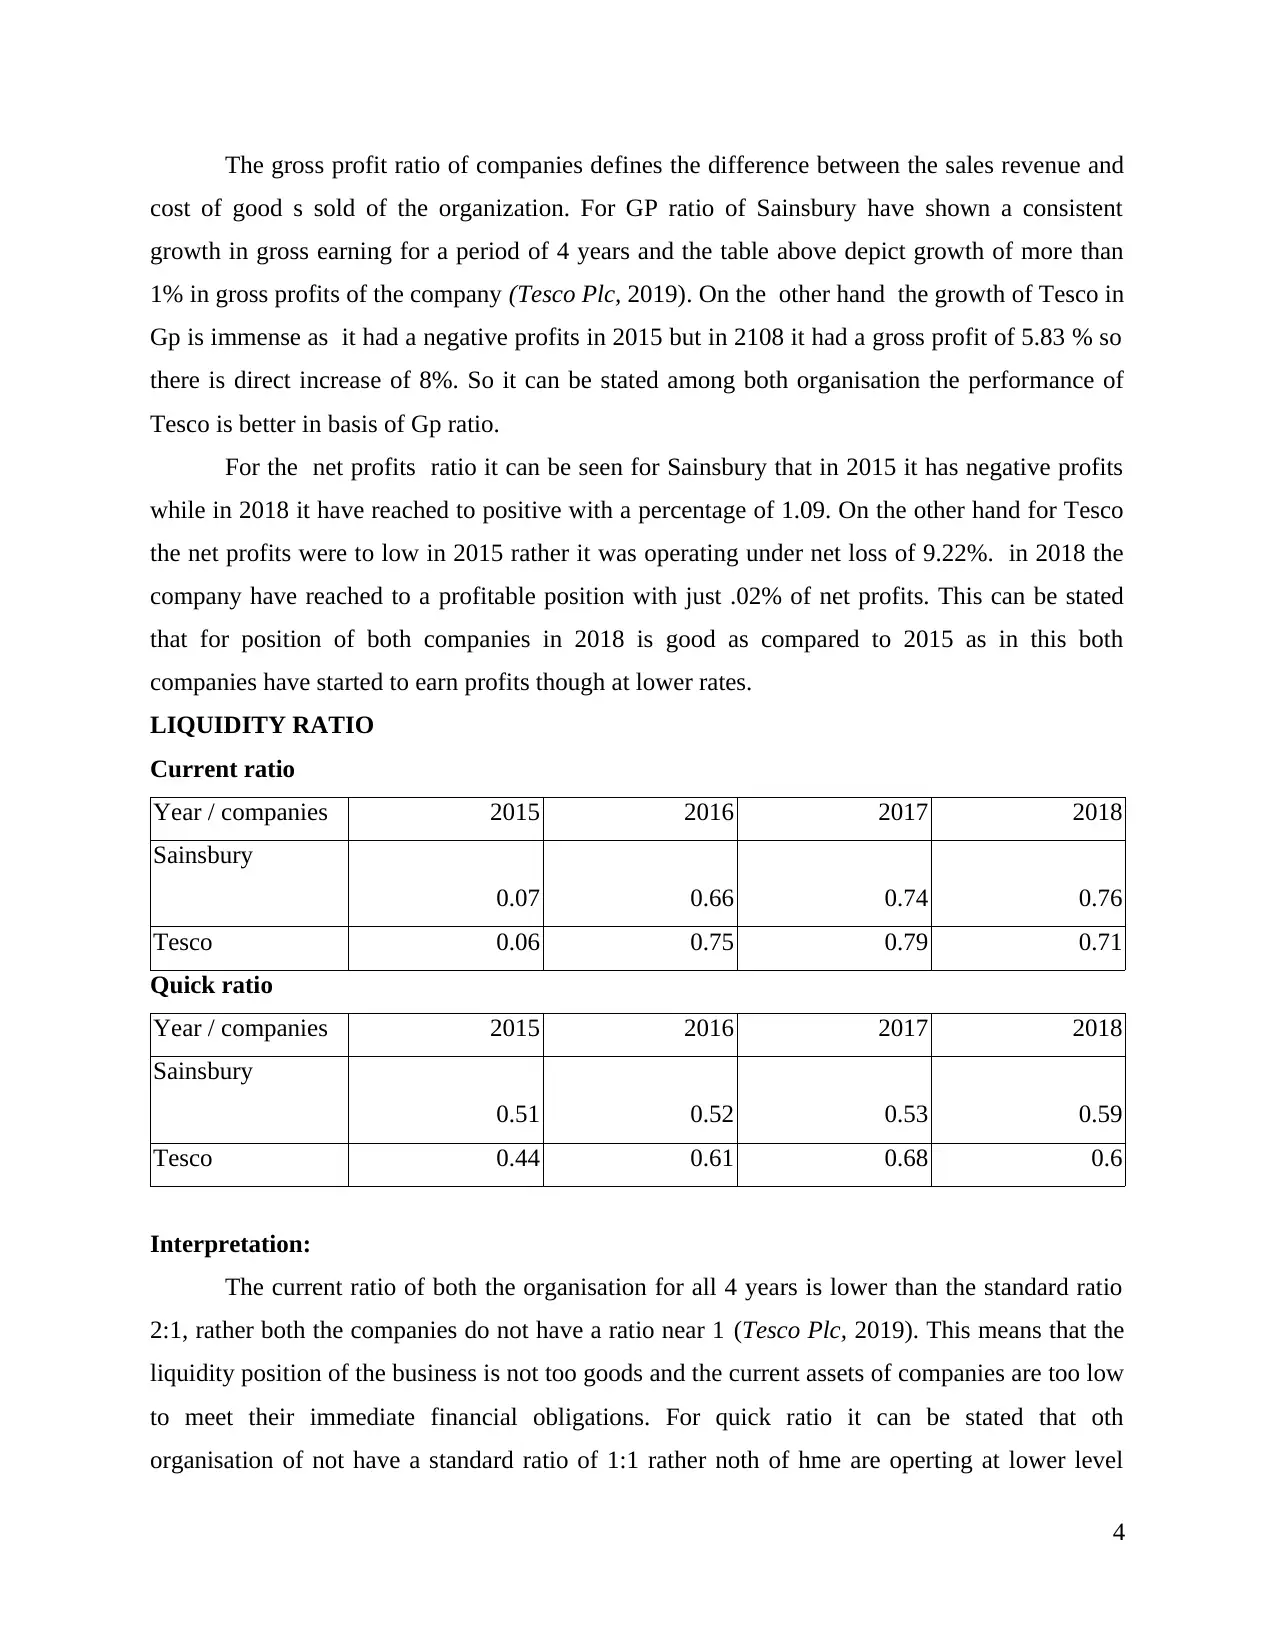
This report presents a comprehensive financial analysis of Tesco and Sainsbury, two major players in the retail industry, over a four-year period. It begins with an introduction to financial analysis management and enterprise, highlighting the importance of ratio analysis and balance sheet evaluation for comparing financial performance. The analysis includes profitability, liquidity, solvency, efficiency, and investment ratios, providing a detailed comparison of the companies' financial positions. Horizontal and vertical analyses of the income statements and balance sheets are also performed to assess trends and changes over time. Furthermore, the report examines the working capital and cash flow statements of both organizations, explaining their significance in decision-making processes. The findings offer valuable insights into the financial health, performance, and competitive advantages of Tesco and Sainsbury, aiding in understanding their financial strategies and outcomes.

Financial Analysis
Management and Enterpirse
Paraphrase This Document
Need a fresh take? Get an instant paraphrase of this document with our AI Paraphraser

Table of Contents
INTRODUCTION...........................................................................................................................3
Question 1 Presenting ratio analysis, vertical and horizontal analysis of the financial statement
of Tesco and Sainsbury for past 4 years......................................................................................3
Question 2 Explaining the importance of working capital analysis for both the companies in
the process of decision-making.................................................................................................12
Question 3 Critical analysis of the cash flow statement of both the companies for last two
years and its assistance in the decision making process...........................................................13
CONCLUSION..............................................................................................................................14
REFERENCES..............................................................................................................................16
APPENDIXE:................................................................................................................................17

INTRODUCTION
Financial Analysis management and Enterprise can be related for business organisation
as investigating and evaluation of the performance of the business in terms of ratio analysis and
balance sheet evaluation thorough vertical and horizontal evaluation, This assist the comparison
of financial performance of two or more business pertaining to similar industry to determine their
over al performer and the competitive advantages they have on each other. In the present report
the financial performance of Sainsbury and Tesco is compared in fiscal terms in this the ratio
analysis in done where liquidity, profitability, efficiency and investment ratios are calculated
than both them are compared. Apart form this horizontal and vertical analysis is also done for the
balance sheet of both the organisation. In the next part of the report the working capital status
and cash flow of the both the organisation is depicted and their status in both the files is
explained.
Question 1 Presenting ratio analysis, vertical and horizontal analysis of the financial statement of
Tesco and Sainsbury for past 4 years
Ratio analysis
Ratio analysis is that tool which depicts the financial position of a company and
facilitates comparison among two of more organizations.
PROFITABILITY RATIO
Gross profit ratio
Year / companies 2015 2016 2017 2018
Sainsbury
5.08% 6.19% 6.23% 6.61%
Tesco -3.39% 5.24% 5.19% 5.83%
Net Profit ratio
Year / companies 2015 2016 2017 2018
Sainsbury
-7.00% 2.00% 1.44% 1.09%
Tesco -9.22% 0.25% -0.07% 0.02%
Interpretation:
3
⊘ This is a preview!⊘
Do you want full access?
Subscribe today to unlock all pages.

Trusted by 1+ million students worldwide

The gross profit ratio of companies defines the difference between the sales revenue and
cost of good s sold of the organization. For GP ratio of Sainsbury have shown a consistent
growth in gross earning for a period of 4 years and the table above depict growth of more than
1% in gross profits of the company (Tesco Plc, 2019). On the other hand the growth of Tesco in
Gp is immense as it had a negative profits in 2015 but in 2108 it had a gross profit of 5.83 % so
there is direct increase of 8%. So it can be stated among both organisation the performance of
Tesco is better in basis of Gp ratio.
For the net profits ratio it can be seen for Sainsbury that in 2015 it has negative profits
while in 2018 it have reached to positive with a percentage of 1.09. On the other hand for Tesco
the net profits were to low in 2015 rather it was operating under net loss of 9.22%. in 2018 the
company have reached to a profitable position with just .02% of net profits. This can be stated
that for position of both companies in 2018 is good as compared to 2015 as in this both
companies have started to earn profits though at lower rates.
LIQUIDITY RATIO
Current ratio
Year / companies 2015 2016 2017 2018
Sainsbury
0.07 0.66 0.74 0.76
Tesco 0.06 0.75 0.79 0.71
Quick ratio
Year / companies 2015 2016 2017 2018
Sainsbury
0.51 0.52 0.53 0.59
Tesco 0.44 0.61 0.68 0.6
Interpretation:
The current ratio of both the organisation for all 4 years is lower than the standard ratio
2:1, rather both the companies do not have a ratio near 1 (Tesco Plc, 2019). This means that the
liquidity position of the business is not too goods and the current assets of companies are too low
to meet their immediate financial obligations. For quick ratio it can be stated that oth
organisation of not have a standard ratio of 1:1 rather noth of hme are operting at lower level
4
Paraphrase This Document
Need a fresh take? Get an instant paraphrase of this document with our AI Paraphraser

and small increment in 4 year can be seen. This can be stated that for all 4 years both Tesco and
Sainsbury do not have shown a growth in attaining a good liquidity position.
SOLVENCY RATIO
Debt-equity ratio
Year / companies 2015 2016 2017 2018
Sainsbury
0.44 0.35 0.31 0.2
Tesco 1.49 1.23 1.45 0.67
Interpretation: The debt equity ratio depict the position of the business in the proportion
of debt regarding the equity. This can be stared that the position Sainsbury in past 4 years have
not shown a growth rather a fall can be seen from 0.4 to 0.2 this means company only have 20%
of equity over 100 %. Same is the position of Tesco which depicts that debt equity ratio have
fallen and the debt financing in capital structure have increased for Tesco.
EFFICIENCY RATIO
Inventory turnover ratio
Year / companies 2015 2016 2017 2018
Sainsbury
22.63 22.44 17.93 14.83
Tesco 21.78 19.15 22.41 23.73
Total assets turnover ratio
Year / companies 2015 2016 2017 2018
Sainsbury
1.44 1.4 1.43 1.36
Tesco 1.41 1.24 1.25 1.27
Fixed assets turnover ratio
5

Year / companies 2015 2016 2017 2018
Sainsbury
1.98 1.91 2.02 2.07
Tesco 1.93 1.78 1.88 1.87
Interpretation: Efficiency ratio can be understood as assistance In determination of efficiency
of business by the use of its different resources and generating income. A Higher value of these
ratios displays a higher efficiency level of organization and its different assets. Different
efficiency ratios such as inventory turnover ratio, fixed assets turnover ratio, and others.(Muda
and et.al., 2018). The ratios of Sainsbury show that efficiency of generating profits from
different assets held by it is keep increasing over the year.
INVESTMENT RATIOS
Earnings per share
Year / companies 2015 2016 2017 2018
Sainsbury
-0.09 0.23 0.17 0.13
Tesco -2.12 0.05 -0.01 0.44
Dividends per share
Year / companies 2015 2016 2017 2018
Sainsbury
0.1 0.12 0.12 0.1
Tesco - - - 0.03
Interpretation: The earning per share have increased for Sainsbury period of 4 years and
same is the case of Tesco, which shows the good earning level of both businesses. The dividend
per share of Sainsbury have seen ups and down to minor level only.
6
Sainsbury
1.98 1.91 2.02 2.07
Tesco 1.93 1.78 1.88 1.87
Interpretation: Efficiency ratio can be understood as assistance In determination of efficiency
of business by the use of its different resources and generating income. A Higher value of these
ratios displays a higher efficiency level of organization and its different assets. Different
efficiency ratios such as inventory turnover ratio, fixed assets turnover ratio, and others.(Muda
and et.al., 2018). The ratios of Sainsbury show that efficiency of generating profits from
different assets held by it is keep increasing over the year.
INVESTMENT RATIOS
Earnings per share
Year / companies 2015 2016 2017 2018
Sainsbury
-0.09 0.23 0.17 0.13
Tesco -2.12 0.05 -0.01 0.44
Dividends per share
Year / companies 2015 2016 2017 2018
Sainsbury
0.1 0.12 0.12 0.1
Tesco - - - 0.03
Interpretation: The earning per share have increased for Sainsbury period of 4 years and
same is the case of Tesco, which shows the good earning level of both businesses. The dividend
per share of Sainsbury have seen ups and down to minor level only.
6
⊘ This is a preview!⊘
Do you want full access?
Subscribe today to unlock all pages.

Trusted by 1+ million students worldwide

Horizontal analysis
Sainsbury: Income statement
Particulars 2015 2016
%
change
in 2016
2017 % change
in 2017 2018
%
change
in 2018
Revenue 23,775 23,506 -1.13% 26,22
4 11.56% 28,45
6 8.51%
Cost of revenue 22,567 22,050 -2.29% 24,59
0 11.52% 26,57
4 8.07%
Gross profit 1,208 1,456 20.53% 1,634 12.23% 1,882 15.18%
Total operating
expenses 1,127 749 -33.54% 992 32.44% 1,364 37.50%
Operating income 81 707 772.84% 642 -9.19% 518 -19.31%
Interest Expense 154 142 -7.79% 130 -8.45% 135 3.85%
Other income 1 26
Other expenses 17 9 -47.06%
Income before
income t... -72 548 -861.11% 503 -8.21% 409 -18.69%
Provision for
income t... 94 77 -18.09% 126 63.64% 100 -20.63%
Net income -166 471 183.73% 377 -19.96% 309 -18.04%
Interpretation: The horizontal analysis of income statement Sainsbury depicts that
overall financial performance of company' is diminishing over a time period of 4 year. In the
horizontal income statement each percentage is reducing with every passing year. Hence, it can
be seen that it is required by the management of Sainsbury to design and implement effective
strategies to control the failure of company as their financial performance at same level for long
may result in facing a critical situation.
Tesco: Income statement
Particulars 2015 2016
%
change
of 2017
2017
%
change
of 2018
2018
%
change
of 2019
Revenue 62,284 54,433 -12.61% 55,917 2.73% 57,491 2.81%
Cost of revenue 64,396 51,579 -19.90% 53,015 2.78% 54,141 2.12%
Gross profit -2,112 2,854 35.13% 2,902 1.68% 3,350 15.44%
Total operating
expenses 2,695 1,874 -30.46% 1,734 -7.47% 1,786 3.00%
Interest Expense 499 498 -0.20% 517 3.82% 431 -16.63%
7
Paraphrase This Document
Need a fresh take? Get an instant paraphrase of this document with our AI Paraphraser

Other expenses 1070 320 -70.09% 506 58.13% 0
-
100.00
%
Net income -5,741 138 97.60% -40
-
128.99
%
1,206 3115.00
%
Interpretation: The horizontal income statement of Tesco plc states that performance of
company regarding earning income have shown an improvement in 4 years. The income
statement depicts the fact that directors and manager of the company have designed and
formulated the strategies to reach at a good financial position of the company.
Sainsbury: Balance sheet
Particulars 2015 2016
%
change
in 2016
2017 % change
in 2017 2018
%
change
in 2018
Assets
Total current
assets 4,505 4,444 -1.35% 6,322 42.26% 7,866 24.42%
Total non-current
assets. 12,032 12,529 4.13% 13,415 7.10% 14,135 5.37%
Total assets 16,537 16,973 2.64% 19,737 16.30% 22,001 11.47%
Liabilities and
stockholders
equity
Total current
liabilities 6,923 6,724 -2.87% 8,573 27.50% 10,302 20.20%
Total non-current
liabilities 4,075 3,884 -4.69% 4,292 10.50% 4,288 -0.09%
8
-
100.00
%
Net income -5,741 138 97.60% -40
-
128.99
%
1,206 3115.00
%
Interpretation: The horizontal income statement of Tesco plc states that performance of
company regarding earning income have shown an improvement in 4 years. The income
statement depicts the fact that directors and manager of the company have designed and
formulated the strategies to reach at a good financial position of the company.
Sainsbury: Balance sheet
Particulars 2015 2016
%
change
in 2016
2017 % change
in 2017 2018
%
change
in 2018
Assets
Total current
assets 4,505 4,444 -1.35% 6,322 42.26% 7,866 24.42%
Total non-current
assets. 12,032 12,529 4.13% 13,415 7.10% 14,135 5.37%
Total assets 16,537 16,973 2.64% 19,737 16.30% 22,001 11.47%
Liabilities and
stockholders
equity
Total current
liabilities 6,923 6,724 -2.87% 8,573 27.50% 10,302 20.20%
Total non-current
liabilities 4,075 3,884 -4.69% 4,292 10.50% 4,288 -0.09%
8

Total liabilities 10,998 10,608 -3.55% 12,865 21.30% 14,590 13.41%
Total stockholders'
equity
5,539
6,365 14.91% 6,872 8.00% 7,411 7.84%
Total liabilities
and stakeholders
equity
16,537 16,973 2.64% 19,737 16.30% 22,001 11.47%
Interpretation: Sainsbury's horizontal balance sheet depicts that financial performance of
company have reduced in 4 years. With the above analysis financial position this is seen that that
financial position company in not good at the fall is going with a faster pace so immediate
control is required.
Tesco: Balance sheet
2015 2016
%
change
in 2016
2017
%
change
in 2017
2018
%
change
in 2018
Assets
Total current
assets 11,958 14,828 24.0% 15,417 4.00% 13,726 -11.00%
Total non-
current asse... 32,256 29,076 -9.9% 30,436 4.70% 31,136 2.30%
Total assets 44,214 43,904 -0.7% 45,853 4.40% 44,862 -2.20%
Total current
liabilit... 19,810 19,714 -0.5% 19,405 -1.60% 19,238 -0.90%
9
⊘ This is a preview!⊘
Do you want full access?
Subscribe today to unlock all pages.

Trusted by 1+ million students worldwide

Total non-
current liab... 17,333 15,564 -10.2% 20,010 28.60% 15,144 -24.30%
Total
liabilities 37,143 35,278 -5.0% 39,415 11.70% 34,382 -12.80%
Total
stockholders'
equity
7,071 8,626 22.0% 6,438 -25.40% 10,480 62.80%
Total
liabilities and
stakeholders
equity
44,214 43,904 -0.7% 45,853 4.40% 44,862 -2.20%
Interpretation: The horizontal statement of the company Tesco shows that financial
position reduced of company in the year 2018 is better as compare to 2017. With effective
implementation of strategies of directions and managers company have made a growth in the
recent years and gained a good financial position with starting to generate profits from the
business.
Vertical Analysis:
Income statement:
Sainsbury:
10
Paraphrase This Document
Need a fresh take? Get an instant paraphrase of this document with our AI Paraphraser

Interpretation: There is growth in the gross profits for the Business in a time frame of 4
years but the net profits of the company have not been so good. But it can be stated that over
performance of company is satisfactory and it have reach to profitable position from loss making
position.
Tesco
Interpretation: The gross Profit percentage of company have increased and this can
directly be linked to the control of the cost of product of the goods by the company. For the net
profits company have came far form making loss to getting at a profit making position.
11

Balance sheet
Sainsbury:
Interpretation: The financial position of the company shows good growth there is an increment
in current asset and shear holder equity but with rise in the current liabilities the liquidity
position of the company remains at same level with minor changes.
12
Sainsbury:
Interpretation: The financial position of the company shows good growth there is an increment
in current asset and shear holder equity but with rise in the current liabilities the liquidity
position of the company remains at same level with minor changes.
12
⊘ This is a preview!⊘
Do you want full access?
Subscribe today to unlock all pages.

Trusted by 1+ million students worldwide
1 out of 25
Related Documents

Your All-in-One AI-Powered Toolkit for Academic Success.
 +13062052269
info@desklib.com
Available 24*7 on WhatsApp / Email
Unlock your academic potential
Copyright © 2020–2025 A2Z Services. All Rights Reserved. Developed and managed by ZUCOL.