Managerial Finance Portfolio: Tesco & Sainsbury Analysis

Verified

Added on  2022/12/30

|25
|4015
|53
Report
AI Summary
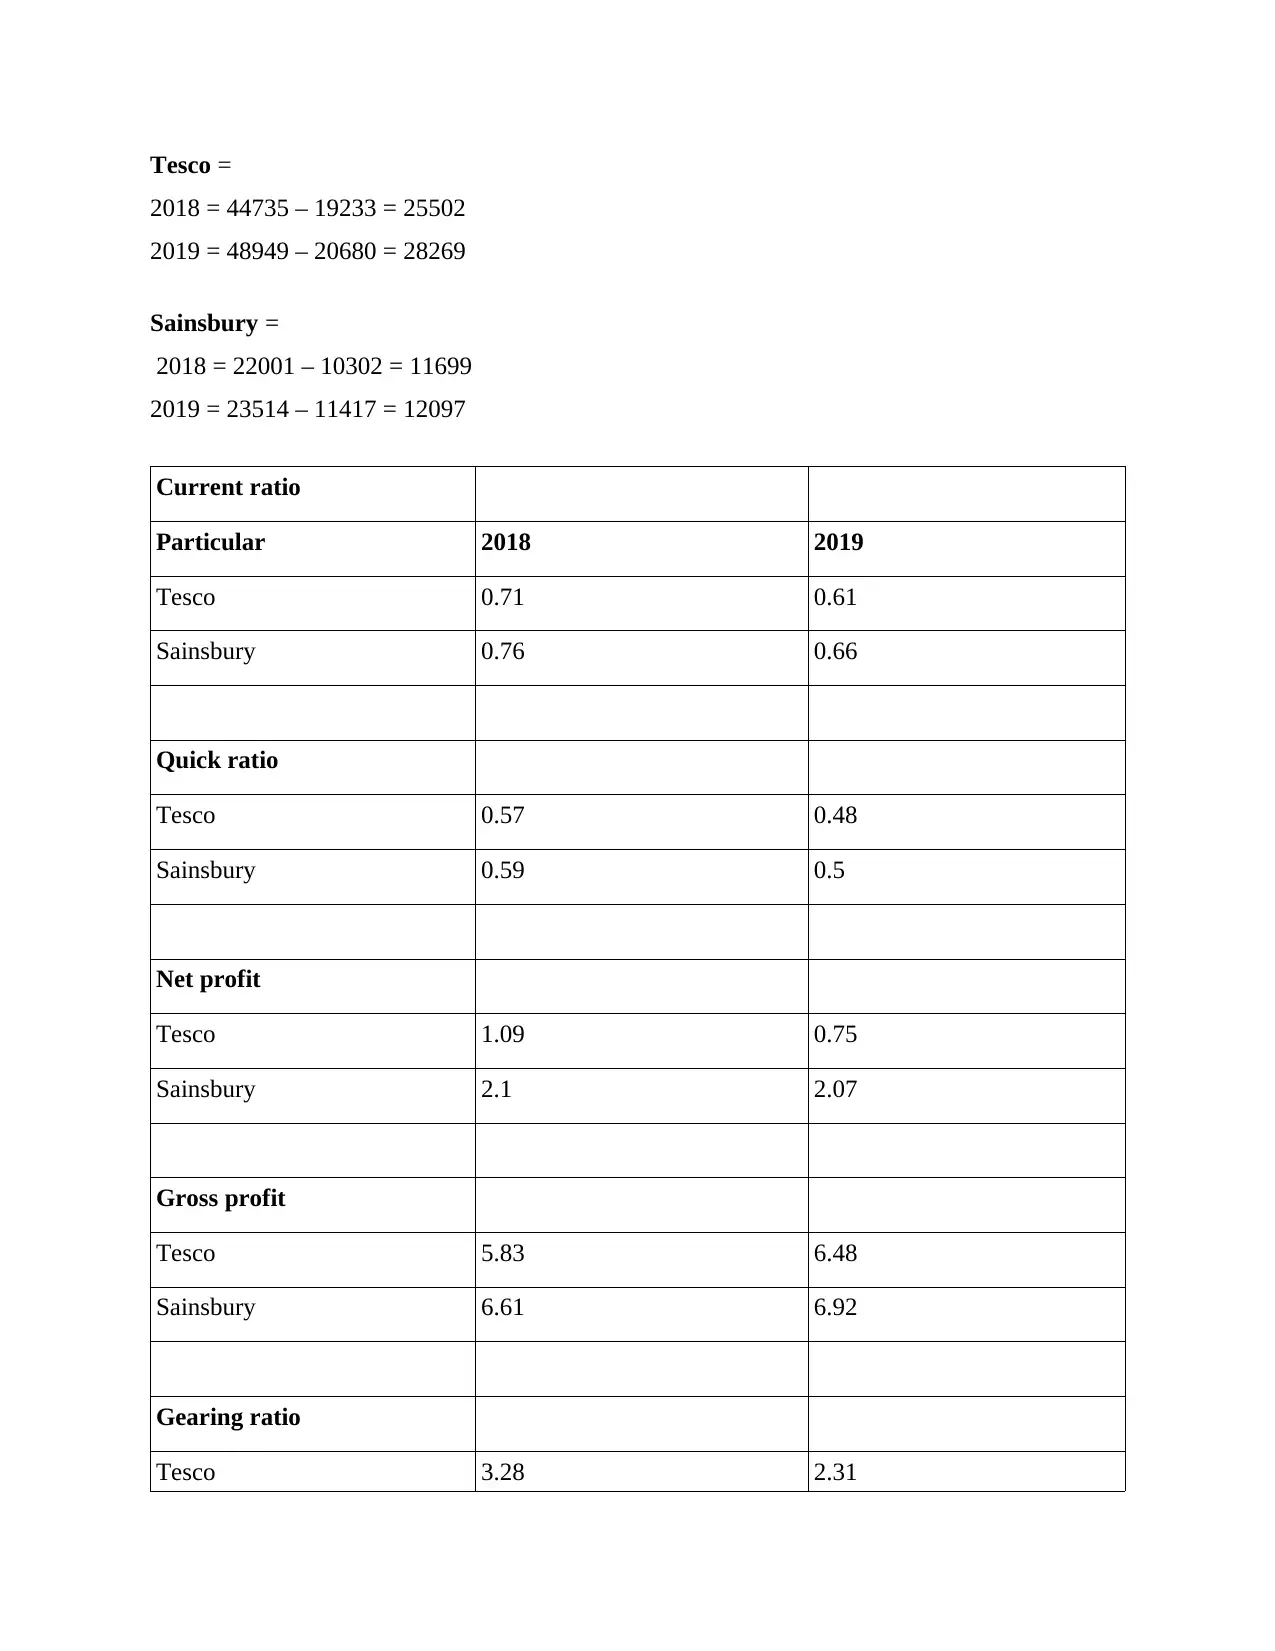
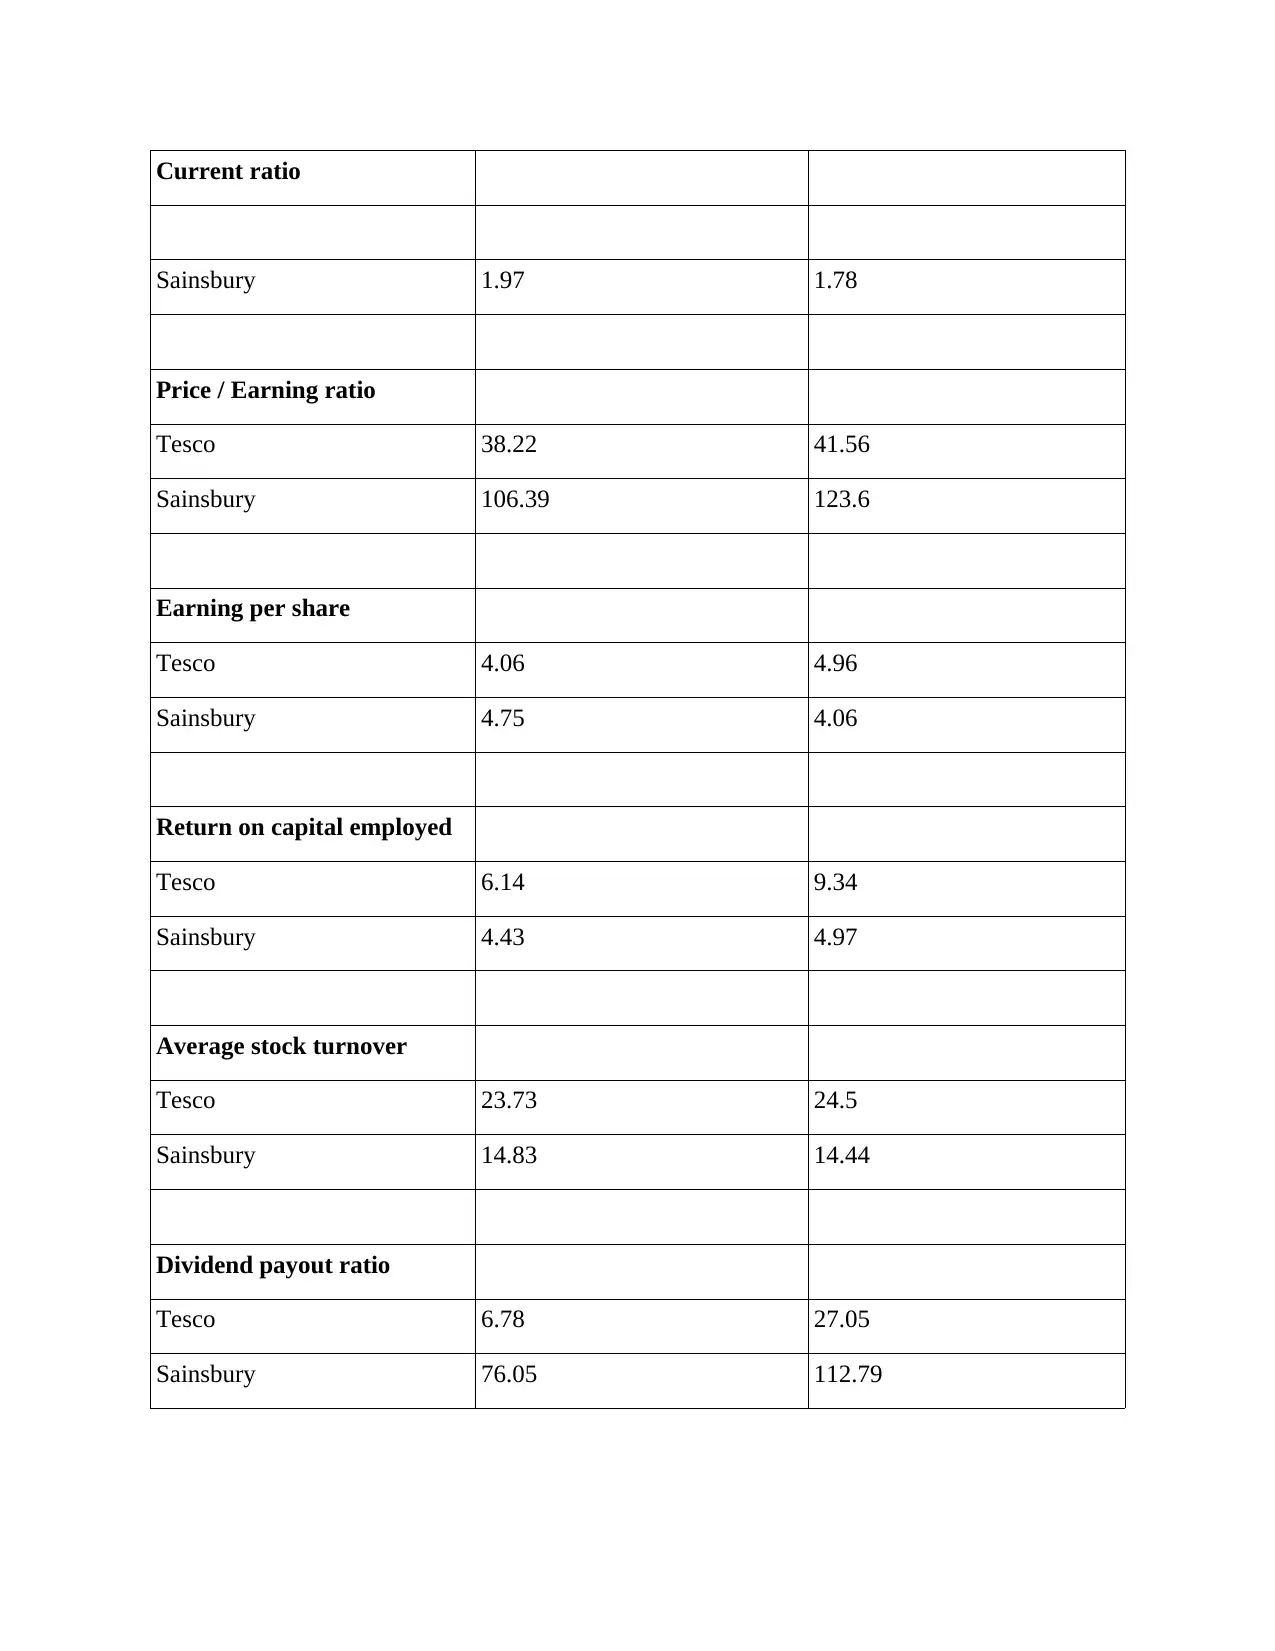
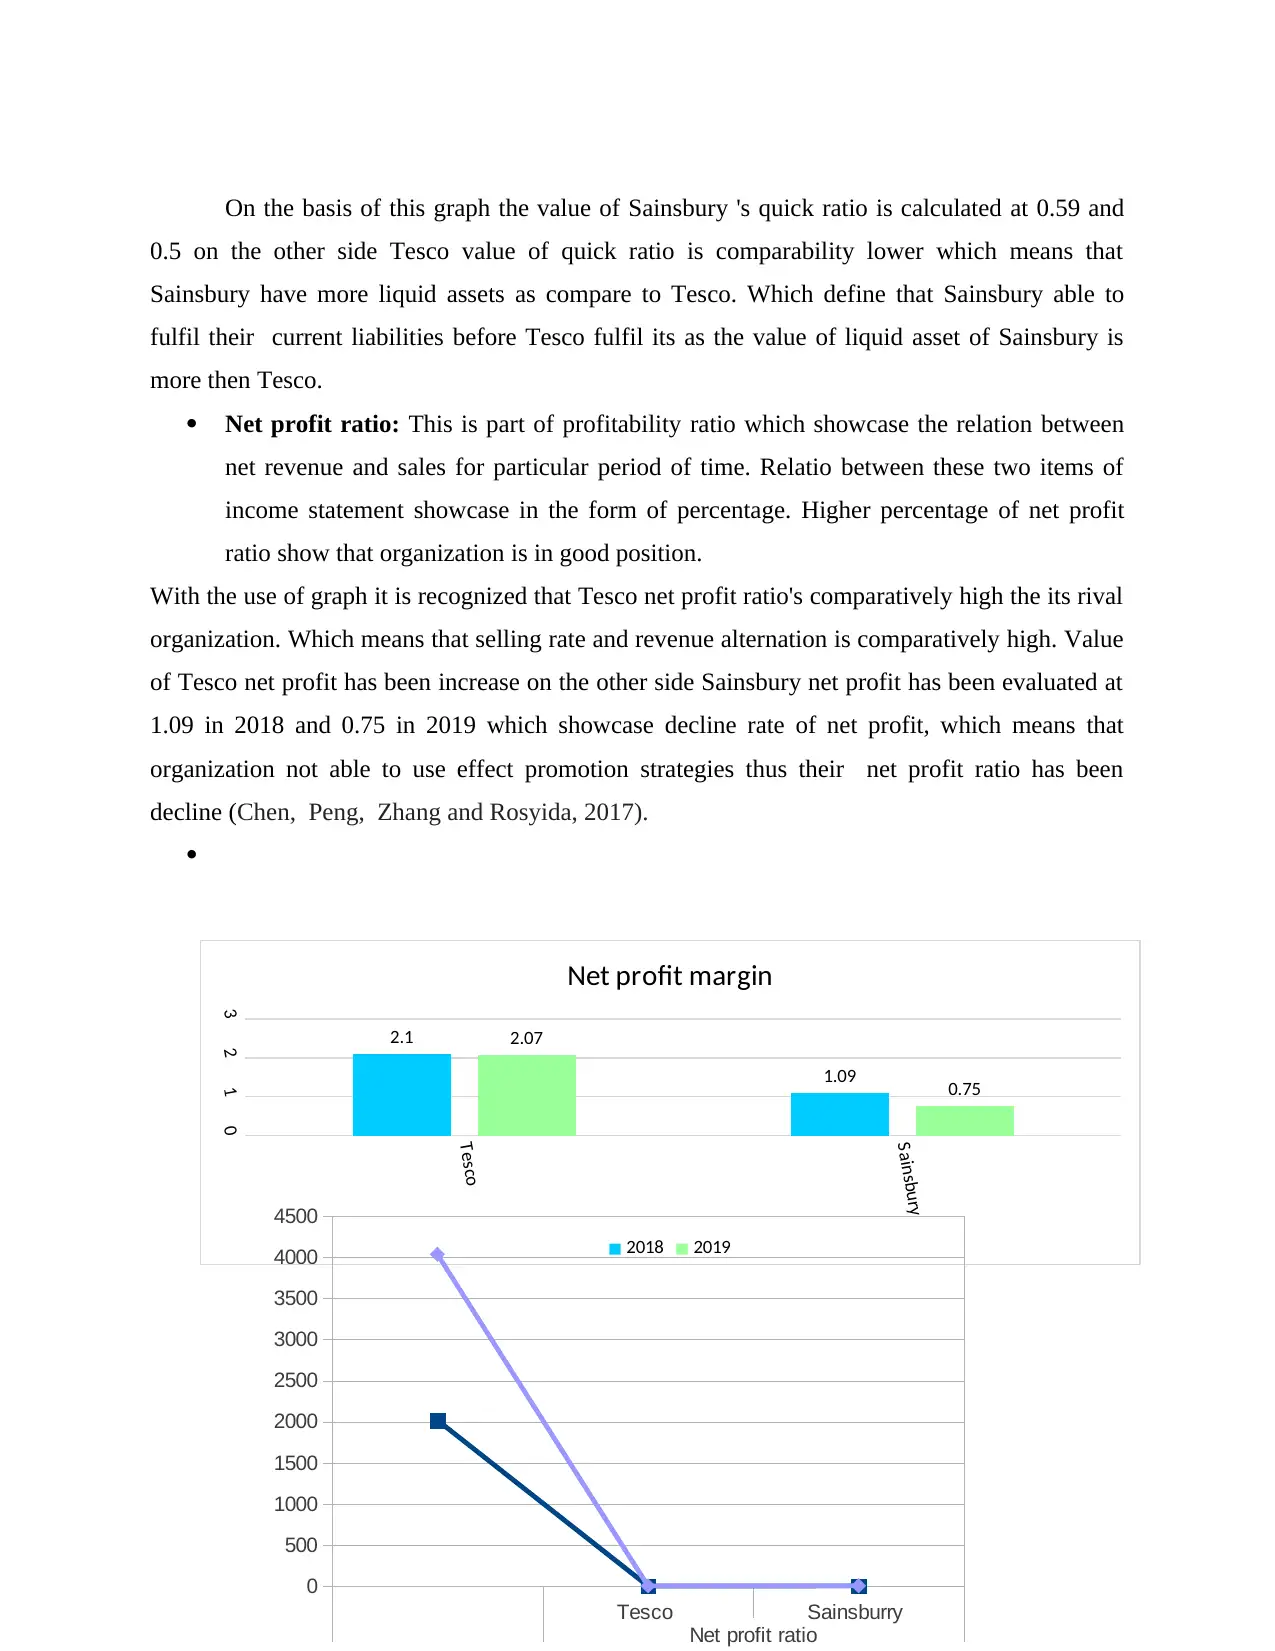
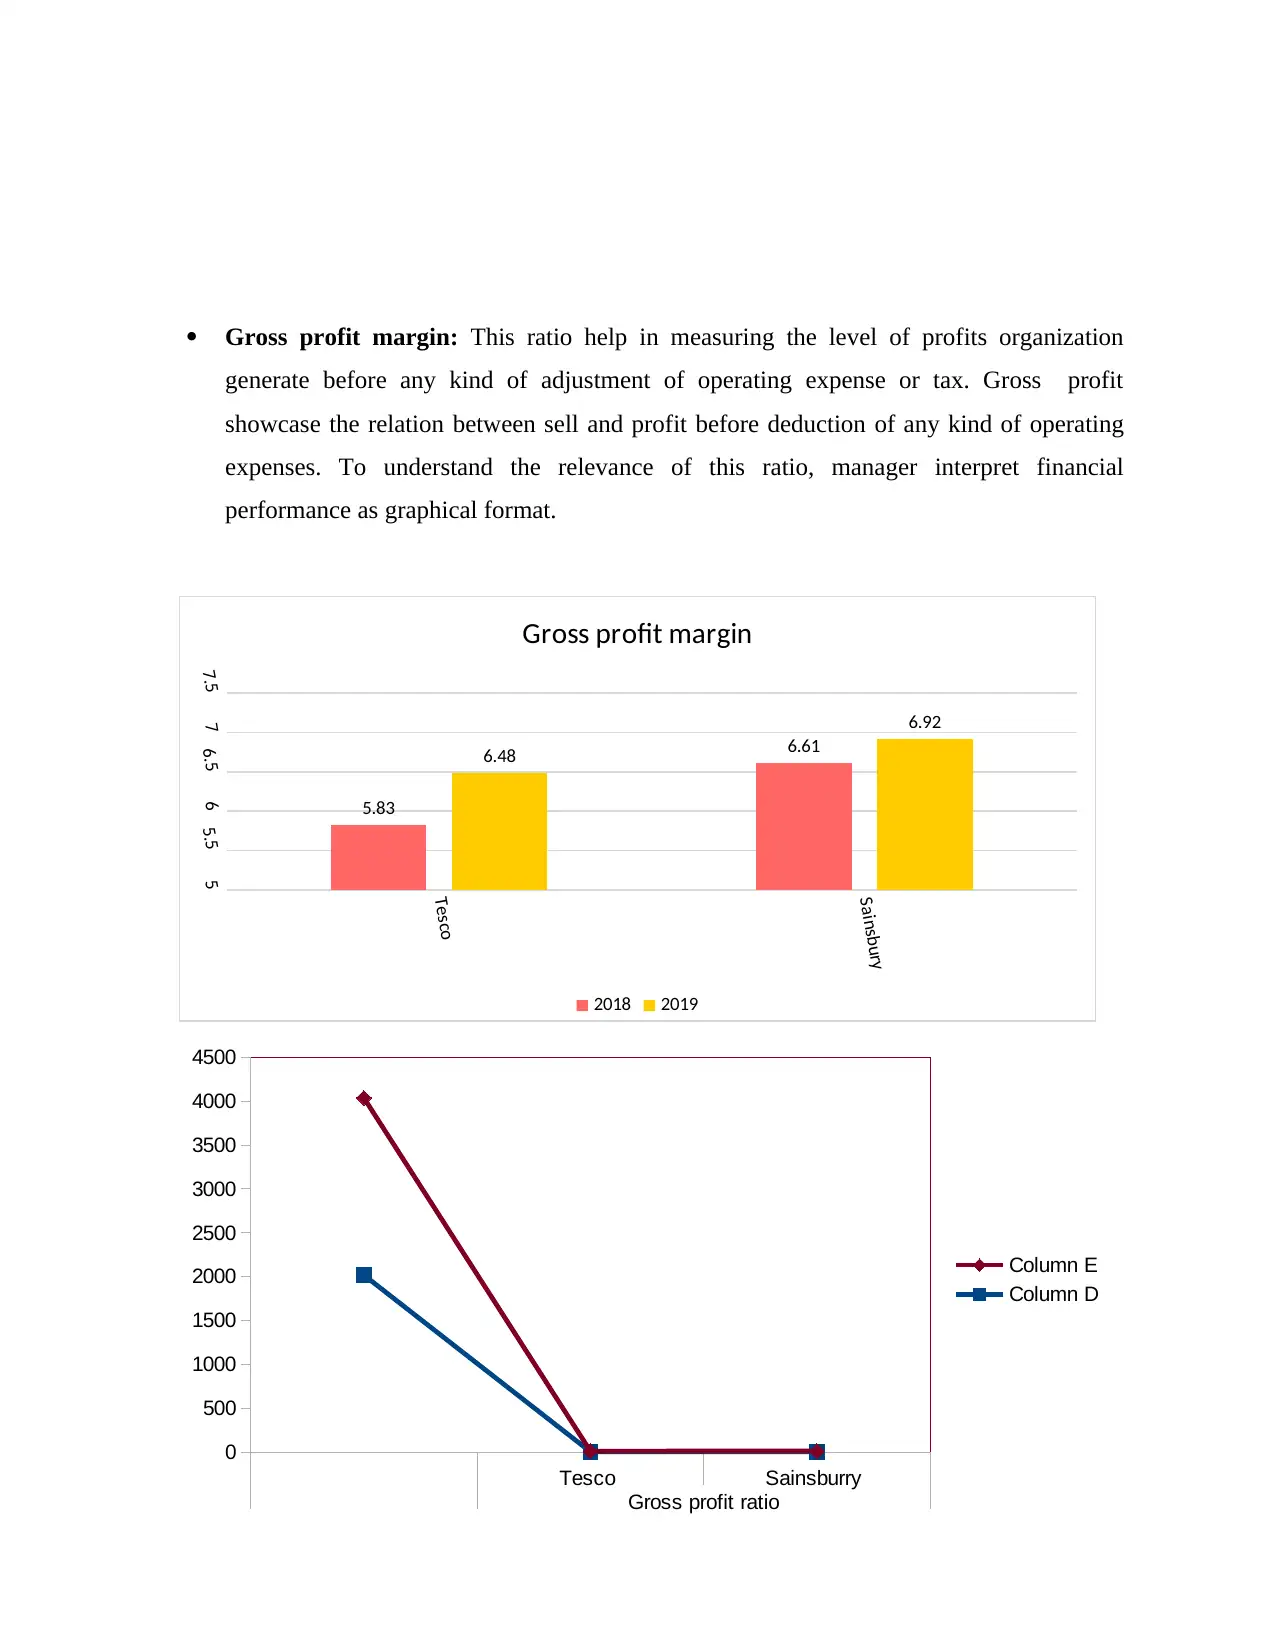
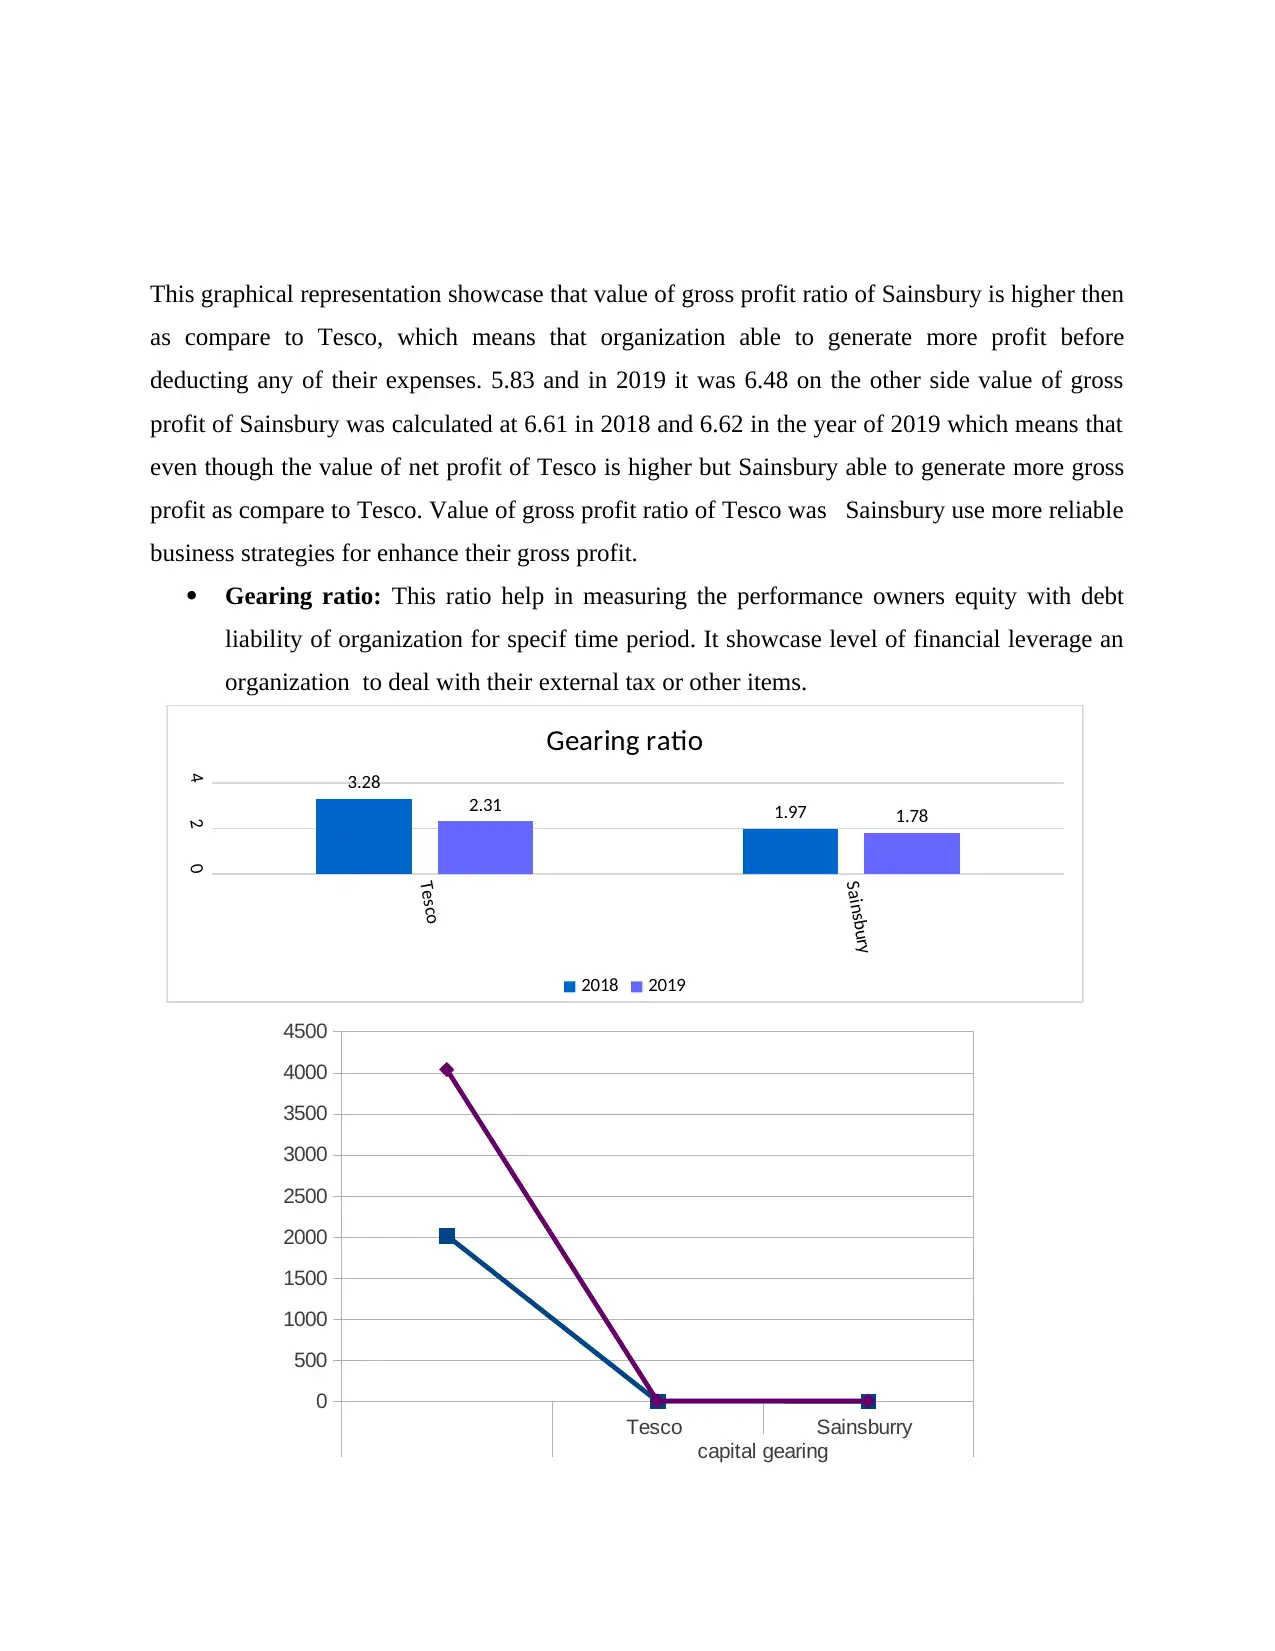
This managerial finance portfolio presents a comprehensive analysis of Tesco and Sainsbury's financial performance. The report begins with an introduction to managerial finance and divides the analysis into two portfolios. Portfolio 1 focuses on financial ratio analysis, including current ratio, quick ratio, profitability ratios, gearing ratio, and price-earnings ratio, comparing Tesco and Sainsbury. It assesses their financial position and performance, identifies potential causes of poor performance, and discusses limitations of financial ratios. Portfolio 2 delves into capital investment appraisal methods and their limitations, crucial for managerial decision-making. The analysis includes graphical representations to aid understanding and provides a detailed comparison of the two companies' financial health and investment strategies. The report concludes with a summary of findings and references to support the analysis.
Document Page
MANAGERIAL FINANCE
PORTFOLIO
tabler-icon-diamond-filled.svg

Paraphrase This Document

Need a fresh take? Get an instant paraphrase of this document with our AI Paraphraser
Document Page
Table of Contents
INTRODUCTION...........................................................................................................................3
PORTFOLIO 1.................................................................................................................................3
a) Computation of financial ratio of Tesco & Sainsbury.............................................................3
b) Assessment of financial performance, investment portfolio and financial position of
company.......................................................................................................................................7
c) Recommendation regarding with main cause of poor performance of business entity.........10
d) Limitation of financial ratio...................................................................................................10
PORTFOLIO 2...............................................................................................................................11
a)Calculation of capital investment appraisal method...............................................................11
b)Limitations of investment appraisal techniques.....................................................................13
CONCLUSION..............................................................................................................................14
REFERENCES..............................................................................................................................15
INTRODUCTION...........................................................................................................................1
Document Page
INTRODUCTION
Managerial finance this term define as the tool of managerial application of finance. The
main purpose of using his tool for take decision and run financial business activities in effective
manner. To understand managerial finance, this report has been formulated. It divide into two
portfolio, the first one describe us of ratio for measuring performance of Tesco and its rival
organization Sainsbury. It also describe limitation of ratio analysing and reason of poor
performance of particular business organization. The second portfolio describe how manager
took decision for their future business project by using investment appraisal technique and its
limitation. All these information has been describe in systematic manner.
PORTFOLIO 1
a) Computation of financial ratio of Tesco & Sainsbury.
Ratio: In mathematical terms ratio is the tool of understanding the relation between two
items. In terms of finance, ratio analysis a tool use to measure or compare items of two lines.
Ratio analysis useful to identify the position of organization for particular time period. Most of
business corporation use this tool to recognize or measure their performance with their rival
industries (Alderighi, Cleary and Varanasi, 2019).
Tesco & Sainsbury both run their business in merchandise retail sector. They are
multinational organization which represent UK at international level and help in contributes
towards their rate of GDP. Both are rival industries, by using ration analysis manager could
found which one is beneficial for investment purpose and gives future portfolio profits.
Following are some example of ratio which help in analysing,
Current ratio = Current asset / Current liabilities
Tesco = 2018 = 13600/ 19233 = 0.71
2019 = 1250 / 20980 = 0.61
Sainsbury
2018 = 7857 / 10302 = 0.76
2019 = 7581 / 11417 = 0.66
Quick ratio
Quick assets/ Current liabilities
Tesco
2018 = 11336/ 19233 = 0.57
Document Page
2019 =9953/ 20680 = 0.48
Sainsbury
2018 = 6047/ 10302 = 0.59
2019 =5652/11417 = 0.50
Net profit
Tesco
2018 = 309/ 28456 = 1.09
2019 =219/ 29007 = 0.75
Sainsbury
2018 = 1210/ 57493 = 2.10
2019 = 1320/ 63911 = 2.07
Gross profit
Tesco
2018 = 3352/ 57493 = 5.83
2019 = 4144/ 63911 = 6.48
Sainsbury
2018 = 1882/28456= 6.61
2019 =2007/ 29007 = 6.92
Gearing ratio
Tesco
2018 = 34404/ 10480 = 3.28
2019 =34213 / 14834 = 2.31
Sainsbury
2018 = 14590/ 7411 = 1.97
2019 =15085/ 8456 = 1.78
Price / Earning ratio
Tesco
2018 = 189.55/4.96 = 38.22
2019 = 255.2/ 6.14 = 41.56
Sainsbury
2018 = 264.9/ 2.49 =106.39
tabler-icon-diamond-filled.svg

Paraphrase This Document

Need a fresh take? Get an instant paraphrase of this document with our AI Paraphraser
Document Page
2019 = 229.9 / 1.86 = 123.60
Earning per share
Tesco
2018 = 1210/ 244 = 4.96
2019 = 1320/ 215 = 6.14
Sainsbury
2018 = 309/ 65 = 4.75
2019 = 219/ 54 = 4.06
Return on capital employed
Tesco
2018 = 1566 / 25502 = 6.14
2019 = 2639 / 28269 = 9.34
Sainsbury
2018 = 518/ 11699 = 4.43
2019 = 601/ 12097 = 4.97
Average stock turnover
Tesco
2018 = 54141/ 2282 = 23.73
2019 = 59769/ 2440 = 24.50
Sainsbury
2018 = 26574/ 1792.5 = 14.83
2019 = 27000/ 1869.5 = 14.44
Dividend payout ratio
Tesco
2018 = 82/ 1210 = 6.78
2019 = 357/ 1320 = 27.05
Sainsbury
2018 = 235 / 309 = 76.05
2019 = 247/ 219 = 112.79
Capital employed = Total assets- Total current liabilities
Document Page
Tesco =
2018 = 44735 – 19233 = 25502
2019 = 48949 – 20680 = 28269
Sainsbury =
2018 = 22001 – 10302 = 11699
2019 = 23514 – 11417 = 12097
Current ratio
Particular 2018 2019
Tesco 0.71 0.61
Sainsbury 0.76 0.66
Quick ratio
Tesco 0.57 0.48
Sainsbury 0.59 0.5
Net profit
Tesco 1.09 0.75
Sainsbury 2.1 2.07
Gross profit
Tesco 5.83 6.48
Sainsbury 6.61 6.92
Gearing ratio
Tesco 3.28 2.31
Document Page
Current ratio
Sainsbury 1.97 1.78
Price / Earning ratio
Tesco 38.22 41.56
Sainsbury 106.39 123.6
Earning per share
Tesco 4.06 4.96
Sainsbury 4.75 4.06
Return on capital employed
Tesco 6.14 9.34
Sainsbury 4.43 4.97
Average stock turnover
Tesco 23.73 24.5
Sainsbury 14.83 14.44
Dividend payout ratio
Tesco 6.78 27.05
Sainsbury 76.05 112.79
tabler-icon-diamond-filled.svg

Paraphrase This Document

Need a fresh take? Get an instant paraphrase of this document with our AI Paraphraser
Document Page
b) Assessment of financial performance, investment portfolio and financial position of company.
Current ratio: This ratio is a part of liquidity ratio through which manager could easily
recognize whether organization is able to meet their obligation for short time period or
not. For this availability of current asset and value of current liabilities are measure.
There will be ideal ratio of 2:1 which must an organization have. Higher current ratio
showcase sufficient level of liquid position organization have to fulfil their short term
debt liabilities. To understand the relevance of ratio analysis, value of these ratio put in
graphical formate which attractive and easy to understand (Bhuiyan, Rahman, Saiti and
Ghani, 2019).
Tesco Sainsburry
Current
0
500
1000
1500
2000
2500
3000
3500
4000
4500
Column E
Column D
Document Page
On the basis of formulation of graph it analysis that value of current ratio of Sainsbury in
both years, is higher then as compare to Tesco, even the ratio decline in both companies but for
comparison purpose Sainsbury is strong liquid position. Which means working capital is in good
position of Sainsbury.
Quick ratio: This ratio is also part of liquidity ratio, which showcase or represent real
potion of liquid asset an organization have to fulfil their debt liabilities. The main
purpose of calculating this ration is to identify whether business entities have sufficient
pure liquid assets or cash valance to run their business or not. To evaluate value of
liquidity manager use graphical representation.
Tesco
Sainsbury
00.20.40.60.8
0.59 0.59
0.48 0.5
Quick Ratio
2018 2019
Tesco Sainsburry
Liquid
0
500
1000
1500
2000
2500
3000
3500
4000
4500
Document Page
On the basis of this graph the value of Sainsbury 's quick ratio is calculated at 0.59 and
0.5 on the other side Tesco value of quick ratio is comparability lower which means that
Sainsbury have more liquid assets as compare to Tesco. Which define that Sainsbury able to
fulfil their current liabilities before Tesco fulfil its as the value of liquid asset of Sainsbury is
more then Tesco.
Net profit ratio: This is part of profitability ratio which showcase the relation between
net revenue and sales for particular period of time. Relatio between these two items of
income statement showcase in the form of percentage. Higher percentage of net profit
ratio show that organization is in good position.
With the use of graph it is recognized that Tesco net profit ratio's comparatively high the its rival
organization. Which means that selling rate and revenue alternation is comparatively high. Value
of Tesco net profit has been increase on the other side Sainsbury net profit has been evaluated at
1.09 in 2018 and 0.75 in 2019 which showcase decline rate of net profit, which means that
organization not able to use effect promotion strategies thus their net profit ratio has been
decline (Chen, Peng, Zhang and Rosyida, 2017).

Tesco
Sainsbury
0123
2.1
1.09
2.07
0.75
Net profit margin
2018 2019
Tesco Sainsburry
Net profit ratio
0
500
1000
1500
2000
2500
3000
3500
4000
4500
tabler-icon-diamond-filled.svg

Paraphrase This Document

Need a fresh take? Get an instant paraphrase of this document with our AI Paraphraser
Document Page
Gross profit margin: This ratio help in measuring the level of profits organization
generate before any kind of adjustment of operating expense or tax. Gross profit
showcase the relation between sell and profit before deduction of any kind of operating
expenses. To understand the relevance of this ratio, manager interpret financial
performance as graphical format.
Tesco Sainsburry
Gross profit ratio
0
500
1000
1500
2000
2500
3000
3500
4000
4500
Column E
Column D
Tesco
Sainsbury
55.566.577.5
5.83
6.61
6.48
6.92
Gross profit margin
2018 2019
Document Page
This graphical representation showcase that value of gross profit ratio of Sainsbury is higher then
as compare to Tesco, which means that organization able to generate more profit before
deducting any of their expenses. 5.83 and in 2019 it was 6.48 on the other side value of gross
profit of Sainsbury was calculated at 6.61 in 2018 and 6.62 in the year of 2019 which means that
even though the value of net profit of Tesco is higher but Sainsbury able to generate more gross
profit as compare to Tesco. Value of gross profit ratio of Tesco was Sainsbury use more reliable
business strategies for enhance their gross profit.
Gearing ratio: This ratio help in measuring the performance owners equity with debt
liability of organization for specif time period. It showcase level of financial leverage an
organization to deal with their external tax or other items.
Tesco
Sainsbury
024 3.28
1.972.31 1.78
Gearing ratio
2018 2019
Tesco Sainsburry
capital gearing
0
500
1000
1500
2000
2500
3000
3500
4000
4500
chevron_up_icon
1 out of 25
circle_padding
hide_on_mobile
zoom_out_icon
[object Object]