Financial Analysis Report: Comparing Volkswagen and BMW Financials
VerifiedAdded on 2019/12/03
|20
|4239
|152
Report
AI Summary
This report presents a comprehensive financial statement analysis comparing the performance of Volkswagen and BMW. It begins with an overview of Volkswagen, a major player in the automotive industry, and then delves into the core of the analysis: ratio analysis. The report examines profitability ratios (gross profit, operating profit, and net profit), liquidity ratios (current ratio and quick ratio), activity ratios (total assets turnover and inventory turnover), and solvency ratios to assess the financial health and efficiency of both companies from 2012 to 2014. The analysis includes tables with calculated ratios and comparative discussions, highlighting trends and differences in their financial performance. The report also considers the impact of external factors on the financial outcomes of both companies, providing a well-rounded view of their financial positions and strategic approaches. The conclusion summarizes the key findings, emphasizing areas of strength and weakness for each company, and the references provide the sources used for the analysis.

Financial statement analysis
Paraphrase This Document
Need a fresh take? Get an instant paraphrase of this document with our AI Paraphraser
TABLE OF CONTENTS
INTRODUCTION...........................................................................................................................3
Overview of organization................................................................................................................3
APPROACHES TO ANALYZE AND INTERPRETE FINANCIAL STATEMENTS.................3
INTERNAL AND EXTERNAL FACTORS WHICH BRING CHANGE IN THE RATIOS......13
CONCLUSION .............................................................................................................................15
REFERENCES..............................................................................................................................17
2
Index of Tables
Table 1: Profitability ratio of Volkswagen......................................................................................5
Table 2: Profitability ratio of BMW................................................................................................6
Table 3: Liquidity ratio of Volkswagen.........................................................................................10
Table 4: Liquidity ratio of BMW...................................................................................................10
Table 5: Table 5: Activity ratio of Volkswagen............................................................................12
Table 6: Activity ratio of BMW.....................................................................................................12
Table 7: Table 7: Solvency ratio of Volkswagen...........................................................................14
Table 8: Solvency ratio of BMW...................................................................................................15
3
⊘ This is a preview!⊘
Do you want full access?
Subscribe today to unlock all pages.
Trusted by 1+ million students worldwide
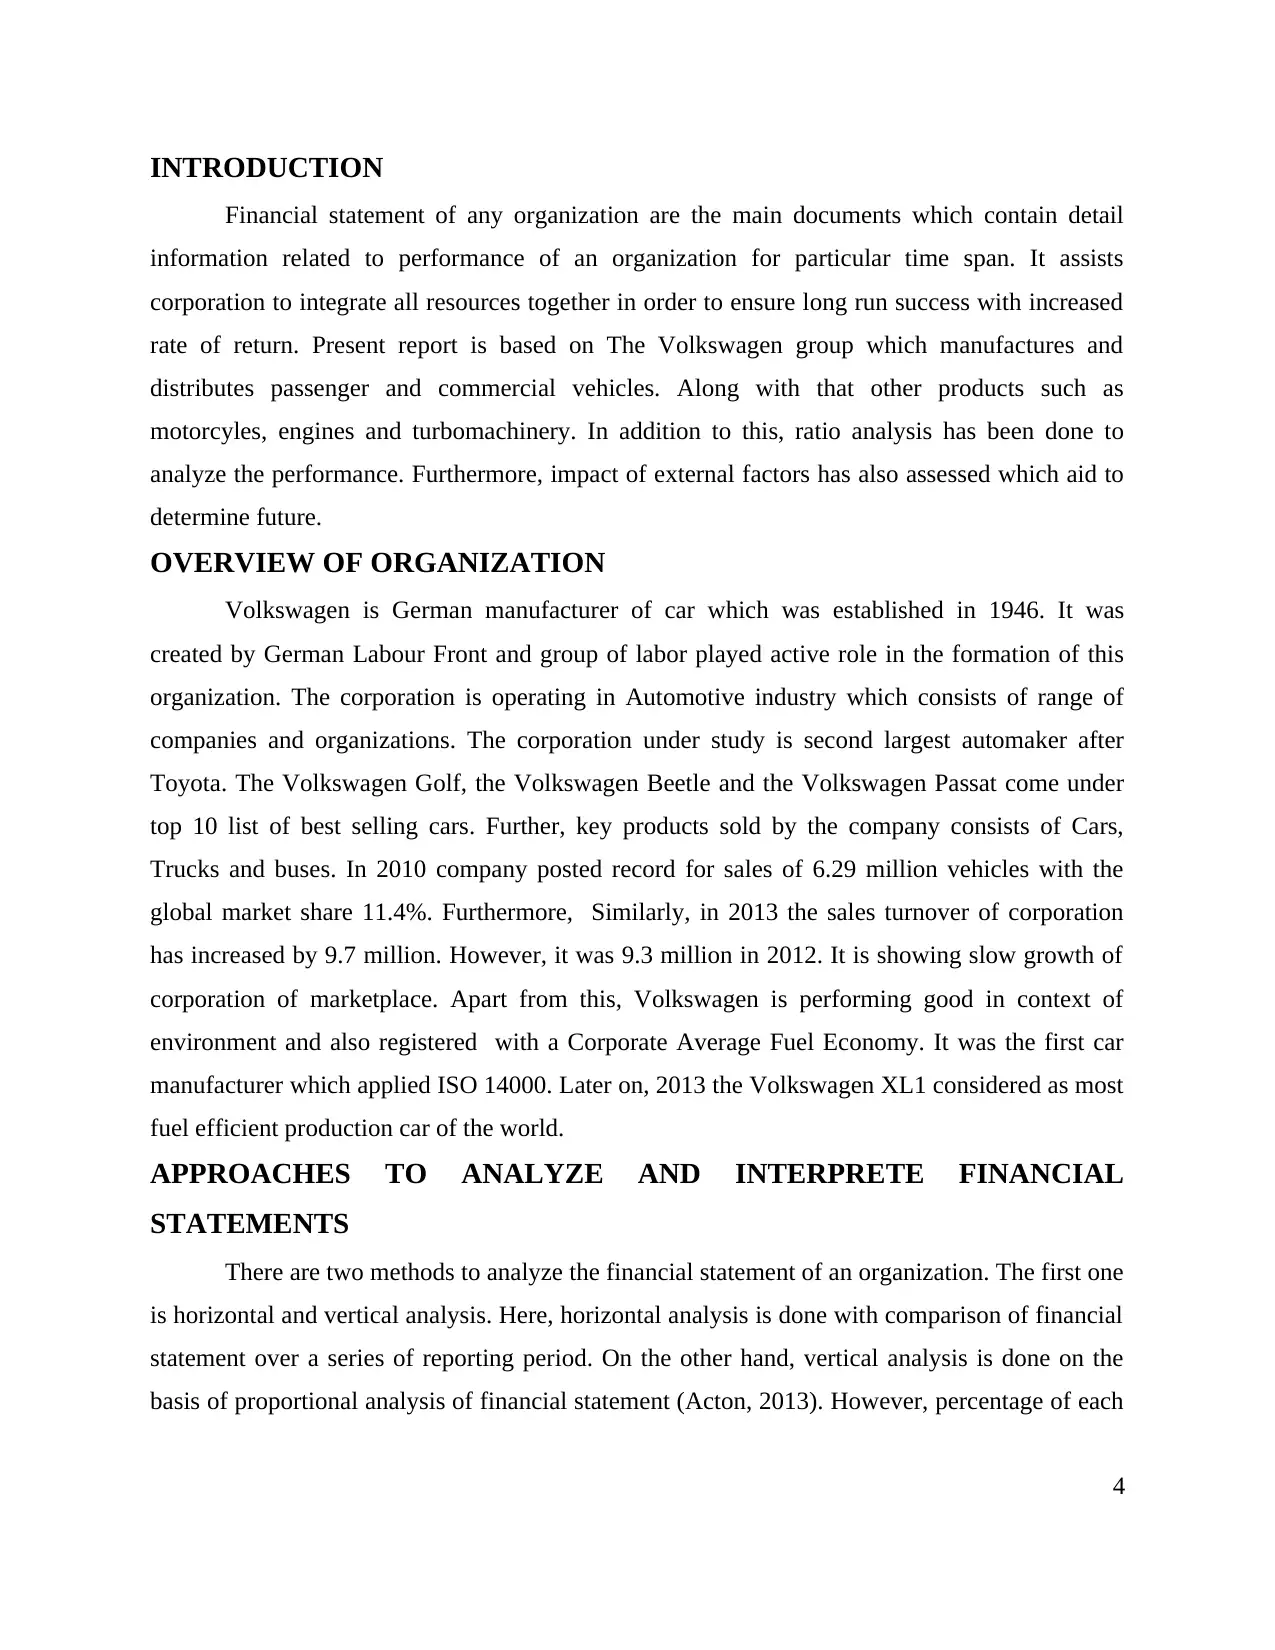
INTRODUCTION
Financial statement of any organization are the main documents which contain detail
information related to performance of an organization for particular time span. It assists
corporation to integrate all resources together in order to ensure long run success with increased
rate of return. Present report is based on The Volkswagen group which manufactures and
distributes passenger and commercial vehicles. Along with that other products such as
motorcyles, engines and turbomachinery. In addition to this, ratio analysis has been done to
analyze the performance. Furthermore, impact of external factors has also assessed which aid to
determine future.
OVERVIEW OF ORGANIZATION
Volkswagen is German manufacturer of car which was established in 1946. It was
created by German Labour Front and group of labor played active role in the formation of this
organization. The corporation is operating in Automotive industry which consists of range of
companies and organizations. The corporation under study is second largest automaker after
Toyota. The Volkswagen Golf, the Volkswagen Beetle and the Volkswagen Passat come under
top 10 list of best selling cars. Further, key products sold by the company consists of Cars,
Trucks and buses. In 2010 company posted record for sales of 6.29 million vehicles with the
global market share 11.4%. Furthermore, Similarly, in 2013 the sales turnover of corporation
has increased by 9.7 million. However, it was 9.3 million in 2012. It is showing slow growth of
corporation of marketplace. Apart from this, Volkswagen is performing good in context of
environment and also registered with a Corporate Average Fuel Economy. It was the first car
manufacturer which applied ISO 14000. Later on, 2013 the Volkswagen XL1 considered as most
fuel efficient production car of the world.
APPROACHES TO ANALYZE AND INTERPRETE FINANCIAL
STATEMENTS
There are two methods to analyze the financial statement of an organization. The first one
is horizontal and vertical analysis. Here, horizontal analysis is done with comparison of financial
statement over a series of reporting period. On the other hand, vertical analysis is done on the
basis of proportional analysis of financial statement (Acton, 2013). However, percentage of each
4
Paraphrase This Document
Need a fresh take? Get an instant paraphrase of this document with our AI Paraphraser
items is calculated according to total assets and accordingly financial statements are analyzed.
The foremost approach to analysis the financial statement is ratio analysis. This help to calculate
ratio of all figures and accordingly provide the detail information to organization with regards to
liquidity, productivity and profitability (Elearn, 2013). Ratio analysis of organization has been
done as follows-
Ratio analysis of Volkswagen and BMW
Ratio analysis is the effective means to measure the performance of company for
particular time span. It assists investors to take right decision for investment project.
Furthermore, Volkswagen performance is compared with BMW which is operating in the same
industry and serve as the competitors of firm. With the help of ratio analysis company is judged
on specific parameter like liquidity, solvency and efficiency as well as profitability. However, it
provides only quantitative measure (Healy and Palepu, 2007). There are several other means
such as contribution of firm towards social activities, employee welfare and expansion as well as
creation of goodwill serve major factors through which qualitative analysis can be done. Also,
brand image of firm is also the main factors through which number of customer's are increased
towards offering of company. In addition to this, qualitative analysis is done with the help of
assessing annual report of corporation so as to get fruitful outcomes for the performance of the
corporation under study (Kierulff and Petersen, 2009).
It is very important to analyze the performance of company with its competitor. It assists
management to bring improvement in the current position of the firm by focusing on several
factors. These factors can be related to cost of production, additional expense and other strategies
which might have been used by competitors in order to retain customers for longer time span.
Profitability ratio
Table 1: Profitability ratio of Volkswagen
Ratios Formula 2014 (€m) 2013 (€m) 2012 (€m)
Profitability ratios
Gross profit 36524 35600 35154
5
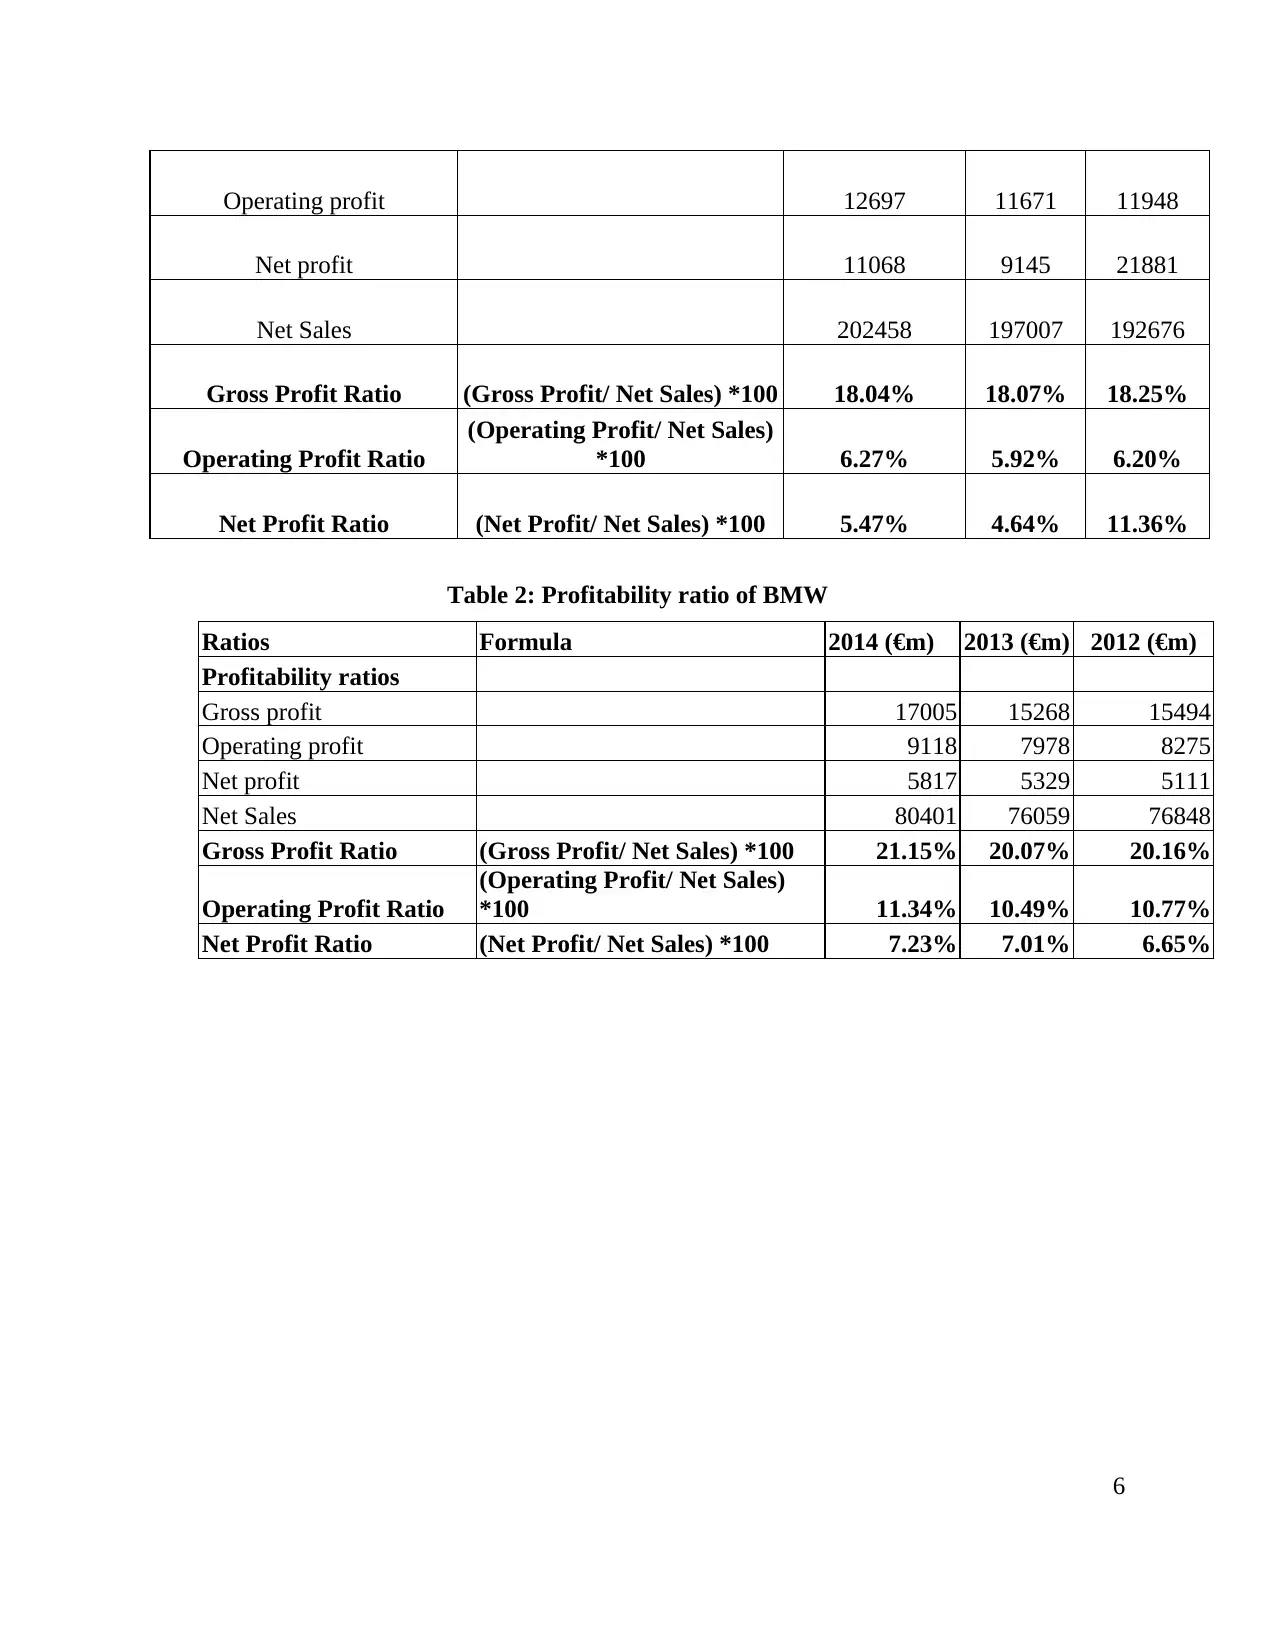
Operating profit 12697 11671 11948
Net profit 11068 9145 21881
Net Sales 202458 197007 192676
Gross Profit Ratio (Gross Profit/ Net Sales) *100 18.04% 18.07% 18.25%
Operating Profit Ratio
(Operating Profit/ Net Sales)
*100 6.27% 5.92% 6.20%
Net Profit Ratio (Net Profit/ Net Sales) *100 5.47% 4.64% 11.36%
Table 2: Profitability ratio of BMW
Ratios Formula 2014 (€m) 2013 (€m) 2012 (€m)
Profitability ratios
Gross profit 17005 15268 15494
Operating profit 9118 7978 8275
Net profit 5817 5329 5111
Net Sales 80401 76059 76848
Gross Profit Ratio (Gross Profit/ Net Sales) *100 21.15% 20.07% 20.16%
Operating Profit Ratio
(Operating Profit/ Net Sales)
*100 11.34% 10.49% 10.77%
Net Profit Ratio (Net Profit/ Net Sales) *100 7.23% 7.01% 6.65%
6
⊘ This is a preview!⊘
Do you want full access?
Subscribe today to unlock all pages.
Trusted by 1+ million students worldwide
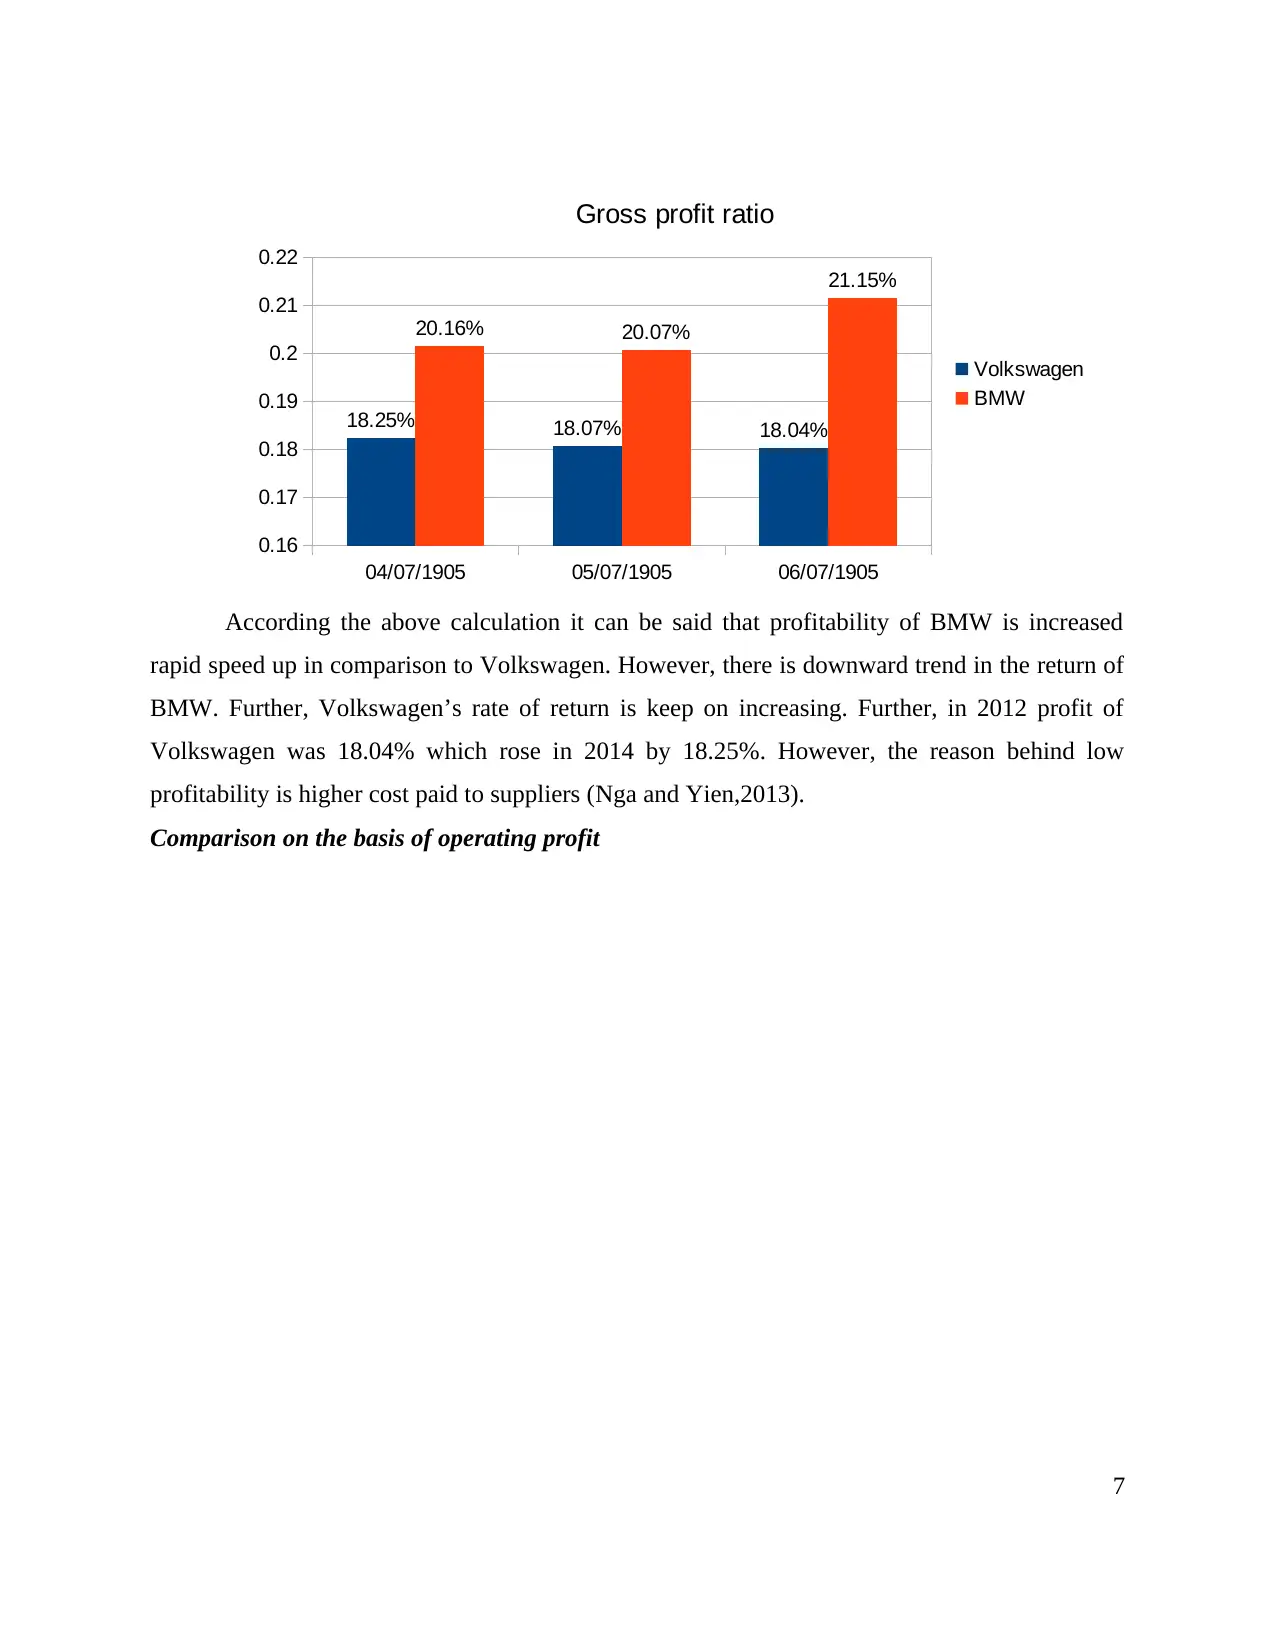
According the above calculation it can be said that profitability of BMW is increased
rapid speed up in comparison to Volkswagen. However, there is downward trend in the return of
BMW. Further, Volkswagen’s rate of return is keep on increasing. Further, in 2012 profit of
Volkswagen was 18.04% which rose in 2014 by 18.25%. However, the reason behind low
profitability is higher cost paid to suppliers (Nga and Yien,2013).
Comparison on the basis of operating profit
7
04/07/1905 05/07/1905 06/07/1905
0.16
0.17
0.18
0.19
0.2
0.21
0.22
18.04%18.07%18.25%
21.15%
20.07%20.16%
Gross profit ratio
Volkswagen
BMW
Paraphrase This Document
Need a fresh take? Get an instant paraphrase of this document with our AI Paraphraser
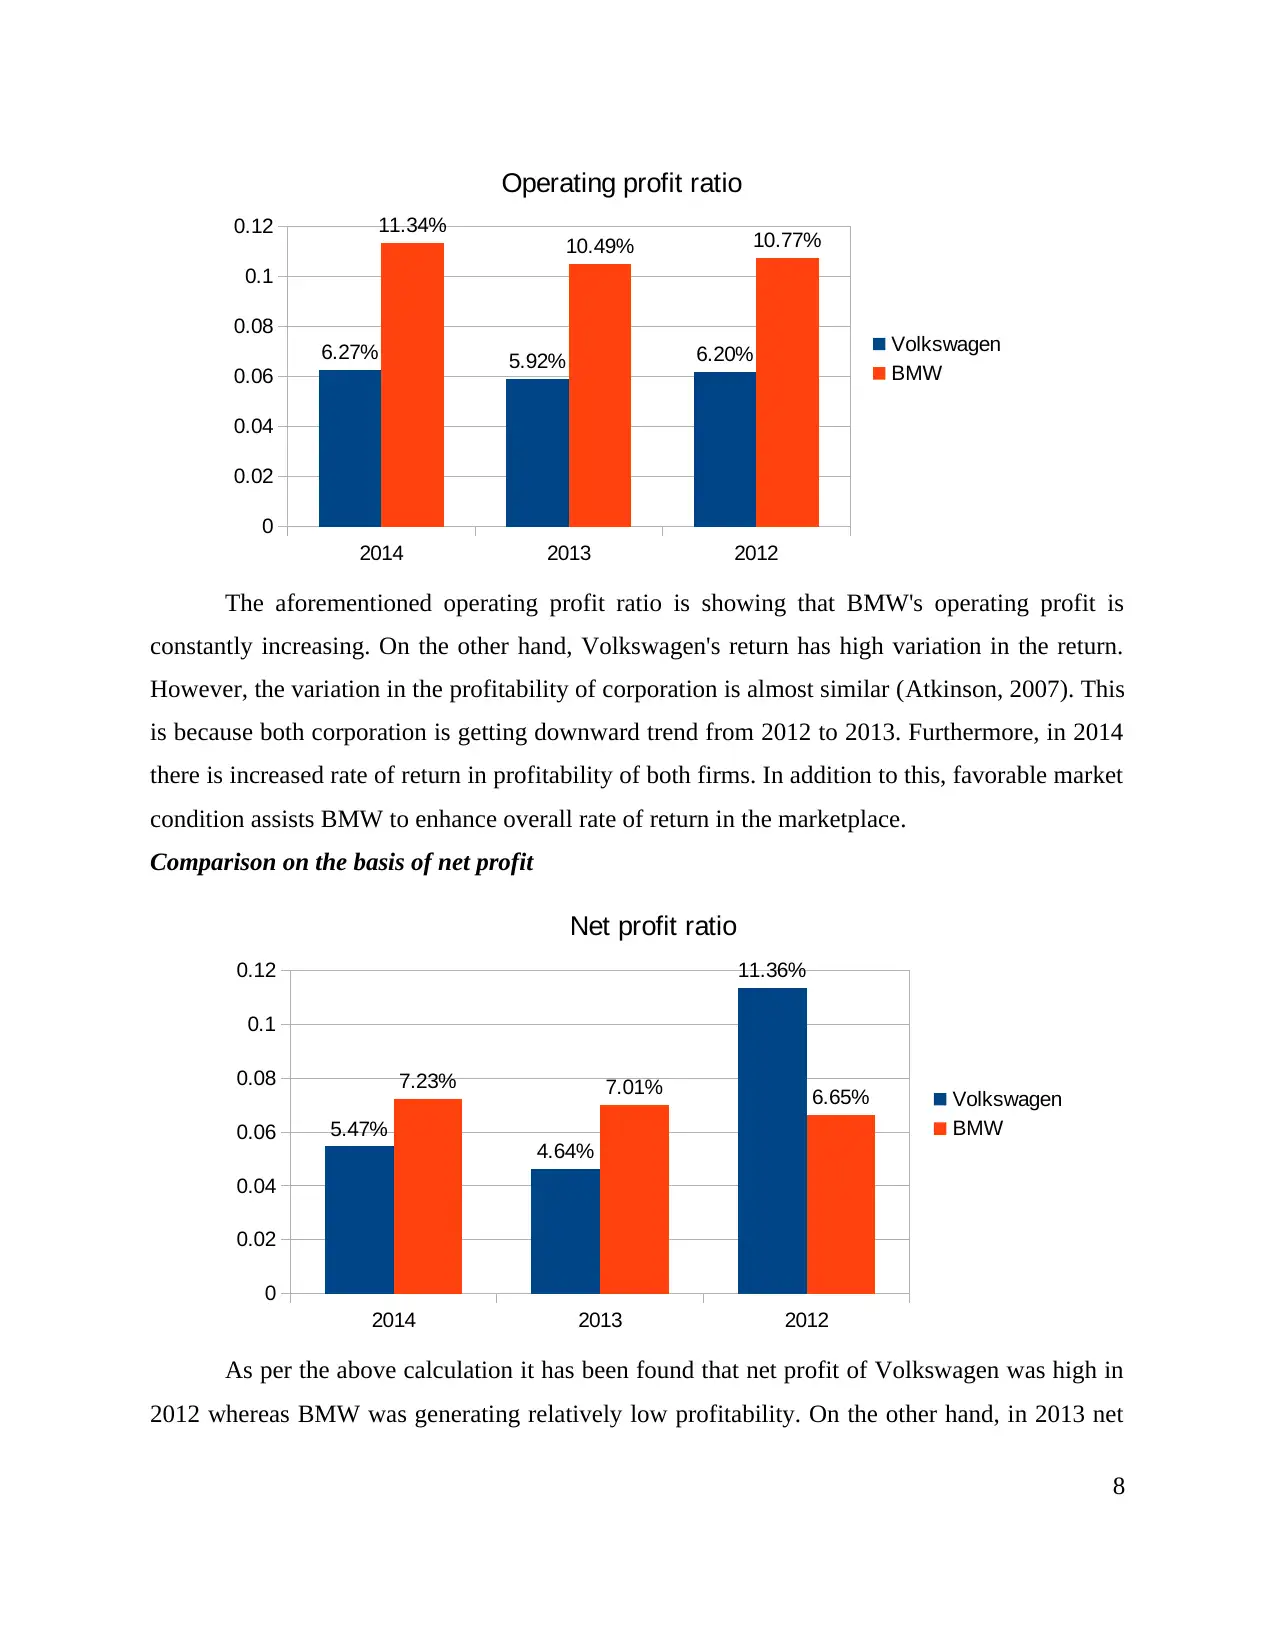
The aforementioned operating profit ratio is showing that BMW's operating profit is
constantly increasing. On the other hand, Volkswagen's return has high variation in the return.
However, the variation in the profitability of corporation is almost similar (Atkinson, 2007). This
is because both corporation is getting downward trend from 2012 to 2013. Furthermore, in 2014
there is increased rate of return in profitability of both firms. In addition to this, favorable market
condition assists BMW to enhance overall rate of return in the marketplace.
Comparison on the basis of net profit
As per the above calculation it has been found that net profit of Volkswagen was high in
2012 whereas BMW was generating relatively low profitability. On the other hand, in 2013 net
8
2014 2013 2012
0
0.02
0.04
0.06
0.08
0.1
0.12
6.27% 5.92% 6.20%
11.34%
10.49% 10.77%
Operating profit ratio
Volkswagen
BMW
2014 2013 2012
0
0.02
0.04
0.06
0.08
0.1
0.12
5.47%
4.64%
11.36%
7.23% 7.01% 6.65%
Net profit ratio
Volkswagen
BMW
profit of BMW was 7.01% which has increased in 2014 by 7.23%. In addition to this, in 2014 net
profit for the Volkswagen is 5.47. It depicts that there is drastic decline in profitability of
Volkswagen. Also, the profitability is varying to a great extent. Ont the other hand, BMW is
continuously growing at rapid speed (Yazdifar, 2004). It shows that corporation is making use of
competitive strategies in order to cope up with changing scenario. It aids to achieve long as well
as short term objectives of firm in the marketplace. On the other side, Volkswagen profitability is
going down due to high additional expenses. Furthermore, it can be said that BMW is
performing good in term of rate of return.
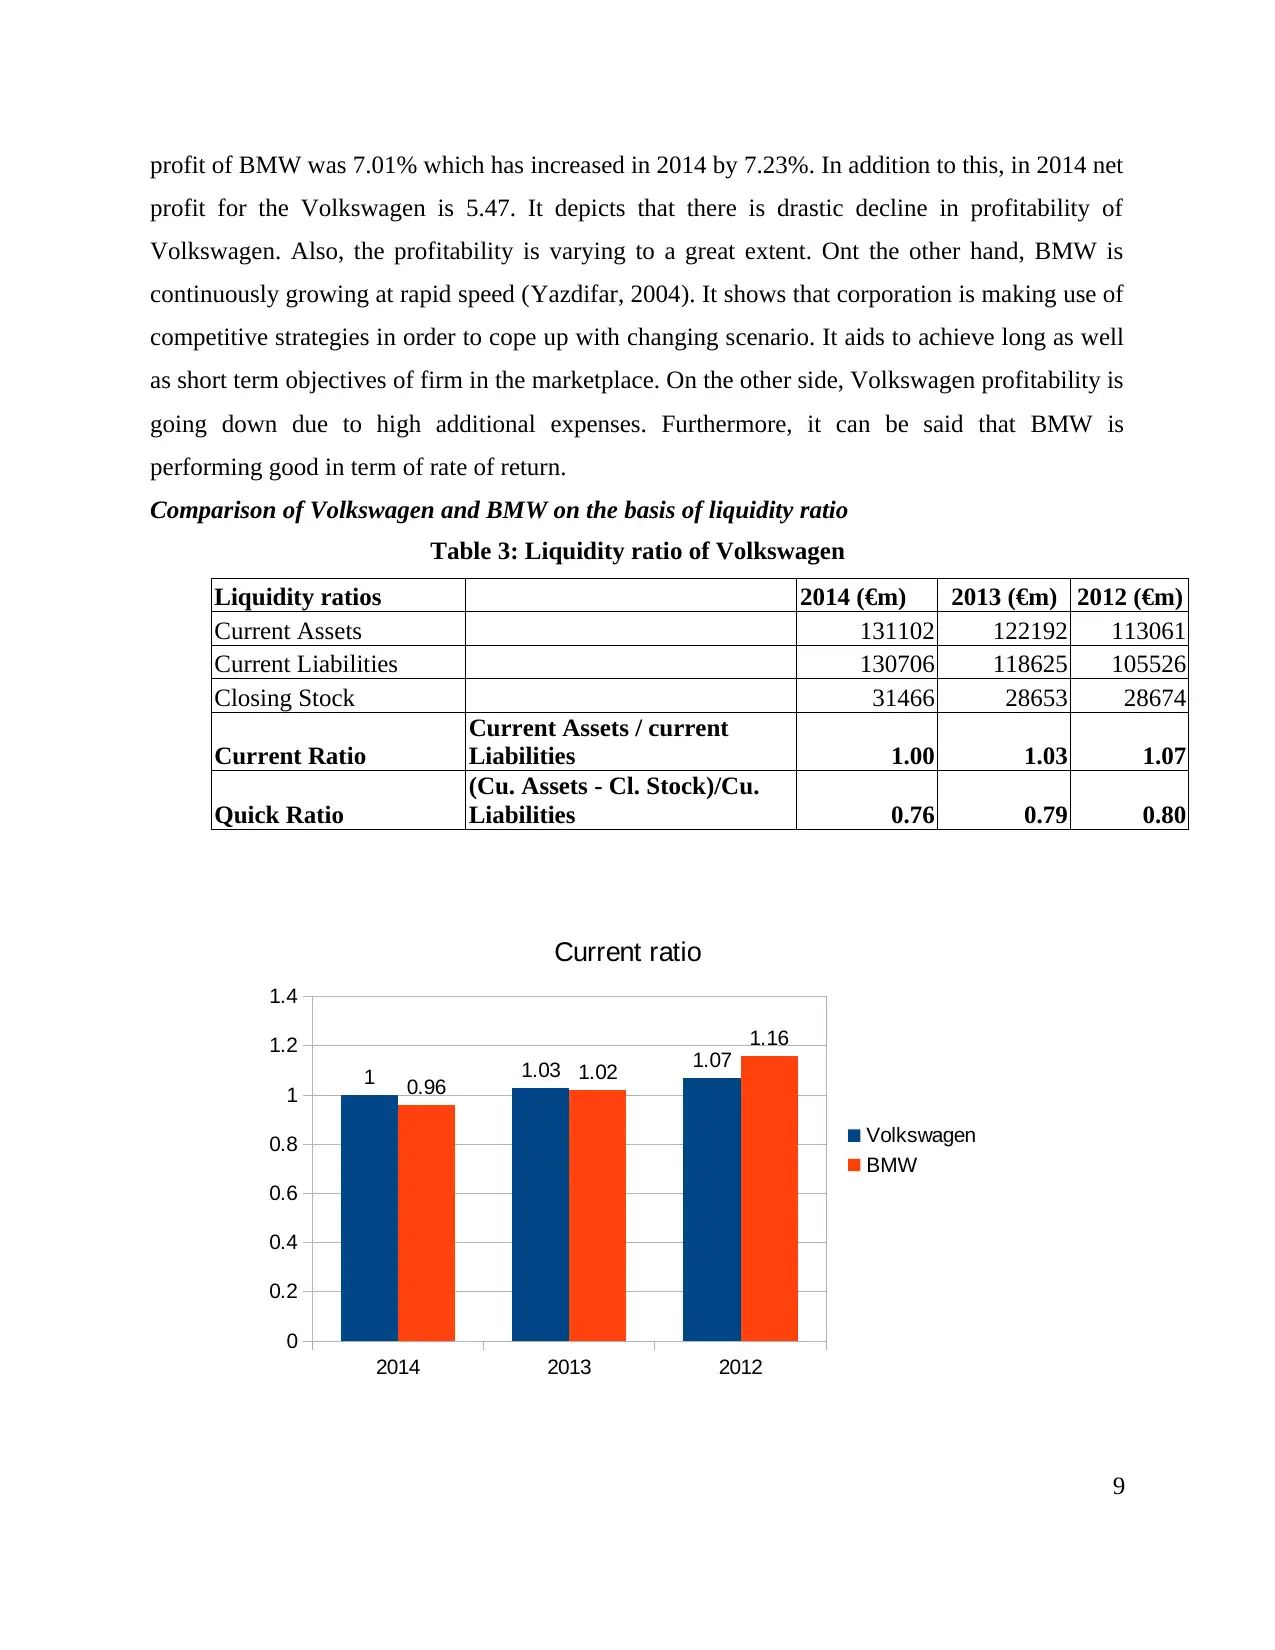
Comparison of Volkswagen and BMW on the basis of liquidity ratio
Table 3: Liquidity ratio of Volkswagen
Liquidity ratios 2014 (€m) 2013 (€m) 2012 (€m)
Current Assets 131102 122192 113061
Current Liabilities 130706 118625 105526
Closing Stock 31466 28653 28674
Current Ratio
Current Assets / current
Liabilities 1.00 1.03 1.07
Quick Ratio
(Cu. Assets - Cl. Stock)/Cu.
Liabilities 0.76 0.79 0.80
9
2014 2013 2012
0
0.2
0.4
0.6
0.8
1
1.2
1.4
1 1.03 1.07
0.96 1.02
1.16
Current ratio
Volkswagen
BMW
profit for the Volkswagen is 5.47. It depicts that there is drastic decline in profitability of
Volkswagen. Also, the profitability is varying to a great extent. Ont the other hand, BMW is
continuously growing at rapid speed (Yazdifar, 2004). It shows that corporation is making use of
competitive strategies in order to cope up with changing scenario. It aids to achieve long as well
as short term objectives of firm in the marketplace. On the other side, Volkswagen profitability is
going down due to high additional expenses. Furthermore, it can be said that BMW is
performing good in term of rate of return.
Comparison of Volkswagen and BMW on the basis of liquidity ratio
Table 3: Liquidity ratio of Volkswagen
Liquidity ratios 2014 (€m) 2013 (€m) 2012 (€m)
Current Assets 131102 122192 113061
Current Liabilities 130706 118625 105526
Closing Stock 31466 28653 28674
Current Ratio
Current Assets / current
Liabilities 1.00 1.03 1.07
Quick Ratio
(Cu. Assets - Cl. Stock)/Cu.
Liabilities 0.76 0.79 0.80
9
2014 2013 2012
0
0.2
0.4
0.6
0.8
1
1.2
1.4
1 1.03 1.07
0.96 1.02
1.16
Current ratio
Volkswagen
BMW
⊘ This is a preview!⊘
Do you want full access?
Subscribe today to unlock all pages.
Trusted by 1+ million students worldwide
The current ratio depicts ability of firm to meet its short term obligation in order to meet
organizational objectives. This ratio depict combination of both current assets and liabilities.
From the calculation it has been found that current ratio of both corporation is up to the mark.
However, in 2014 BMW's current ratio is .96. It indicate that organization can find problem in
managing its short term obligation after a certain time span (Macintosh and Quattrone, 2010).
Furthermore, it might be possible that BMW accessed to costly sources of finance which in turn
current liabilities has been increased in comparison to current assets. Thus, current ratio of
Volkswagen is appropriate in comparison to other.
Comparison on the basis of quick ratio
Table 4: Liquidity ratio of BMW
Liquidity ratios 2014 (€m) 2013 (€m) 2012 (€m)
Current Assets 56884 52184 50530
Current Liabilities 59078 51134 43637
Closing Stock 11089 9595 9725
Current Ratio Current Assets / current Liabilities 0.96 1.02 1.16
Quick Ratio
(Cu. Assets - Cl. Stock)/Cu.
Liabilities 0.78 0.83 0.94
10
Paraphrase This Document
Need a fresh take? Get an instant paraphrase of this document with our AI Paraphraser
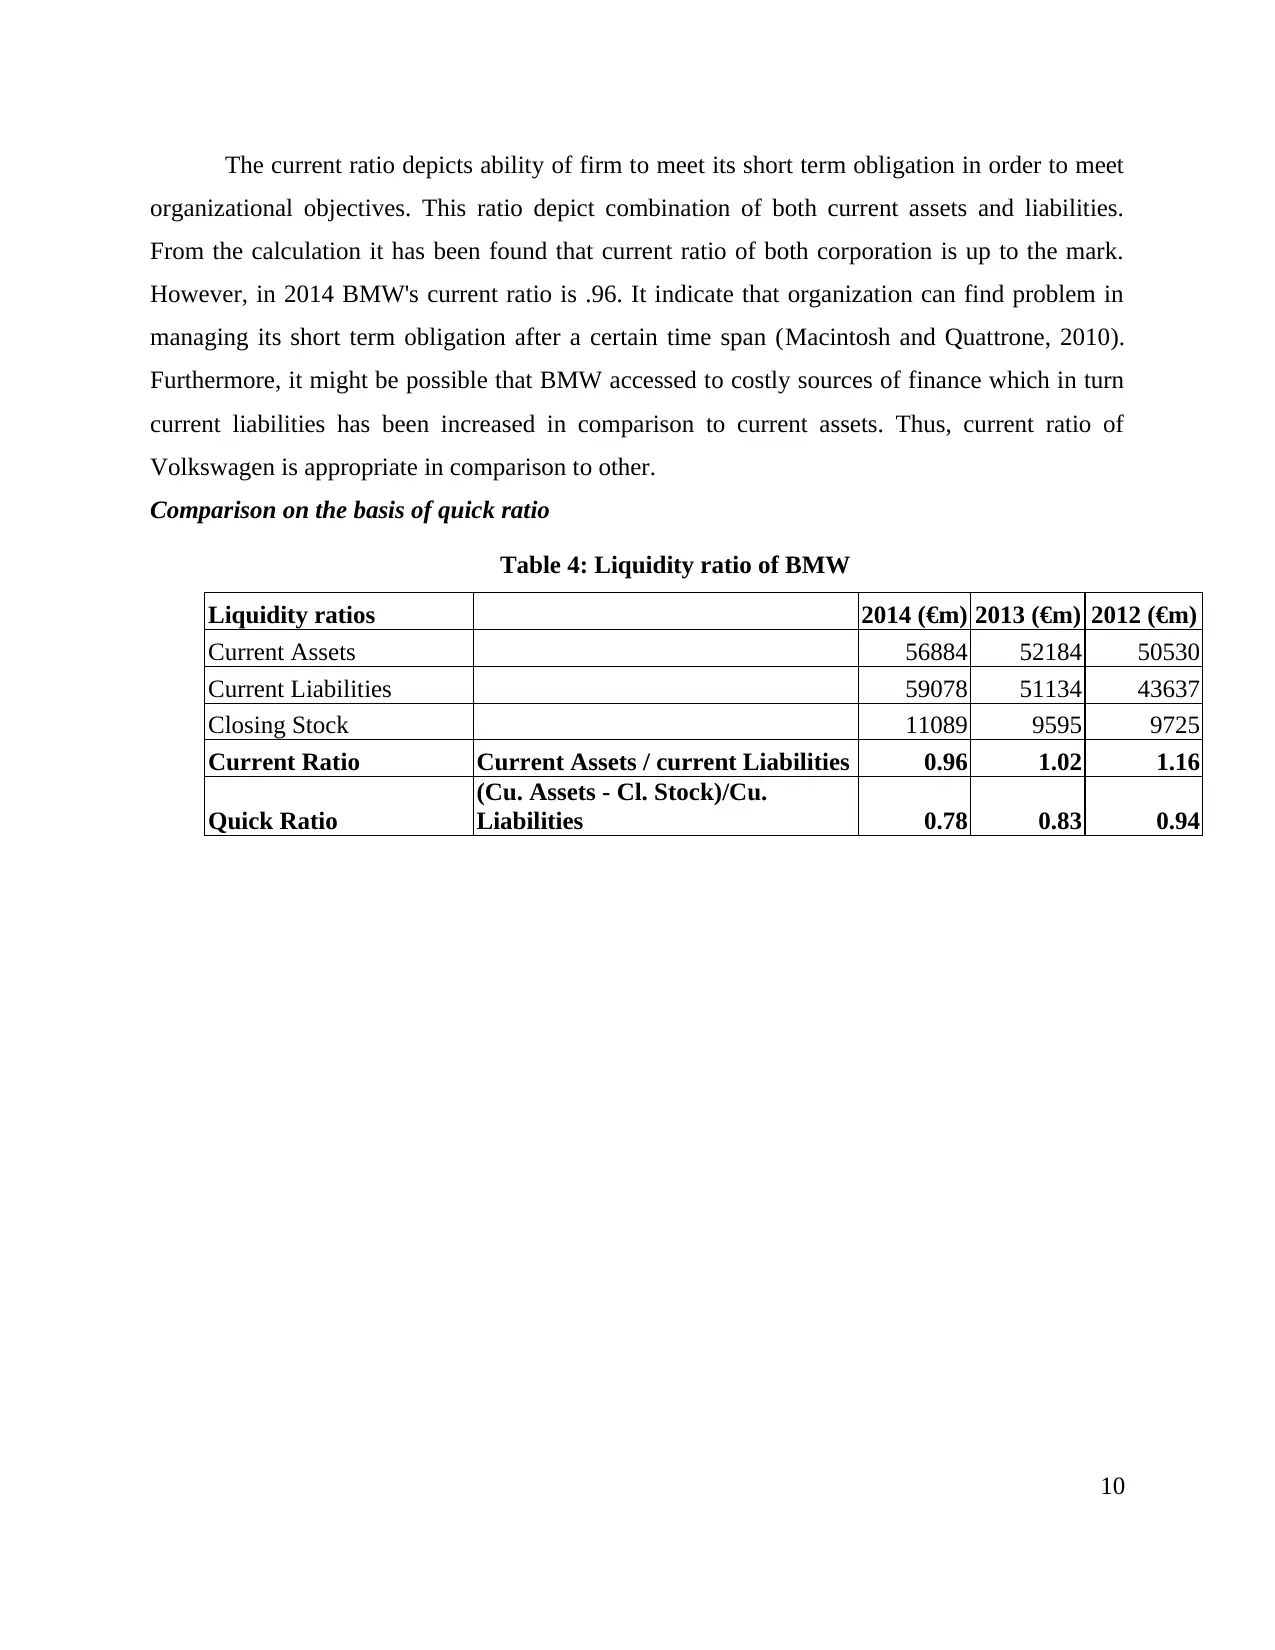
According the above table, it has been found that quick ratio of BMW is appropriate in
comparison to Volkswagen. This is because Volkswagen's quick ratio is going down year by
year which indicate that credit policy of firm not up to the mark. It may create financial burden
by which management cannot be able to meet its short term obligation. On the other hand, quick
ratio of BMW also have downward direction. It indicate poor performance of firm. It might be
possible that creditors are paid in less time span whereas extensive time has been given to
debtors. In such kind of circumstances firm need to have proper control on cash in order to
ensure about smooth flow of production.
Activity ratio
Table 5: Table 5: Activity ratio of Volkswagen
Efficiency/ Activity
Ratios 2014 (€m) 2013 (€m) 2012 (€m)
Net Sales 202458 197007 192676
Total Assets 0 324333 309518
Total Assets Turnover
Ratio Net Sales/ Total Assets 0.62 0.64 0.62
Cost of goods sold 165934 161407 437
Inventory 31466 28653 28674
Inventory Turnover
ratio COGS/Inventory 5.27 5.63 0.02
11
2014 2013 2012
0
0.1
0.2
0.3
0.4
0.5
0.6
0.7
0.8
0.9
1
0.76 0.79 0.80.78 0.83
0.94
Quick Ratio
Volkswagen
BMW
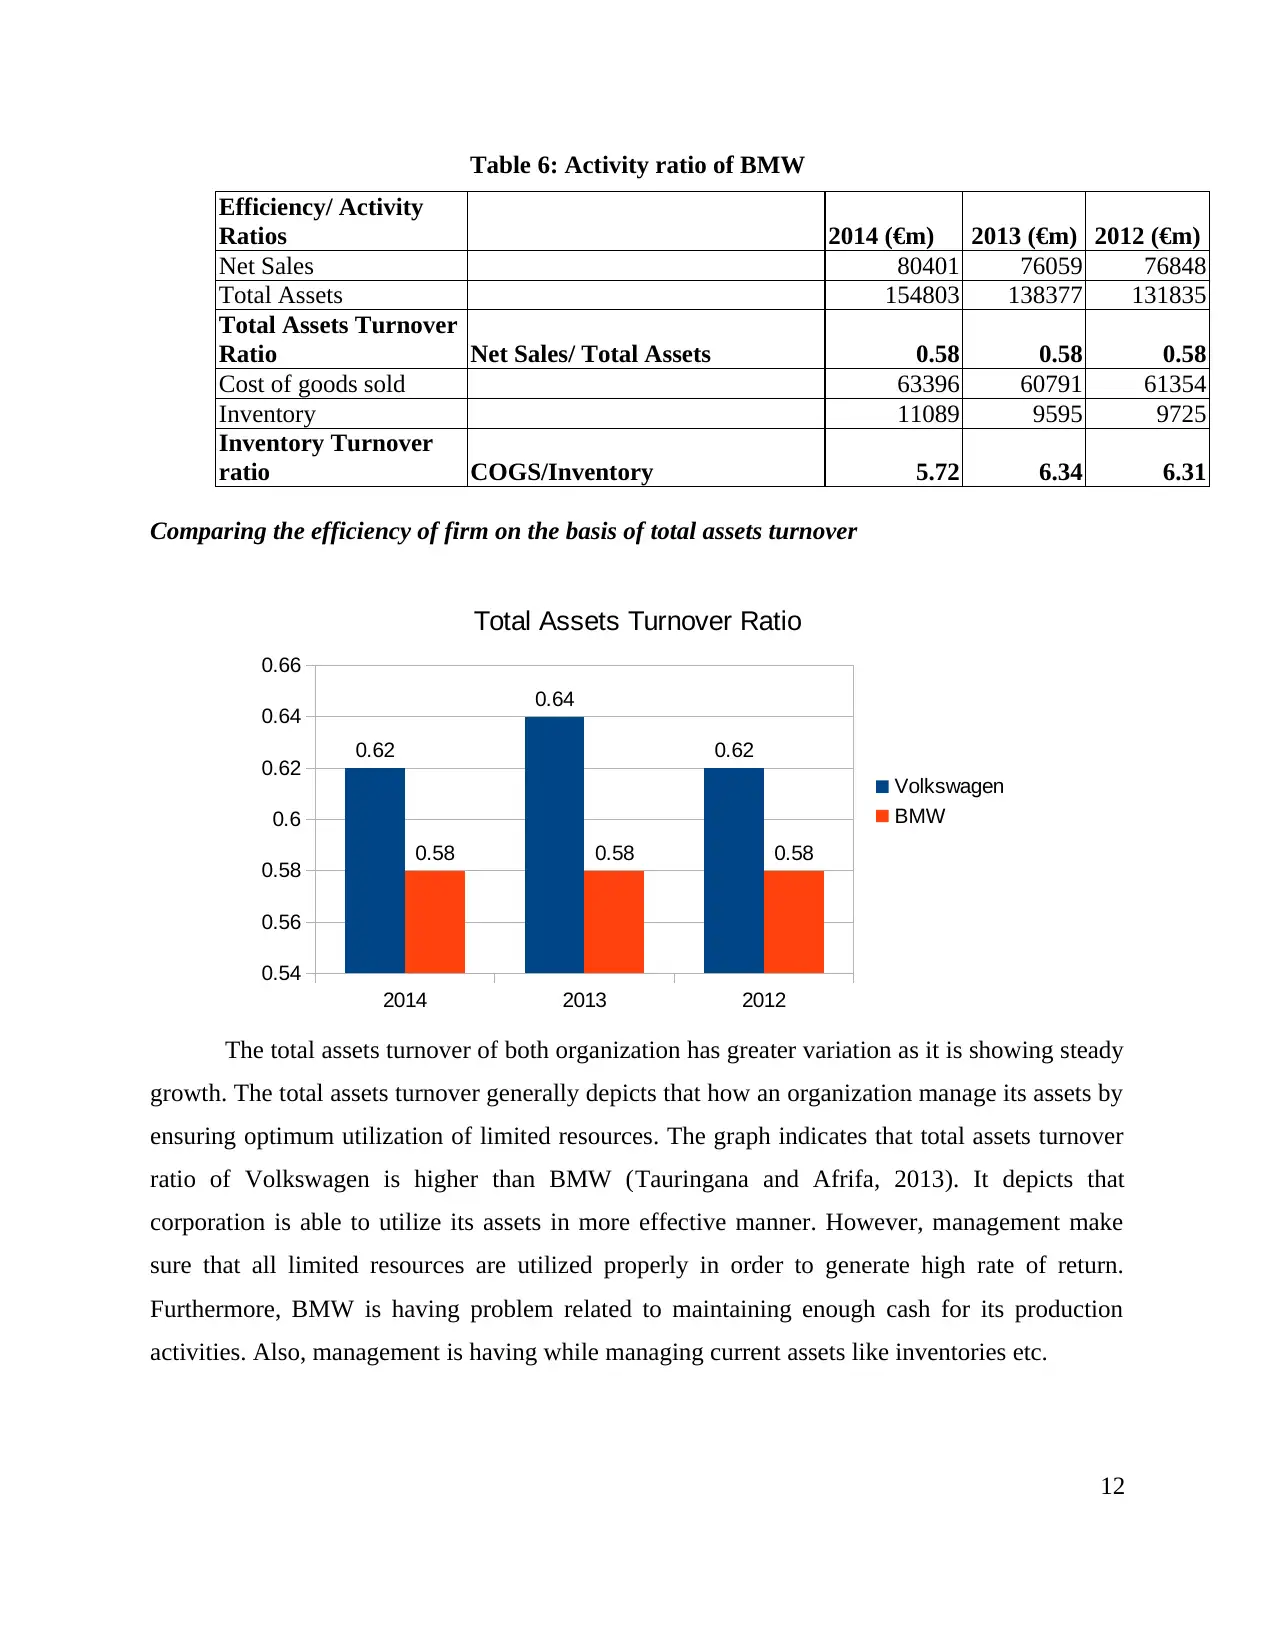
Table 6: Activity ratio of BMW
Efficiency/ Activity
Ratios 2014 (€m) 2013 (€m) 2012 (€m)
Net Sales 80401 76059 76848
Total Assets 154803 138377 131835
Total Assets Turnover
Ratio Net Sales/ Total Assets 0.58 0.58 0.58
Cost of goods sold 63396 60791 61354
Inventory 11089 9595 9725
Inventory Turnover
ratio COGS/Inventory 5.72 6.34 6.31
Comparing the efficiency of firm on the basis of total assets turnover
The total assets turnover of both organization has greater variation as it is showing steady
growth. The total assets turnover generally depicts that how an organization manage its assets by
ensuring optimum utilization of limited resources. The graph indicates that total assets turnover
ratio of Volkswagen is higher than BMW (Tauringana and Afrifa, 2013). It depicts that
corporation is able to utilize its assets in more effective manner. However, management make
sure that all limited resources are utilized properly in order to generate high rate of return.
Furthermore, BMW is having problem related to maintaining enough cash for its production
activities. Also, management is having while managing current assets like inventories etc.
12
2014 2013 2012
0.54
0.56
0.58
0.6
0.62
0.64
0.66
0.62
0.64
0.62
0.58 0.58 0.58
Total Assets Turnover Ratio
Volkswagen
BMW
⊘ This is a preview!⊘
Do you want full access?
Subscribe today to unlock all pages.
Trusted by 1+ million students worldwide
1 out of 20
Related Documents


Your All-in-One AI-Powered Toolkit for Academic Success.
+13062052269
info@desklib.com
Available 24*7 on WhatsApp / Email
![[object Object]](/_next/static/media/star-bottom.7253800d.svg)
Unlock your academic potential
Copyright © 2020–2026 A2Z Services. All Rights Reserved. Developed and managed by ZUCOL.