Financial Management and Control: Zurich Plc Performance Analysis

Verified

Added on  2020/02/03

|27
|5277
|77
Report
AI Summary
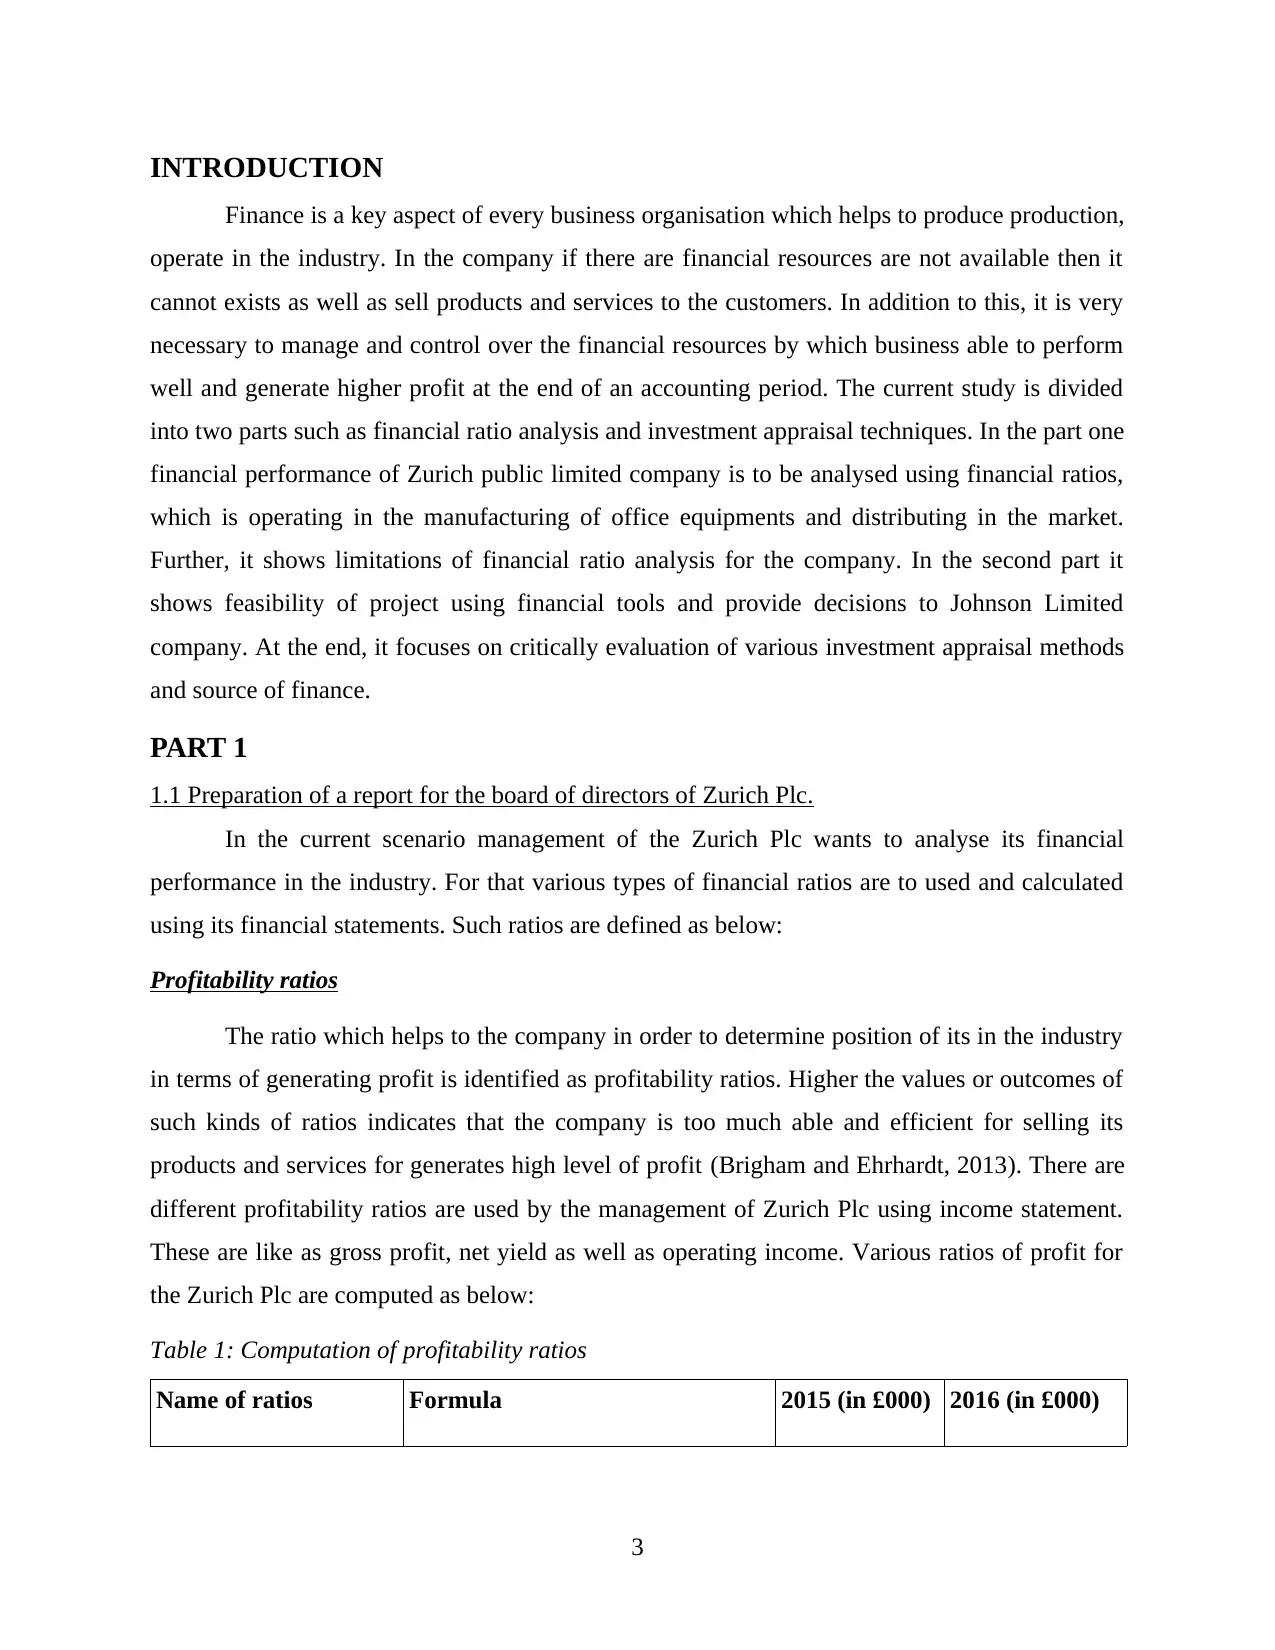
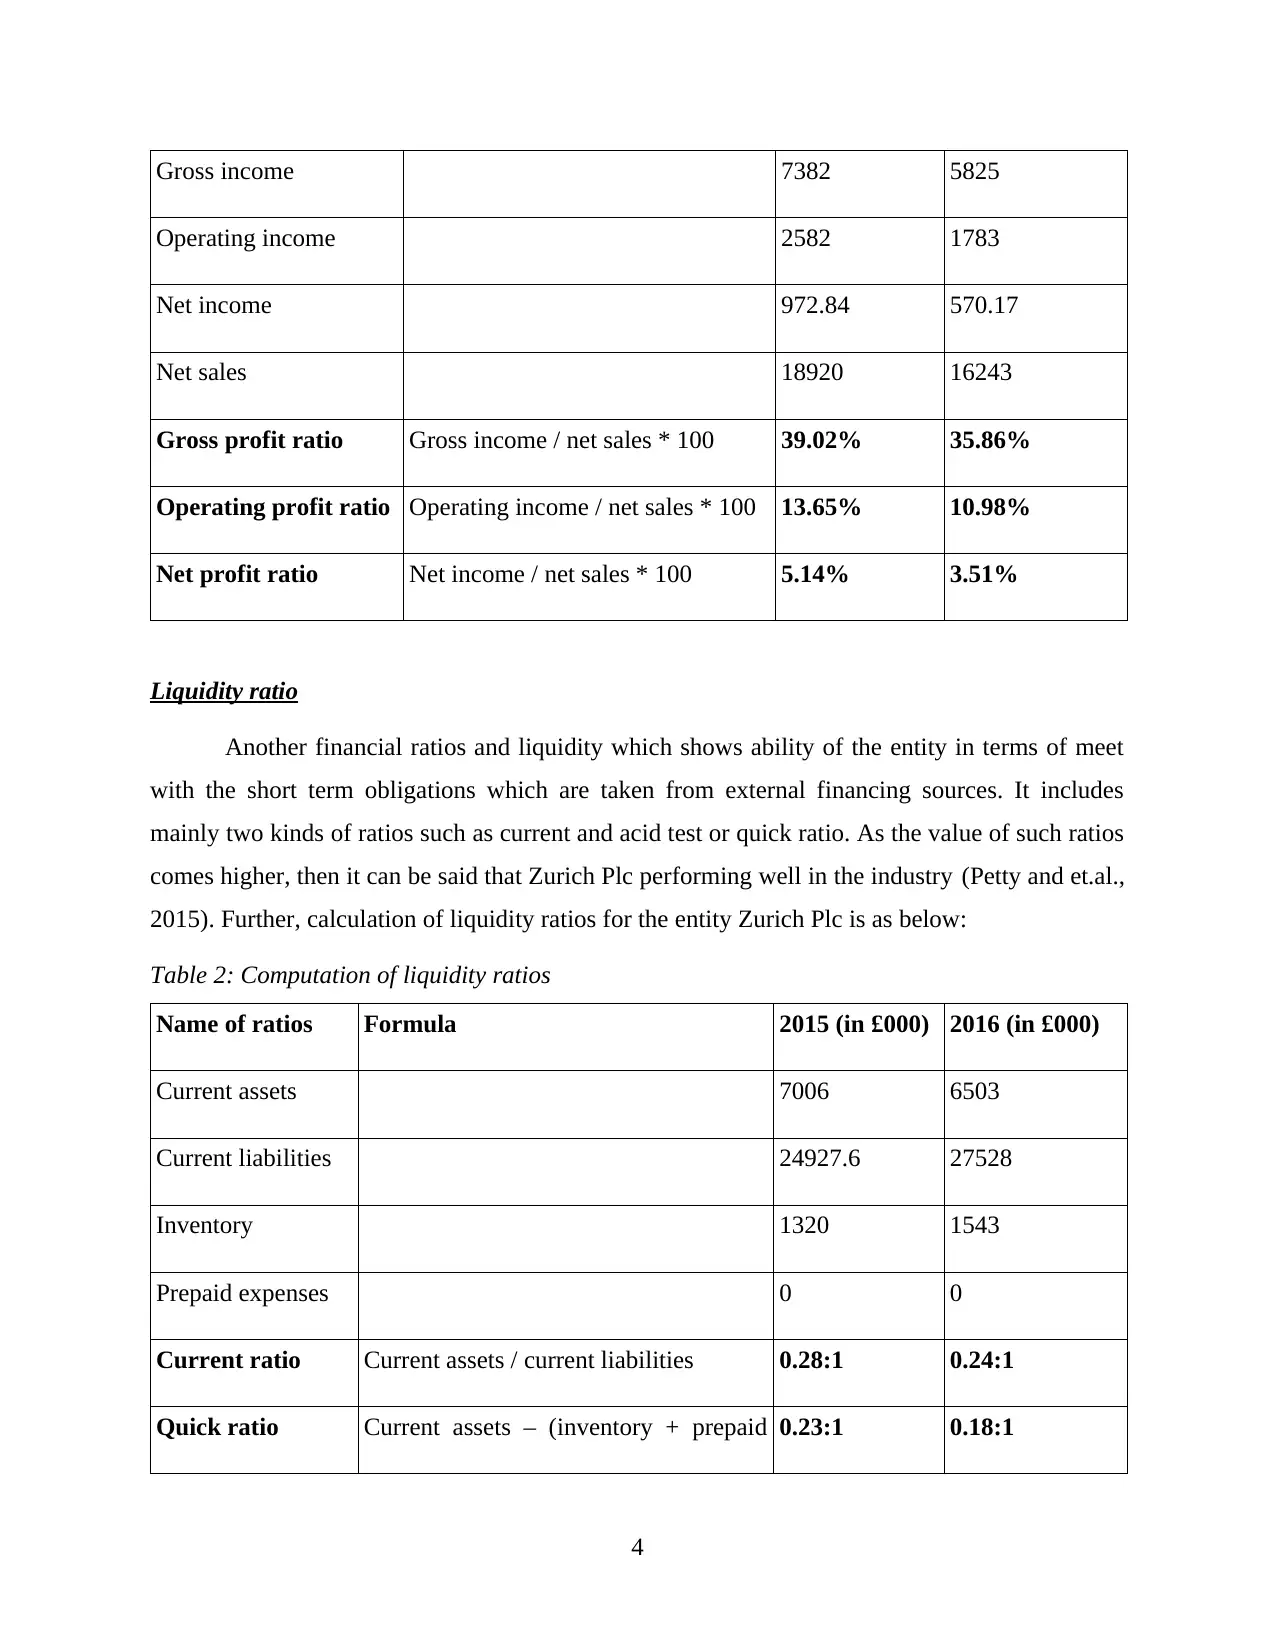
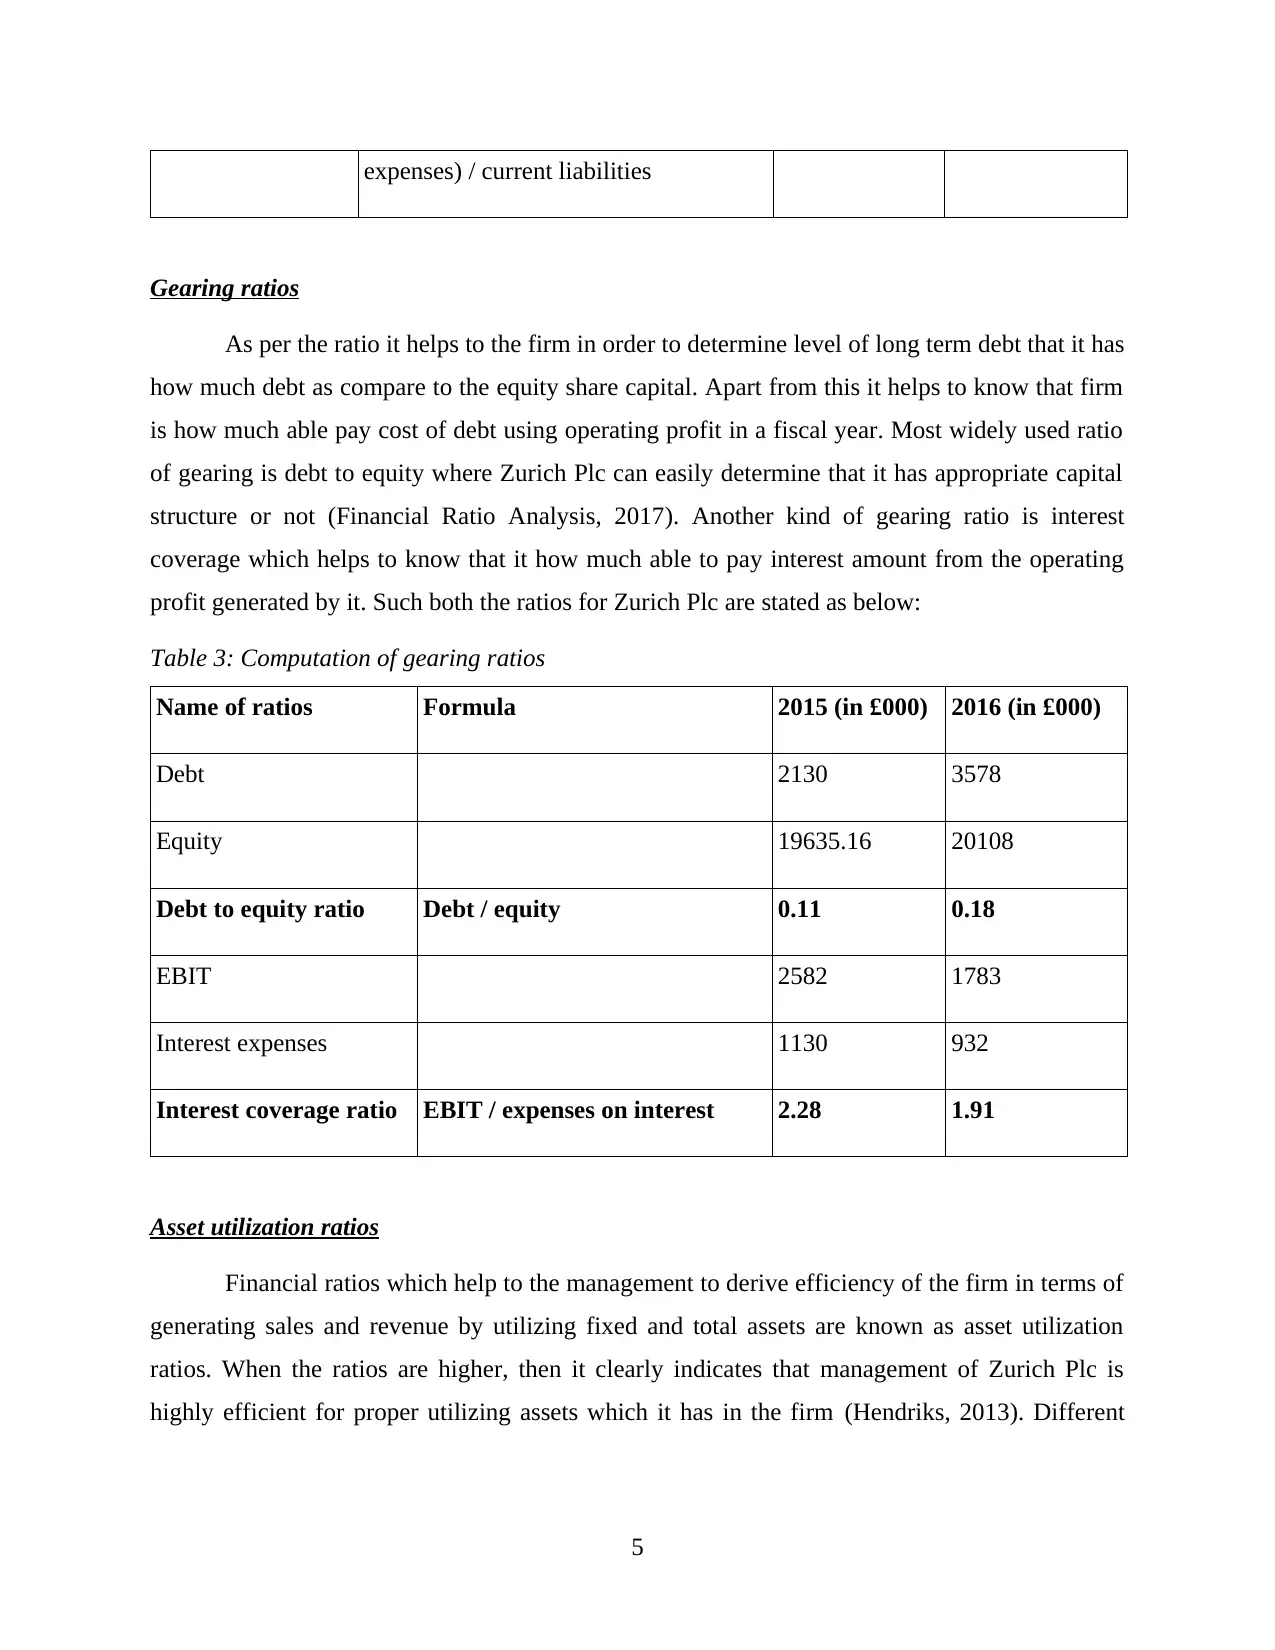
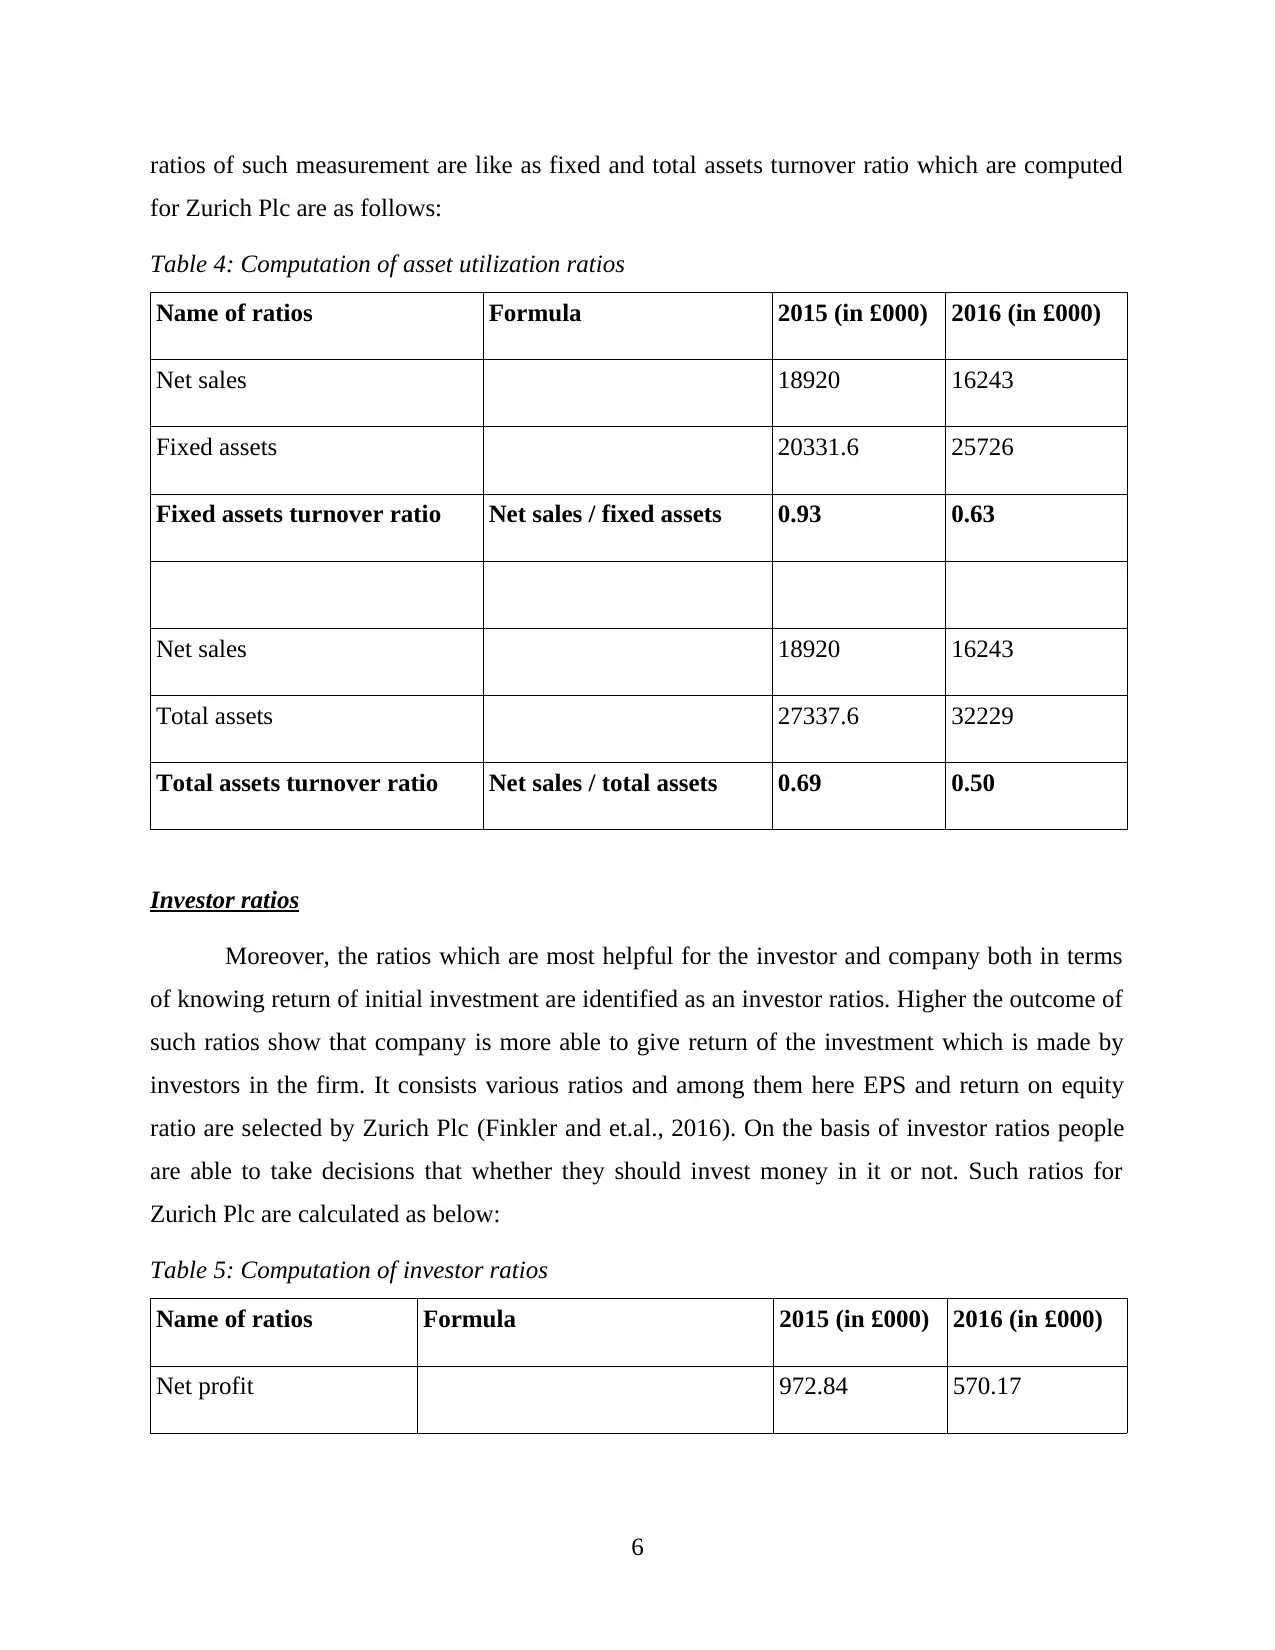
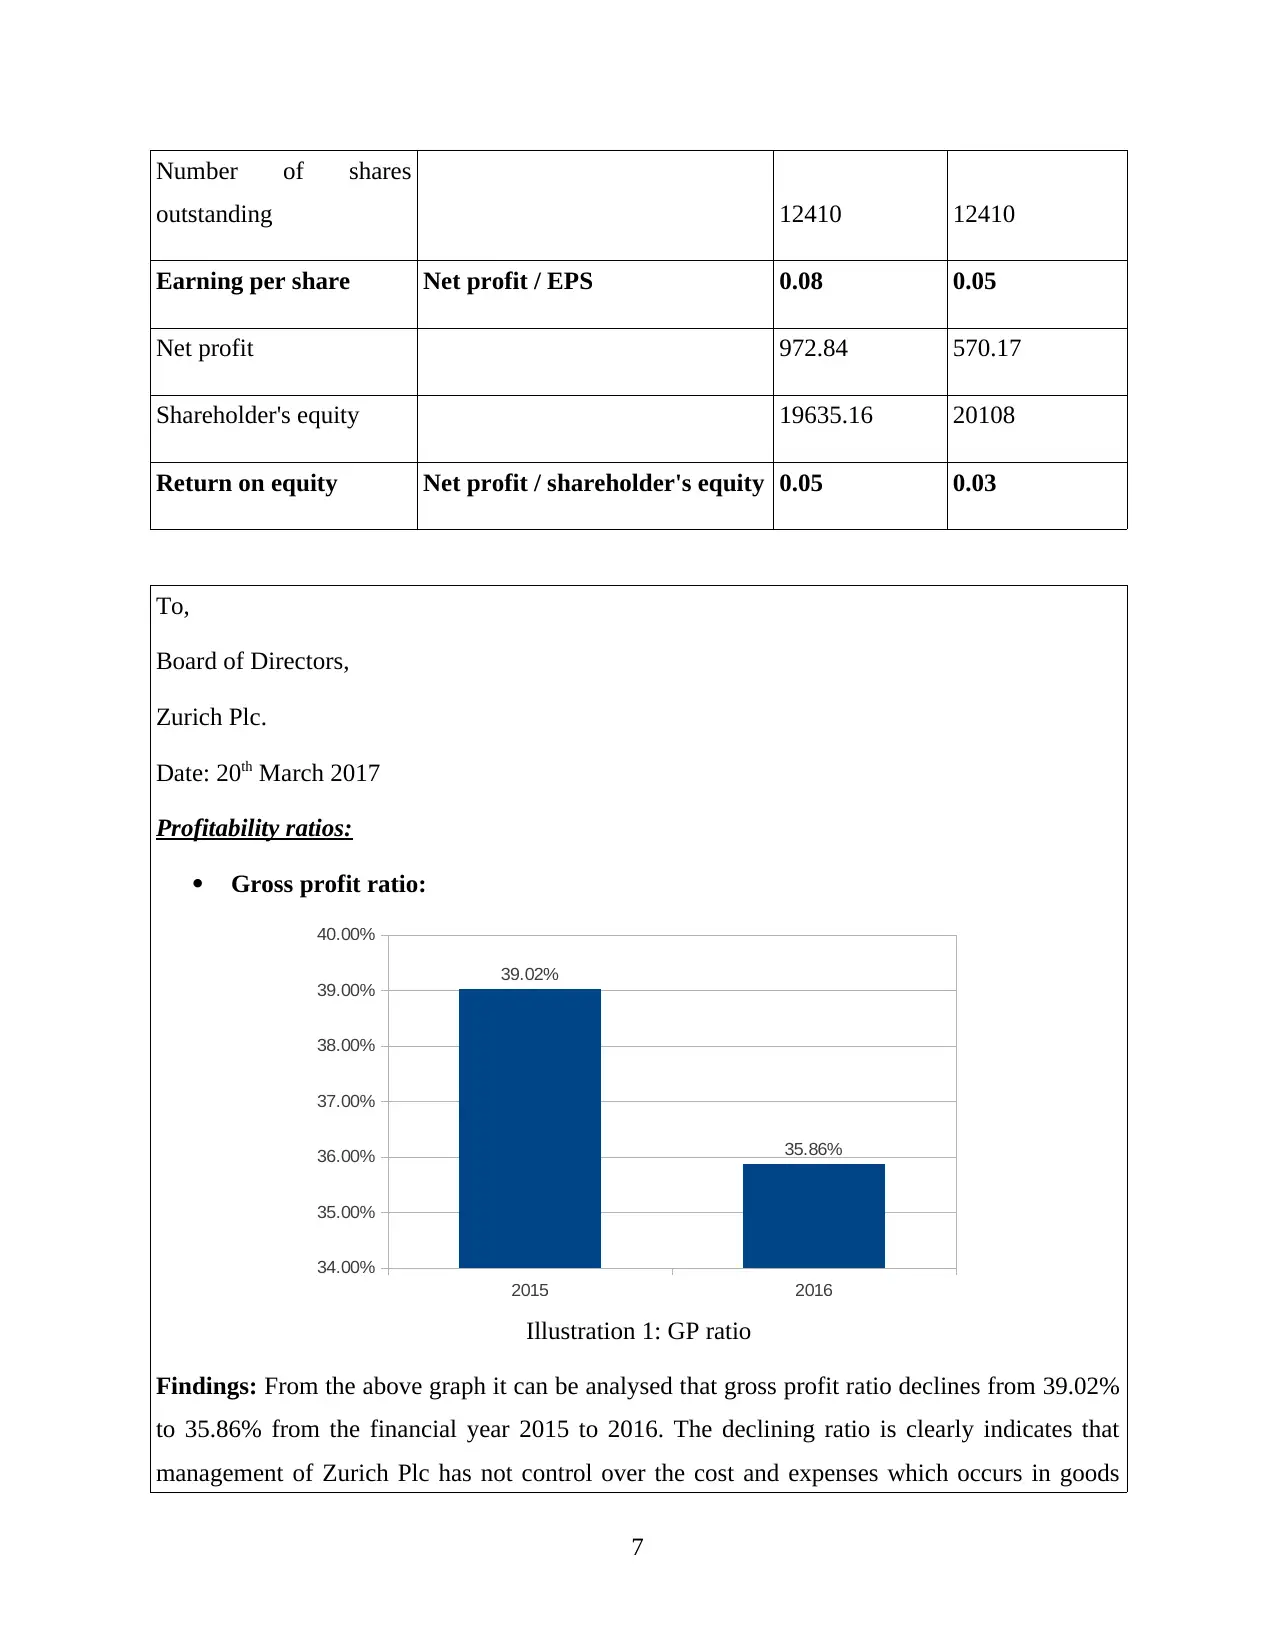
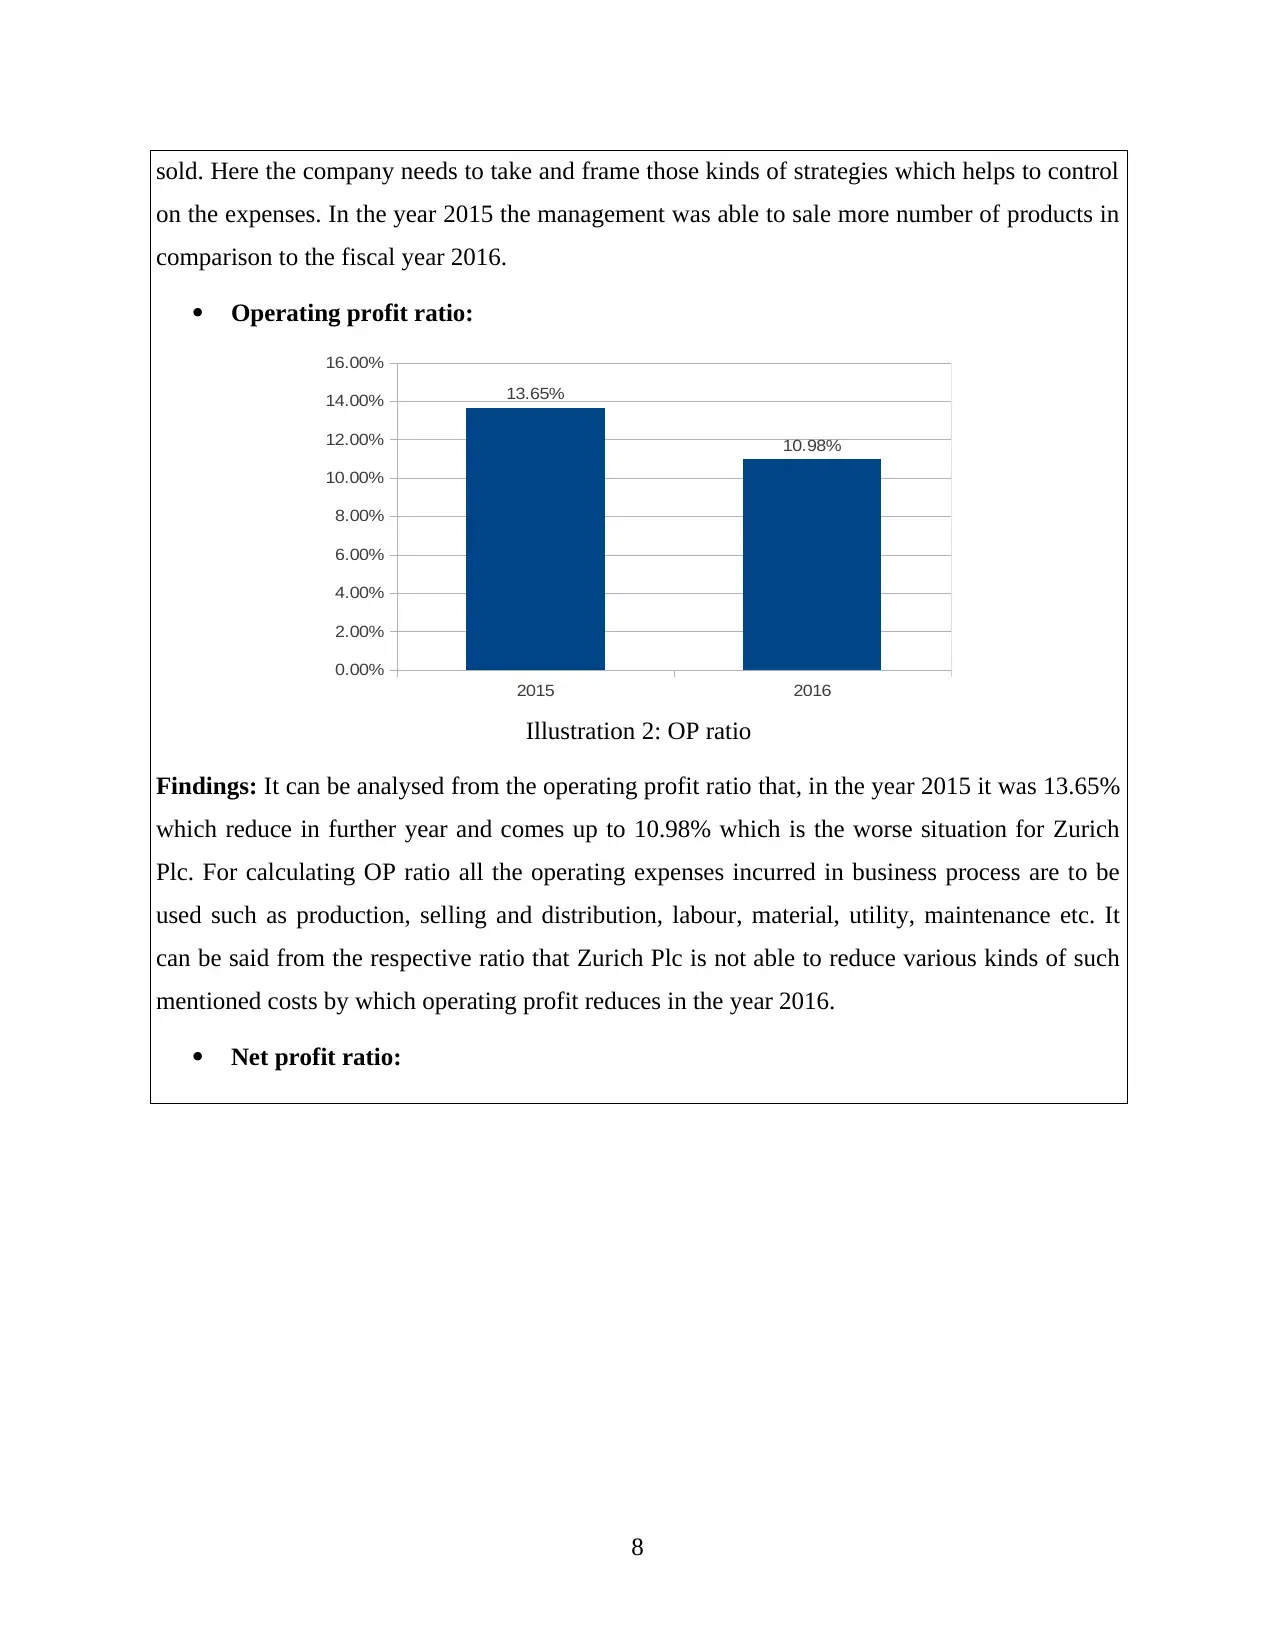
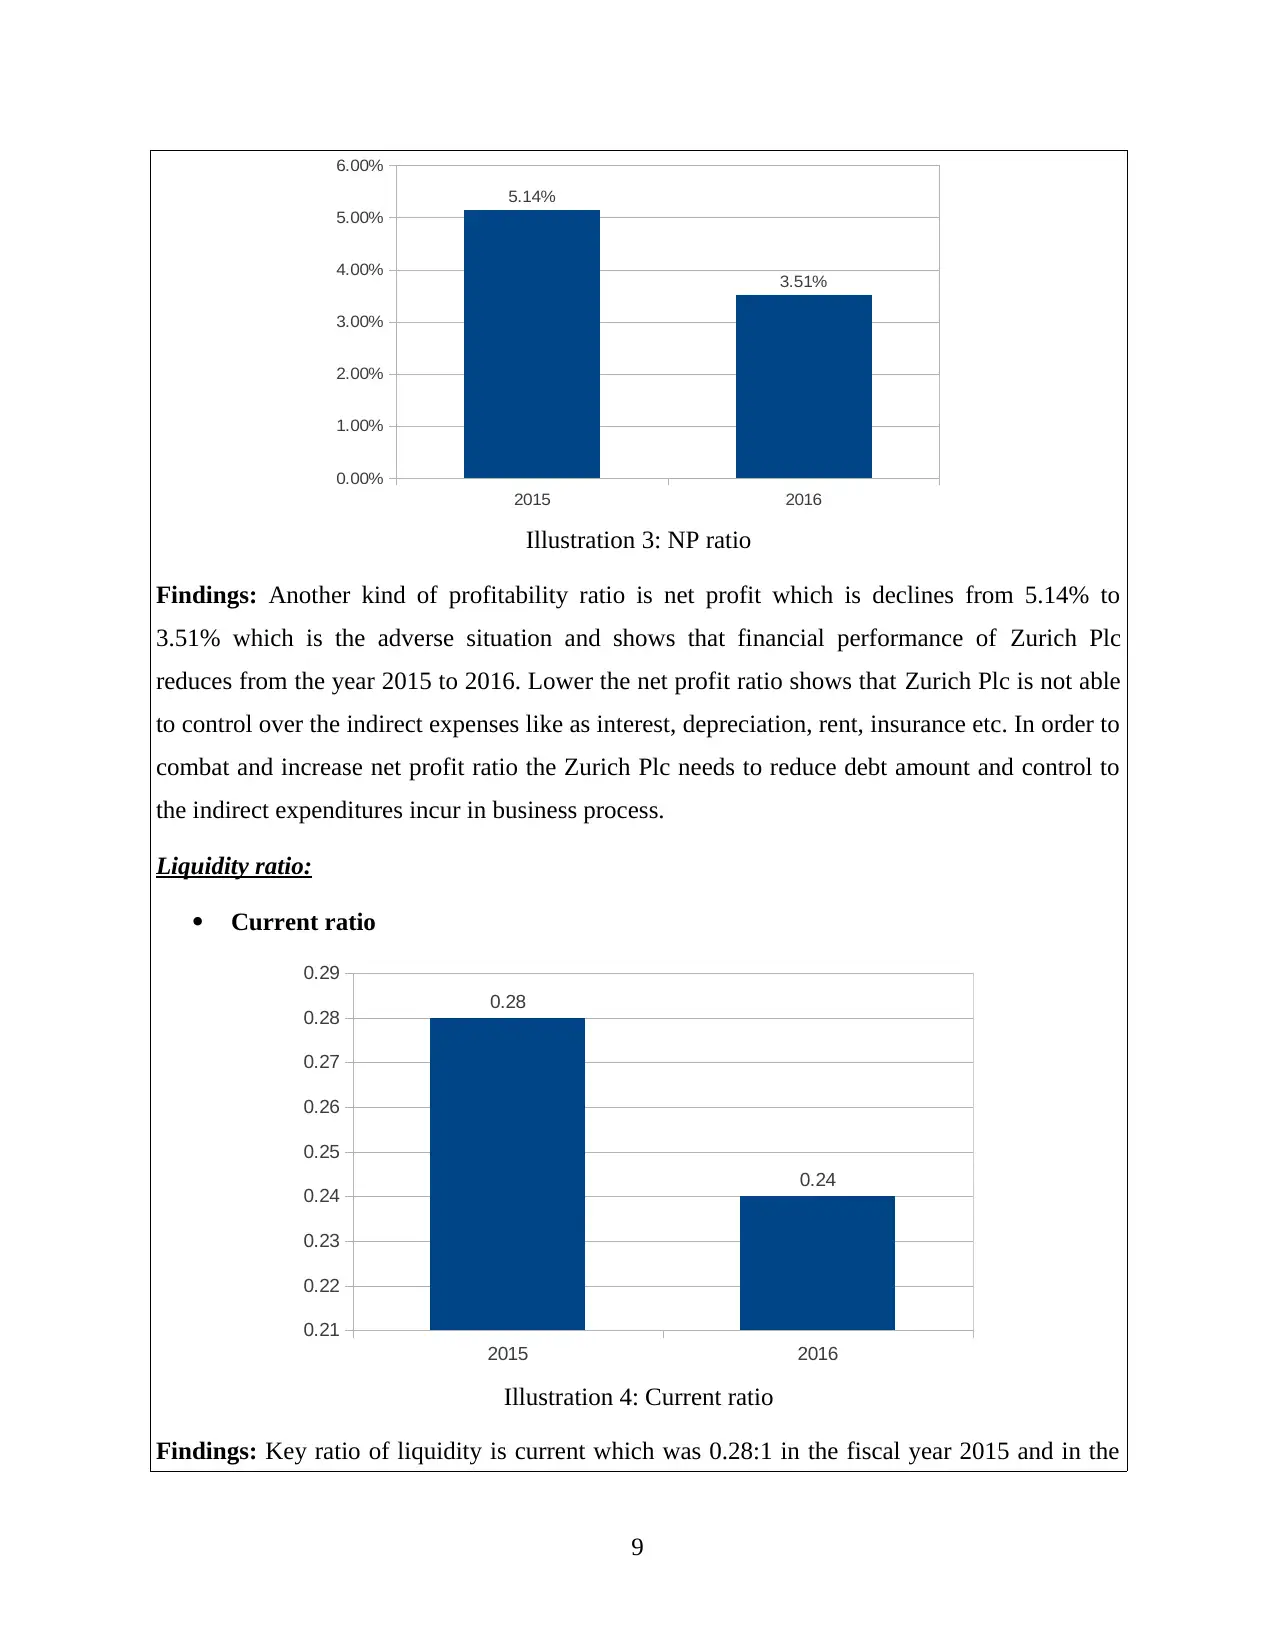
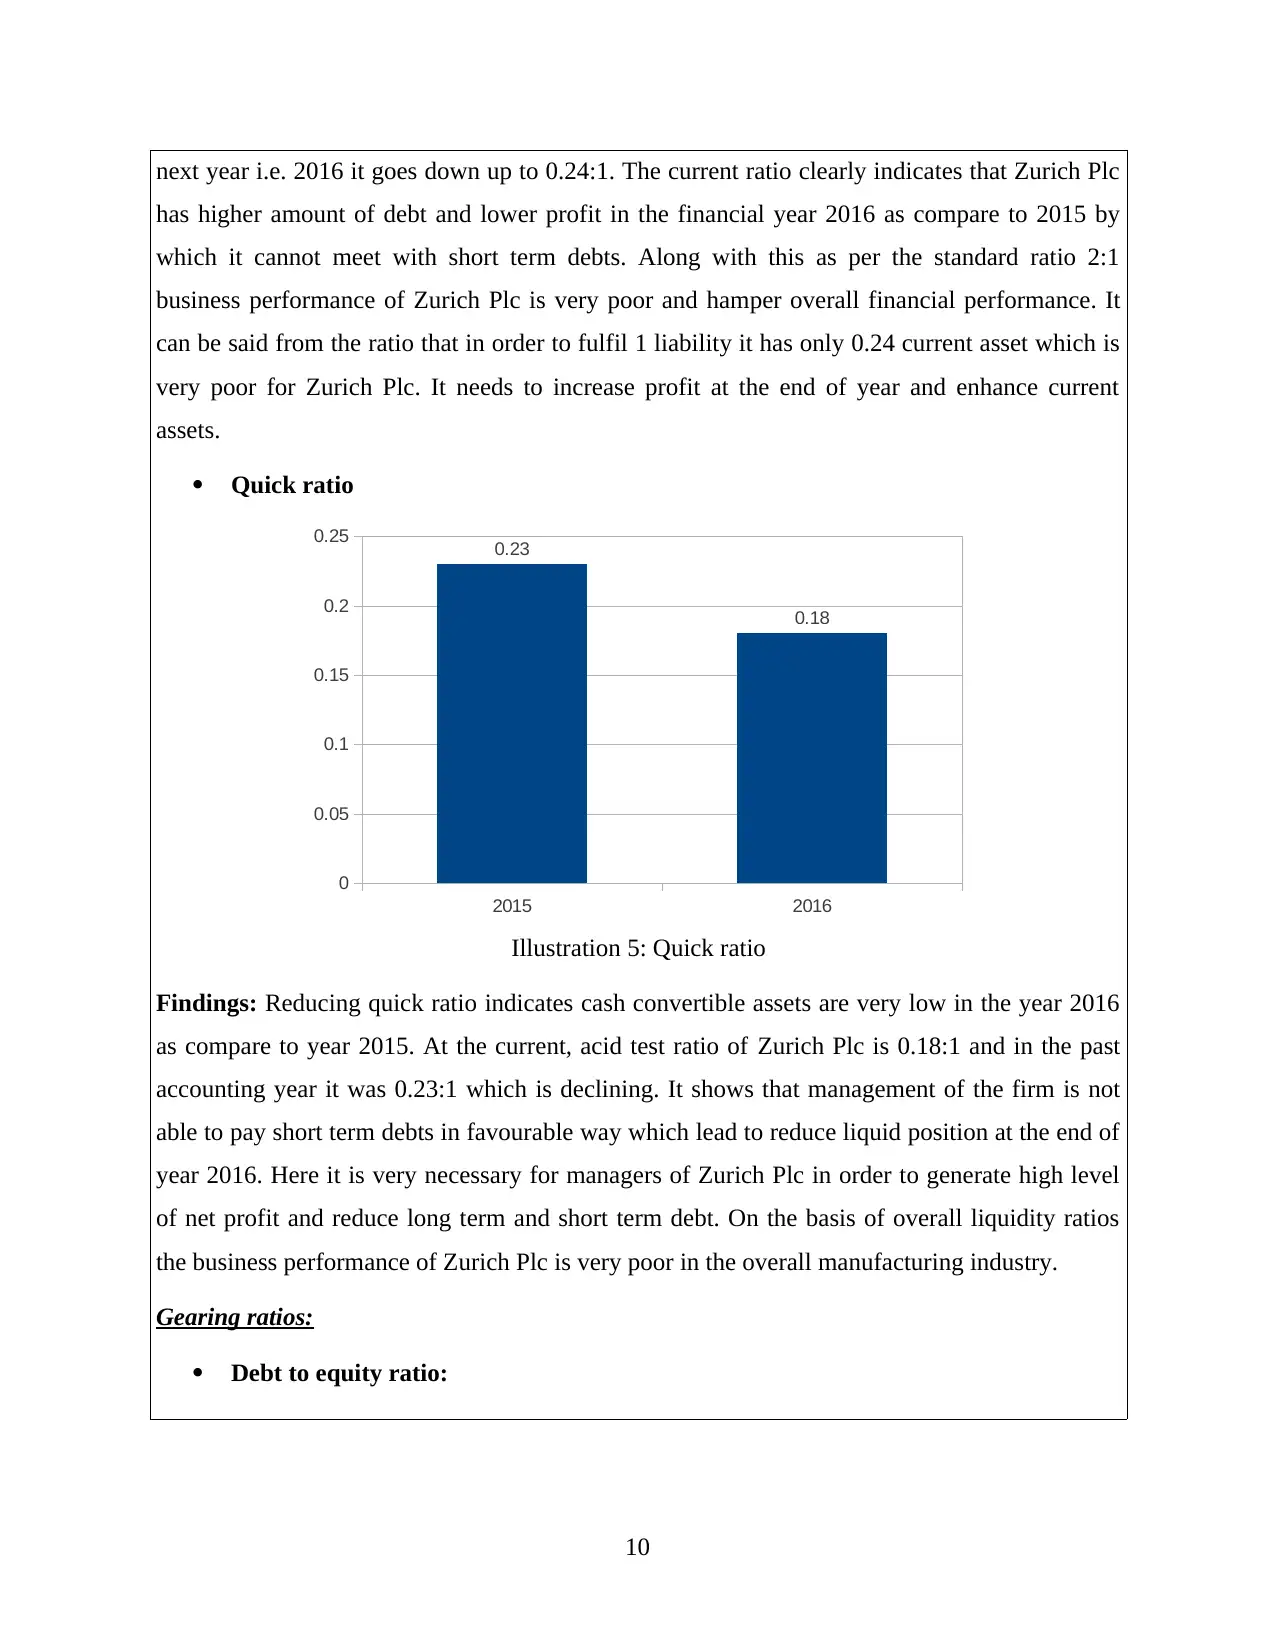
This report provides a comprehensive financial analysis of Zurich Plc, focusing on the evaluation of its performance through various financial ratios. The analysis encompasses profitability ratios (gross profit, operating profit, and net profit), liquidity ratios (current and quick ratios), gearing ratios (debt-to-equity and interest coverage), asset utilization ratios (fixed and total assets turnover), and investor ratios (earnings per share and return on equity). The report compares the financial data of Zurich Plc for the years 2015 and 2016, providing insights into the company's financial health, its ability to manage costs, and its efficiency in utilizing assets. The findings are presented to the board of directors, highlighting trends and offering strategic recommendations to improve financial performance. The report also discusses the limitations of financial ratio analysis.
Document Page
FINANCIAL
MANAGEMENT AND
CONTROL
tabler-icon-diamond-filled.svg

Paraphrase This Document

Need a fresh take? Get an instant paraphrase of this document with our AI Paraphraser
Document Page
Document Page
1
Document Page
2
tabler-icon-diamond-filled.svg

Paraphrase This Document

Need a fresh take? Get an instant paraphrase of this document with our AI Paraphraser
Document Page
INTRODUCTION
Finance is a key aspect of every business organisation which helps to produce production,
operate in the industry. In the company if there are financial resources are not available then it
cannot exists as well as sell products and services to the customers. In addition to this, it is very
necessary to manage and control over the financial resources by which business able to perform
well and generate higher profit at the end of an accounting period. The current study is divided
into two parts such as financial ratio analysis and investment appraisal techniques. In the part one
financial performance of Zurich public limited company is to be analysed using financial ratios,
which is operating in the manufacturing of office equipments and distributing in the market.
Further, it shows limitations of financial ratio analysis for the company. In the second part it
shows feasibility of project using financial tools and provide decisions to Johnson Limited
company. At the end, it focuses on critically evaluation of various investment appraisal methods
and source of finance.
PART 1
1.1 Preparation of a report for the board of directors of Zurich Plc.
In the current scenario management of the Zurich Plc wants to analyse its financial
performance in the industry. For that various types of financial ratios are to used and calculated
using its financial statements. Such ratios are defined as below:
Profitability ratios
The ratio which helps to the company in order to determine position of its in the industry
in terms of generating profit is identified as profitability ratios. Higher the values or outcomes of
such kinds of ratios indicates that the company is too much able and efficient for selling its
products and services for generates high level of profit (Brigham and Ehrhardt, 2013). There are
different profitability ratios are used by the management of Zurich Plc using income statement.
These are like as gross profit, net yield as well as operating income. Various ratios of profit for
the Zurich Plc are computed as below:
Table 1: Computation of profitability ratios
Name of ratios Formula 2015 (in £000) 2016 (in £000)
3
Document Page
Gross income 7382 5825
Operating income 2582 1783
Net income 972.84 570.17
Net sales 18920 16243
Gross profit ratio Gross income / net sales * 100 39.02% 35.86%
Operating profit ratio Operating income / net sales * 100 13.65% 10.98%
Net profit ratio Net income / net sales * 100 5.14% 3.51%
Liquidity ratio
Another financial ratios and liquidity which shows ability of the entity in terms of meet
with the short term obligations which are taken from external financing sources. It includes
mainly two kinds of ratios such as current and acid test or quick ratio. As the value of such ratios
comes higher, then it can be said that Zurich Plc performing well in the industry (Petty and et.al.,
2015). Further, calculation of liquidity ratios for the entity Zurich Plc is as below:
Table 2: Computation of liquidity ratios
Name of ratios Formula 2015 (in £000) 2016 (in £000)
Current assets 7006 6503
Current liabilities 24927.6 27528
Inventory 1320 1543
Prepaid expenses 0 0
Current ratio Current assets / current liabilities 0.28:1 0.24:1
Quick ratio Current assets – (inventory + prepaid 0.23:1 0.18:1
4
Document Page
expenses) / current liabilities
Gearing ratios
As per the ratio it helps to the firm in order to determine level of long term debt that it has
how much debt as compare to the equity share capital. Apart from this it helps to know that firm
is how much able pay cost of debt using operating profit in a fiscal year. Most widely used ratio
of gearing is debt to equity where Zurich Plc can easily determine that it has appropriate capital
structure or not (Financial Ratio Analysis, 2017). Another kind of gearing ratio is interest
coverage which helps to know that it how much able to pay interest amount from the operating
profit generated by it. Such both the ratios for Zurich Plc are stated as below:
Table 3: Computation of gearing ratios
Name of ratios Formula 2015 (in £000) 2016 (in £000)
Debt 2130 3578
Equity 19635.16 20108
Debt to equity ratio Debt / equity 0.11 0.18
EBIT 2582 1783
Interest expenses 1130 932
Interest coverage ratio EBIT / expenses on interest 2.28 1.91
Asset utilization ratios
Financial ratios which help to the management to derive efficiency of the firm in terms of
generating sales and revenue by utilizing fixed and total assets are known as asset utilization
ratios. When the ratios are higher, then it clearly indicates that management of Zurich Plc is
highly efficient for proper utilizing assets which it has in the firm (Hendriks, 2013). Different
5
tabler-icon-diamond-filled.svg

Paraphrase This Document

Need a fresh take? Get an instant paraphrase of this document with our AI Paraphraser
Document Page
ratios of such measurement are like as fixed and total assets turnover ratio which are computed
for Zurich Plc are as follows:
Table 4: Computation of asset utilization ratios
Name of ratios Formula 2015 (in £000) 2016 (in £000)
Net sales 18920 16243
Fixed assets 20331.6 25726
Fixed assets turnover ratio Net sales / fixed assets 0.93 0.63
Net sales 18920 16243
Total assets 27337.6 32229
Total assets turnover ratio Net sales / total assets 0.69 0.50
Investor ratios
Moreover, the ratios which are most helpful for the investor and company both in terms
of knowing return of initial investment are identified as an investor ratios. Higher the outcome of
such ratios show that company is more able to give return of the investment which is made by
investors in the firm. It consists various ratios and among them here EPS and return on equity
ratio are selected by Zurich Plc (Finkler and et.al., 2016). On the basis of investor ratios people
are able to take decisions that whether they should invest money in it or not. Such ratios for
Zurich Plc are calculated as below:
Table 5: Computation of investor ratios
Name of ratios Formula 2015 (in £000) 2016 (in £000)
Net profit 972.84 570.17
6
Document Page
Number of shares
outstanding 12410 12410
Earning per share Net profit / EPS 0.08 0.05
Net profit 972.84 570.17
Shareholder's equity 19635.16 20108
Return on equity Net profit / shareholder's equity 0.05 0.03
To,
Board of Directors,
Zurich Plc.
Date: 20th March 2017
Profitability ratios:
Gross profit ratio:
2015 2016
34.00%
35.00%
36.00%
37.00%
38.00%
39.00%
40.00%
39.02%
35.86%
Illustration 1: GP ratio
Findings: From the above graph it can be analysed that gross profit ratio declines from 39.02%
to 35.86% from the financial year 2015 to 2016. The declining ratio is clearly indicates that
management of Zurich Plc has not control over the cost and expenses which occurs in goods
7
Document Page
sold. Here the company needs to take and frame those kinds of strategies which helps to control
on the expenses. In the year 2015 the management was able to sale more number of products in
comparison to the fiscal year 2016.
Operating profit ratio:
2015 2016
0.00%
2.00%
4.00%
6.00%
8.00%
10.00%
12.00%
14.00%
16.00%
13.65%
10.98%
Illustration 2: OP ratio
Findings: It can be analysed from the operating profit ratio that, in the year 2015 it was 13.65%
which reduce in further year and comes up to 10.98% which is the worse situation for Zurich
Plc. For calculating OP ratio all the operating expenses incurred in business process are to be
used such as production, selling and distribution, labour, material, utility, maintenance etc. It
can be said from the respective ratio that Zurich Plc is not able to reduce various kinds of such
mentioned costs by which operating profit reduces in the year 2016.
Net profit ratio:
8
tabler-icon-diamond-filled.svg

Paraphrase This Document

Need a fresh take? Get an instant paraphrase of this document with our AI Paraphraser
Document Page
2015 2016
0.00%
1.00%
2.00%
3.00%
4.00%
5.00%
6.00%
5.14%
3.51%
Illustration 3: NP ratio
Findings: Another kind of profitability ratio is net profit which is declines from 5.14% to
3.51% which is the adverse situation and shows that financial performance of Zurich Plc
reduces from the year 2015 to 2016. Lower the net profit ratio shows that Zurich Plc is not able
to control over the indirect expenses like as interest, depreciation, rent, insurance etc. In order to
combat and increase net profit ratio the Zurich Plc needs to reduce debt amount and control to
the indirect expenditures incur in business process.
Liquidity ratio:
Current ratio
2015 2016
0.21
0.22
0.23
0.24
0.25
0.26
0.27
0.28
0.29
0.28
0.24
Illustration 4: Current ratio
Findings: Key ratio of liquidity is current which was 0.28:1 in the fiscal year 2015 and in the
9
Document Page
next year i.e. 2016 it goes down up to 0.24:1. The current ratio clearly indicates that Zurich Plc
has higher amount of debt and lower profit in the financial year 2016 as compare to 2015 by
which it cannot meet with short term debts. Along with this as per the standard ratio 2:1
business performance of Zurich Plc is very poor and hamper overall financial performance. It
can be said from the ratio that in order to fulfil 1 liability it has only 0.24 current asset which is
very poor for Zurich Plc. It needs to increase profit at the end of year and enhance current
assets.
Quick ratio
2015 2016
0
0.05
0.1
0.15
0.2
0.25 0.23
0.18
Illustration 5: Quick ratio
Findings: Reducing quick ratio indicates cash convertible assets are very low in the year 2016
as compare to year 2015. At the current, acid test ratio of Zurich Plc is 0.18:1 and in the past
accounting year it was 0.23:1 which is declining. It shows that management of the firm is not
able to pay short term debts in favourable way which lead to reduce liquid position at the end of
year 2016. Here it is very necessary for managers of Zurich Plc in order to generate high level
of net profit and reduce long term and short term debt. On the basis of overall liquidity ratios
the business performance of Zurich Plc is very poor in the overall manufacturing industry.
Gearing ratios:
Debt to equity ratio:
10
chevron_up_icon
1 out of 27
circle_padding
hide_on_mobile
zoom_out_icon
[object Object]