PGBM12 Financial Analysis: Zurich Plc's Financial Performance
VerifiedAdded on 2023/06/11
|22
|4315
|262
Report
AI Summary
This report provides a comprehensive financial analysis of Zurich Plc, a company specializing in manufacturing and distributing office equipment, for the financial years 2015 and 2016. The analysis utilizes five categories of financial ratios – liquidity, gearing, asset utilization, profitability, and market value – to assess the company's short-term and long-term solvency, efficiency, and profitability. The liquidity ratios indicate a stable short-term solvency position, while gearing ratios suggest a sound long-term financial standing. Asset utilization ratios reveal commendable efficiency and productivity. However, profitability ratios indicate a decline in net profit, revenue, and total assets in 2016 compared to 2015, and market value ratios reflect a similar downturn. The report also addresses the limitations of ratio analysis and recommends that Zurich Plc consider non-financial factors in decision-making. Part B includes calculations using different appraisal techniques for Johnson Ltd.
RUNNING HEAD: FINANCIAL MANAGEMENT
FINANCIAL MANAGEMENT
FINANCIAL MANAGEMENT
Paraphrase This Document
Need a fresh take? Get an instant paraphrase of this document with our AI Paraphraser

FINANCIAL MANAGEMENT 1
Contents
PART A...................................................................................................................................................2
PART B.................................................................................................................................................10
REFERENCES........................................................................................................................................20
FINANCIAL MANAGEMENT 2
PART A
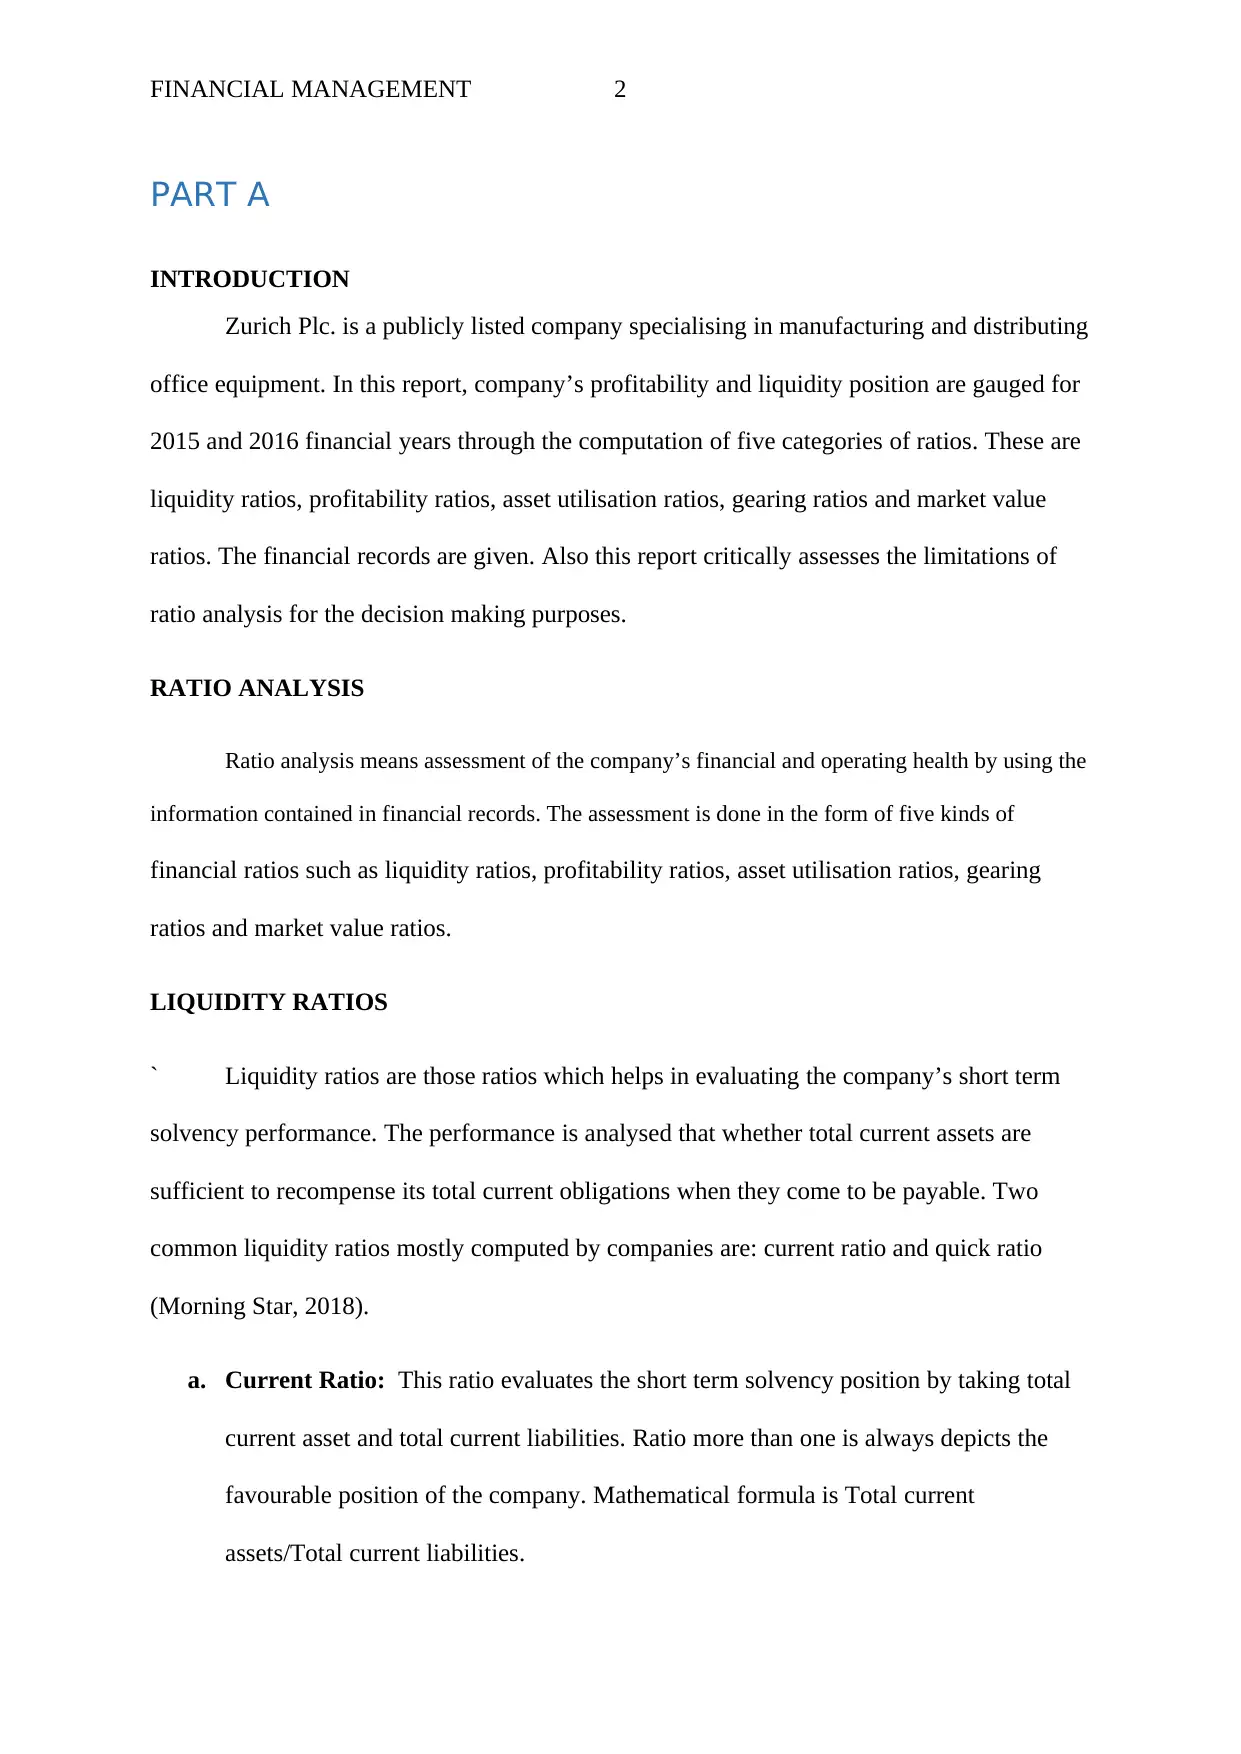
INTRODUCTION
Zurich Plc. is a publicly listed company specialising in manufacturing and distributing
office equipment. In this report, company’s profitability and liquidity position are gauged for
2015 and 2016 financial years through the computation of five categories of ratios. These are
liquidity ratios, profitability ratios, asset utilisation ratios, gearing ratios and market value
ratios. The financial records are given. Also this report critically assesses the limitations of
ratio analysis for the decision making purposes.
RATIO ANALYSIS
Ratio analysis means assessment of the company’s financial and operating health by using the
information contained in financial records. The assessment is done in the form of five kinds of
financial ratios such as liquidity ratios, profitability ratios, asset utilisation ratios, gearing
ratios and market value ratios.
LIQUIDITY RATIOS
` Liquidity ratios are those ratios which helps in evaluating the company’s short term
solvency performance. The performance is analysed that whether total current assets are
sufficient to recompense its total current obligations when they come to be payable. Two
common liquidity ratios mostly computed by companies are: current ratio and quick ratio
(Morning Star, 2018).
a. Current Ratio: This ratio evaluates the short term solvency position by taking total
current asset and total current liabilities. Ratio more than one is always depicts the
favourable position of the company. Mathematical formula is Total current
assets/Total current liabilities.
PART A
INTRODUCTION
Zurich Plc. is a publicly listed company specialising in manufacturing and distributing
office equipment. In this report, company’s profitability and liquidity position are gauged for
2015 and 2016 financial years through the computation of five categories of ratios. These are
liquidity ratios, profitability ratios, asset utilisation ratios, gearing ratios and market value
ratios. The financial records are given. Also this report critically assesses the limitations of
ratio analysis for the decision making purposes.
RATIO ANALYSIS
Ratio analysis means assessment of the company’s financial and operating health by using the
information contained in financial records. The assessment is done in the form of five kinds of
financial ratios such as liquidity ratios, profitability ratios, asset utilisation ratios, gearing
ratios and market value ratios.
LIQUIDITY RATIOS
` Liquidity ratios are those ratios which helps in evaluating the company’s short term
solvency performance. The performance is analysed that whether total current assets are
sufficient to recompense its total current obligations when they come to be payable. Two
common liquidity ratios mostly computed by companies are: current ratio and quick ratio
(Morning Star, 2018).
a. Current Ratio: This ratio evaluates the short term solvency position by taking total
current asset and total current liabilities. Ratio more than one is always depicts the
favourable position of the company. Mathematical formula is Total current
assets/Total current liabilities.
⊘ This is a preview!⊘
Do you want full access?
Subscribe today to unlock all pages.
Trusted by 1+ million students worldwide
FINANCIAL MANAGEMENT 3
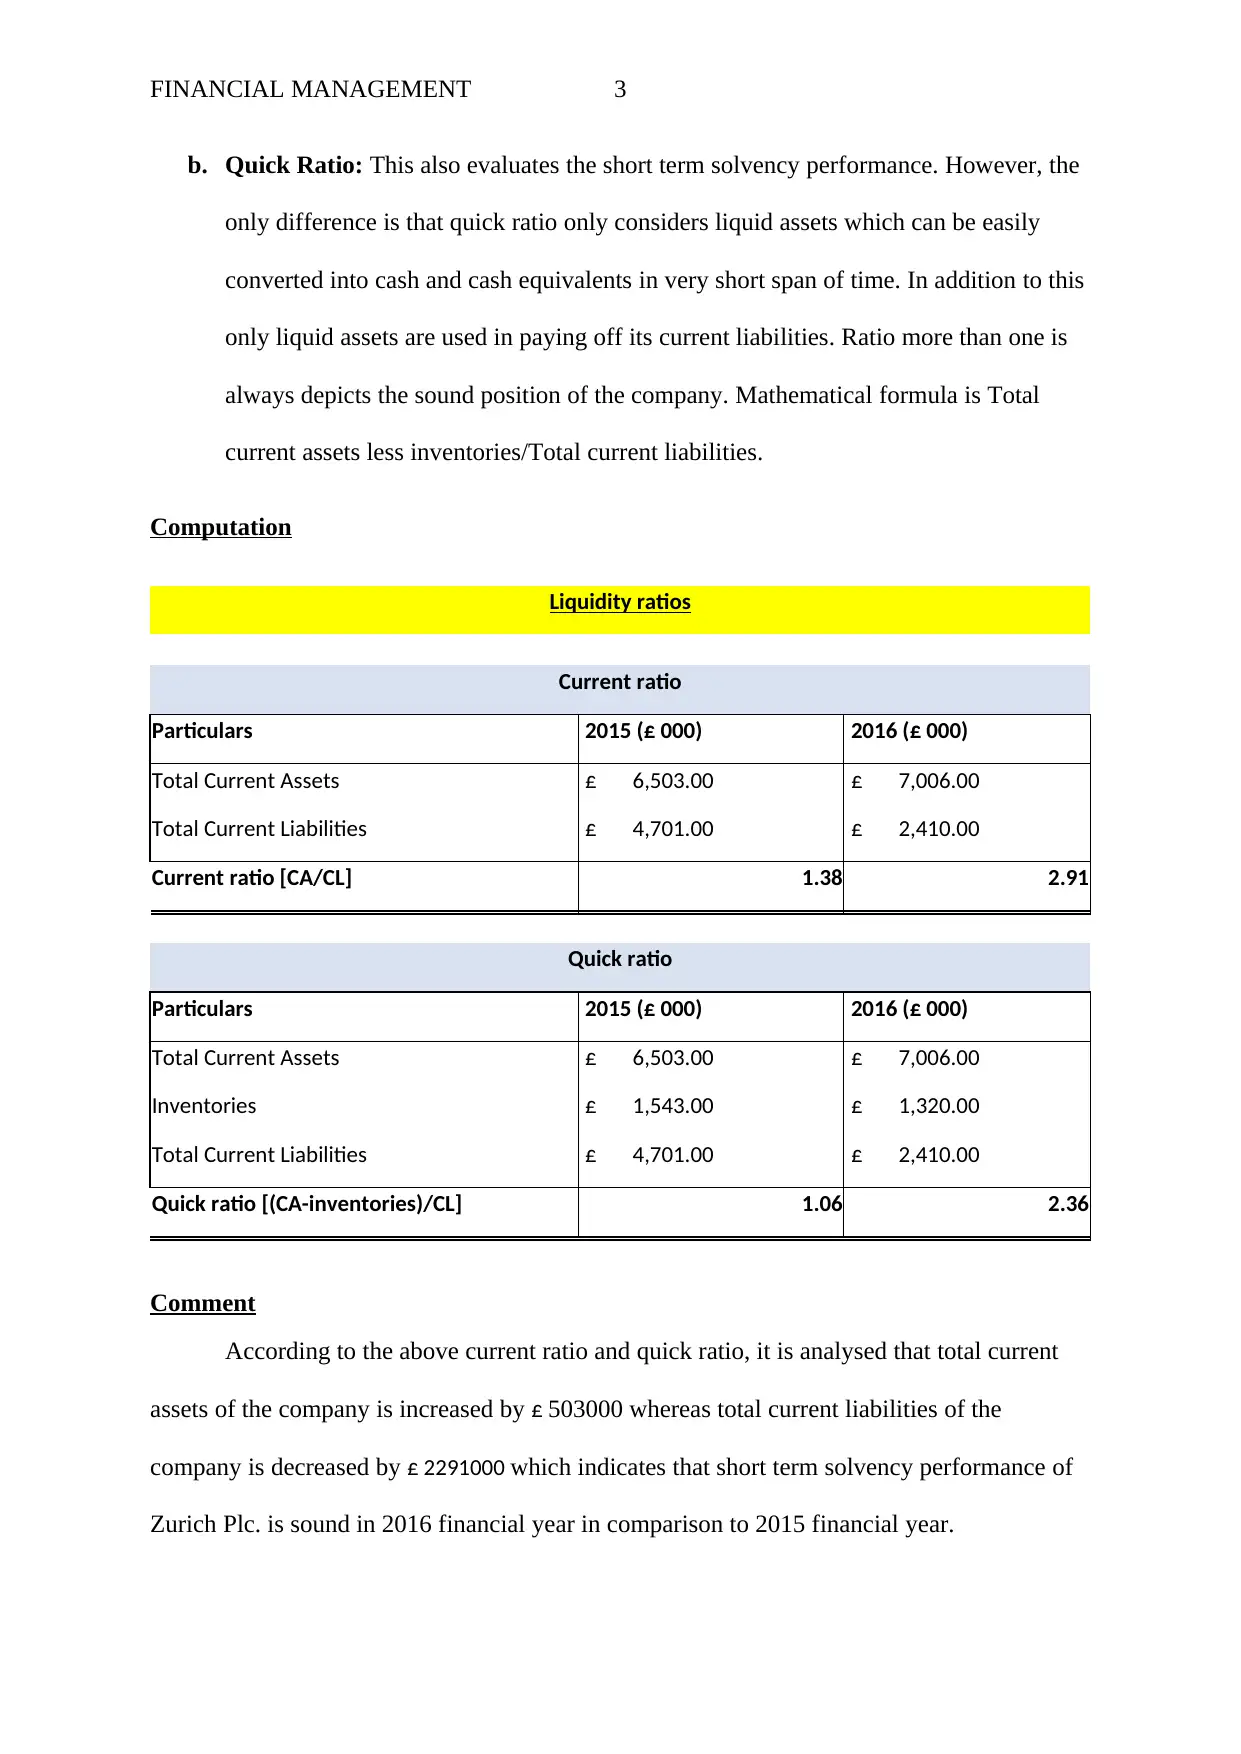
b. Quick Ratio: This also evaluates the short term solvency performance. However, the
only difference is that quick ratio only considers liquid assets which can be easily
converted into cash and cash equivalents in very short span of time. In addition to this
only liquid assets are used in paying off its current liabilities. Ratio more than one is
always depicts the sound position of the company. Mathematical formula is Total
current assets less inventories/Total current liabilities.
Computation
Liquidity ratios
Current ratio
Particulars 2015 (£ 000) 2016 (£ 000)
Total Current Assets £ 6,503.00 £ 7,006.00
Total Current Liabilities £ 4,701.00 £ 2,410.00
Current ratio [CA/CL] 1.38 2.91
Quick ratio
Particulars 2015 (£ 000) 2016 (£ 000)
Total Current Assets £ 6,503.00 £ 7,006.00
Inventories £ 1,543.00 £ 1,320.00
Total Current Liabilities £ 4,701.00 £ 2,410.00
Quick ratio [(CA-inventories)/CL] 1.06 2.36
Comment
According to the above current ratio and quick ratio, it is analysed that total current
assets of the company is increased by £ 503000 whereas total current liabilities of the
company is decreased by £ 2291000 which indicates that short term solvency performance of
Zurich Plc. is sound in 2016 financial year in comparison to 2015 financial year.
Paraphrase This Document
Need a fresh take? Get an instant paraphrase of this document with our AI Paraphraser
FINANCIAL MANAGEMENT 4
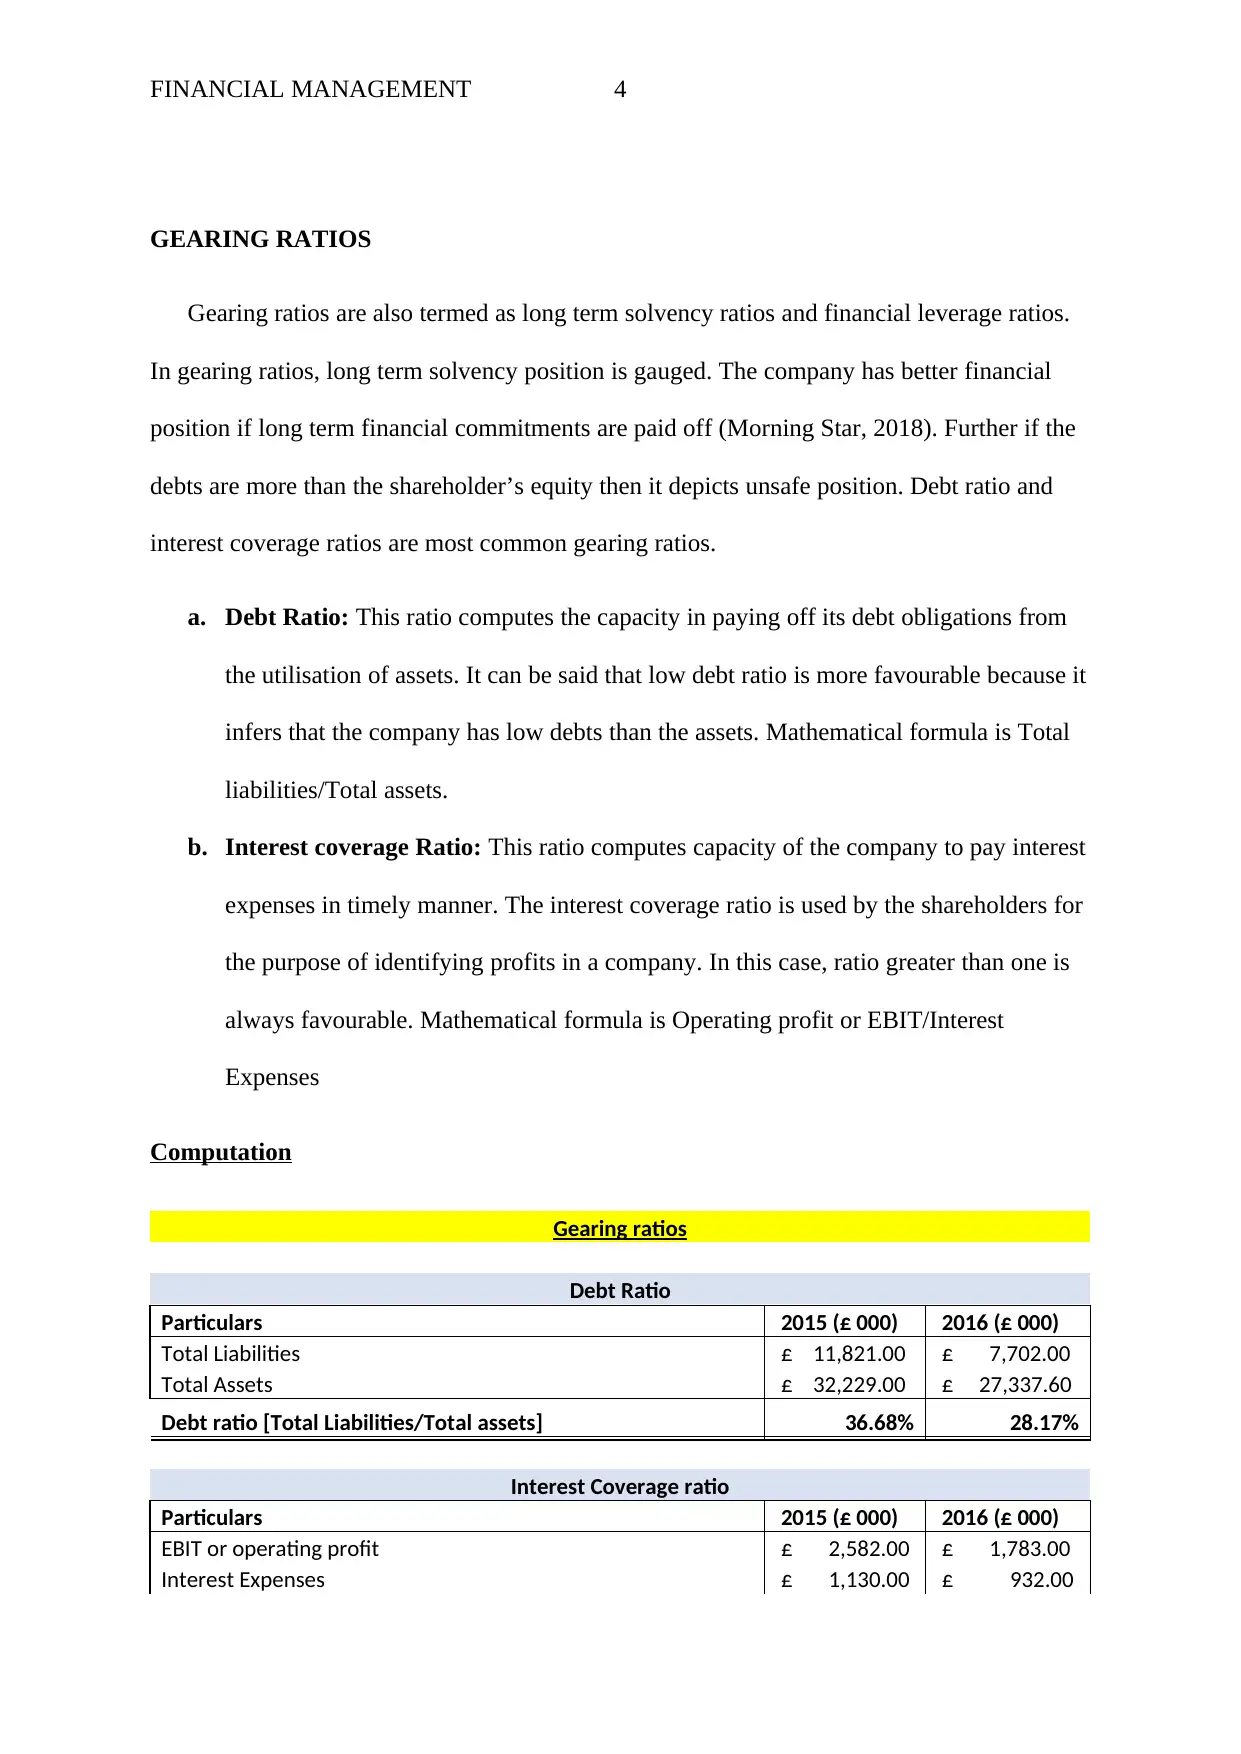
GEARING RATIOS
Gearing ratios are also termed as long term solvency ratios and financial leverage ratios.
In gearing ratios, long term solvency position is gauged. The company has better financial
position if long term financial commitments are paid off (Morning Star, 2018). Further if the
debts are more than the shareholder’s equity then it depicts unsafe position. Debt ratio and
interest coverage ratios are most common gearing ratios.
a. Debt Ratio: This ratio computes the capacity in paying off its debt obligations from
the utilisation of assets. It can be said that low debt ratio is more favourable because it
infers that the company has low debts than the assets. Mathematical formula is Total
liabilities/Total assets.
b. Interest coverage Ratio: This ratio computes capacity of the company to pay interest
expenses in timely manner. The interest coverage ratio is used by the shareholders for
the purpose of identifying profits in a company. In this case, ratio greater than one is
always favourable. Mathematical formula is Operating profit or EBIT/Interest
Expenses
Computation
Gearing ratios
Debt Ratio
Particulars 2015 (£ 000) 2016 (£ 000)
Total Liabilities £ 11,821.00 £ 7,702.00
Total Assets £ 32,229.00 £ 27,337.60
Debt ratio [Total Liabilities/Total assets] 36.68% 28.17%
Interest Coverage ratio
Particulars 2015 (£ 000) 2016 (£ 000)
EBIT or operating profit £ 2,582.00 £ 1,783.00
Interest Expenses £ 1,130.00 £ 932.00
FINANCIAL MANAGEMENT 5
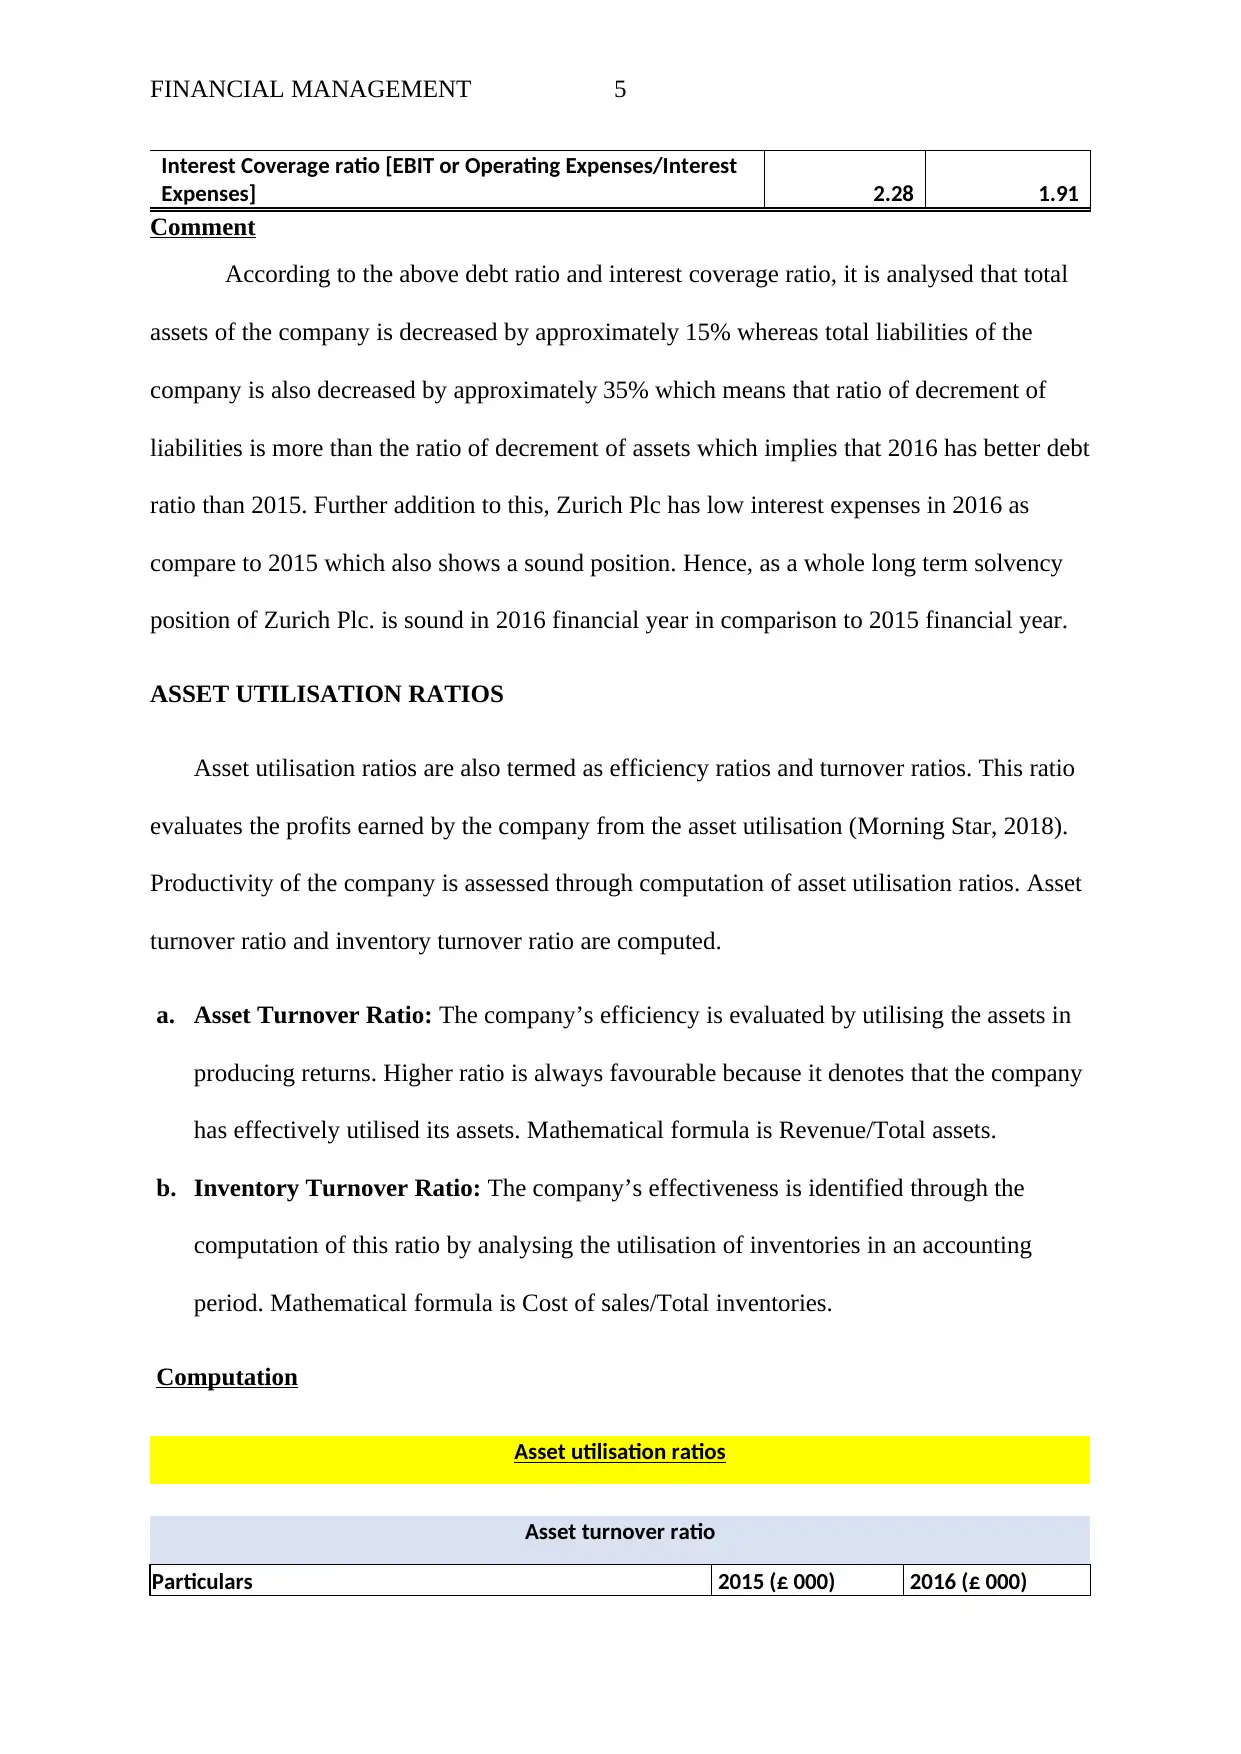
Interest Coverage ratio [EBIT or Operating Expenses/Interest
Expenses] 2.28 1.91
Comment
According to the above debt ratio and interest coverage ratio, it is analysed that total
assets of the company is decreased by approximately 15% whereas total liabilities of the
company is also decreased by approximately 35% which means that ratio of decrement of
liabilities is more than the ratio of decrement of assets which implies that 2016 has better debt
ratio than 2015. Further addition to this, Zurich Plc has low interest expenses in 2016 as
compare to 2015 which also shows a sound position. Hence, as a whole long term solvency
position of Zurich Plc. is sound in 2016 financial year in comparison to 2015 financial year.
ASSET UTILISATION RATIOS
Asset utilisation ratios are also termed as efficiency ratios and turnover ratios. This ratio
evaluates the profits earned by the company from the asset utilisation (Morning Star, 2018).
Productivity of the company is assessed through computation of asset utilisation ratios. Asset
turnover ratio and inventory turnover ratio are computed.
a. Asset Turnover Ratio: The company’s efficiency is evaluated by utilising the assets in
producing returns. Higher ratio is always favourable because it denotes that the company
has effectively utilised its assets. Mathematical formula is Revenue/Total assets.
b. Inventory Turnover Ratio: The company’s effectiveness is identified through the
computation of this ratio by analysing the utilisation of inventories in an accounting
period. Mathematical formula is Cost of sales/Total inventories.
Computation
Asset utilisation ratios
Asset turnover ratio
Particulars 2015 (£ 000) 2016 (£ 000)
⊘ This is a preview!⊘
Do you want full access?
Subscribe today to unlock all pages.
Trusted by 1+ million students worldwide
FINANCIAL MANAGEMENT 6
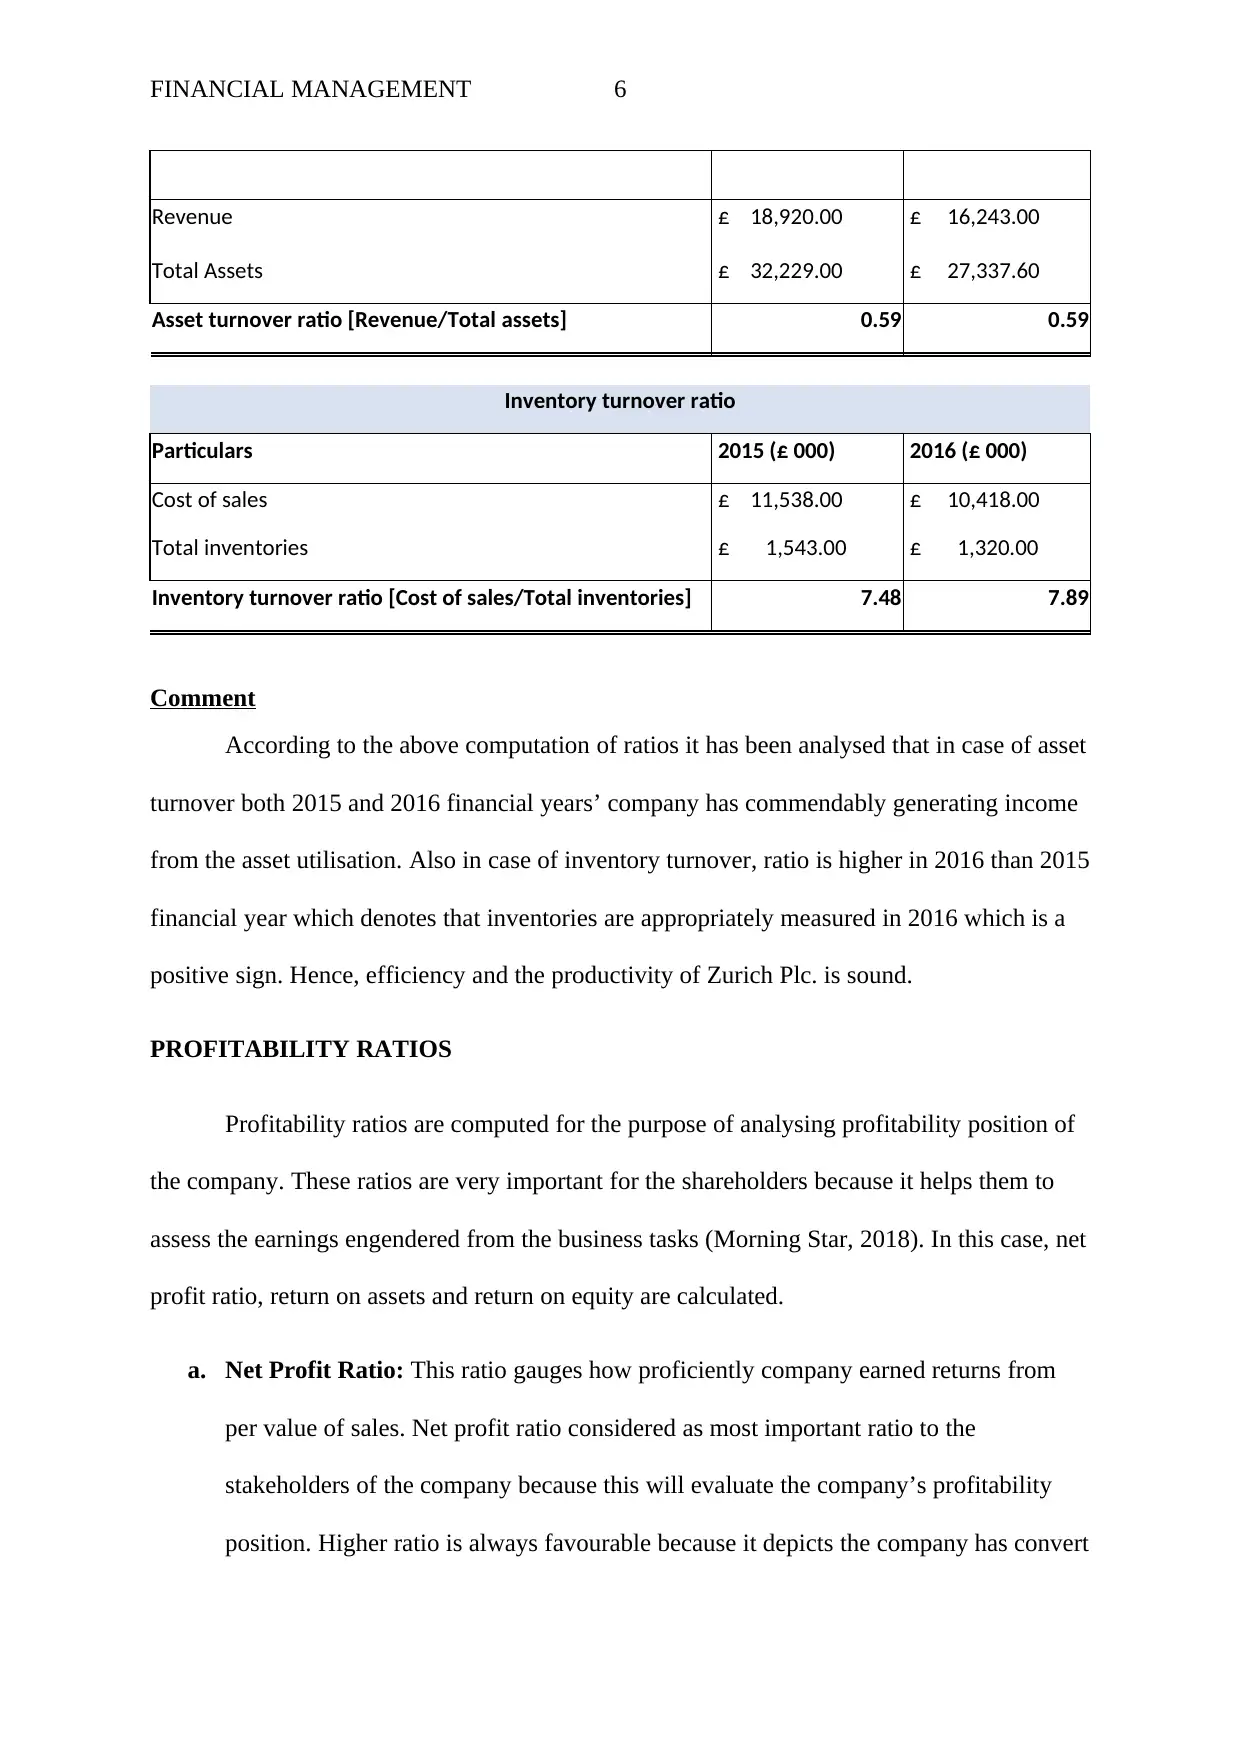
Revenue £ 18,920.00 £ 16,243.00
Total Assets £ 32,229.00 £ 27,337.60
Asset turnover ratio [Revenue/Total assets] 0.59 0.59
Inventory turnover ratio
Particulars 2015 (£ 000) 2016 (£ 000)
Cost of sales £ 11,538.00 £ 10,418.00
Total inventories £ 1,543.00 £ 1,320.00
Inventory turnover ratio [Cost of sales/Total inventories] 7.48 7.89
Comment
According to the above computation of ratios it has been analysed that in case of asset
turnover both 2015 and 2016 financial years’ company has commendably generating income
from the asset utilisation. Also in case of inventory turnover, ratio is higher in 2016 than 2015
financial year which denotes that inventories are appropriately measured in 2016 which is a
positive sign. Hence, efficiency and the productivity of Zurich Plc. is sound.
PROFITABILITY RATIOS
Profitability ratios are computed for the purpose of analysing profitability position of
the company. These ratios are very important for the shareholders because it helps them to
assess the earnings engendered from the business tasks (Morning Star, 2018). In this case, net
profit ratio, return on assets and return on equity are calculated.
a. Net Profit Ratio: This ratio gauges how proficiently company earned returns from
per value of sales. Net profit ratio considered as most important ratio to the
stakeholders of the company because this will evaluate the company’s profitability
position. Higher ratio is always favourable because it depicts the company has convert
Paraphrase This Document
Need a fresh take? Get an instant paraphrase of this document with our AI Paraphraser
FINANCIAL MANAGEMENT 7
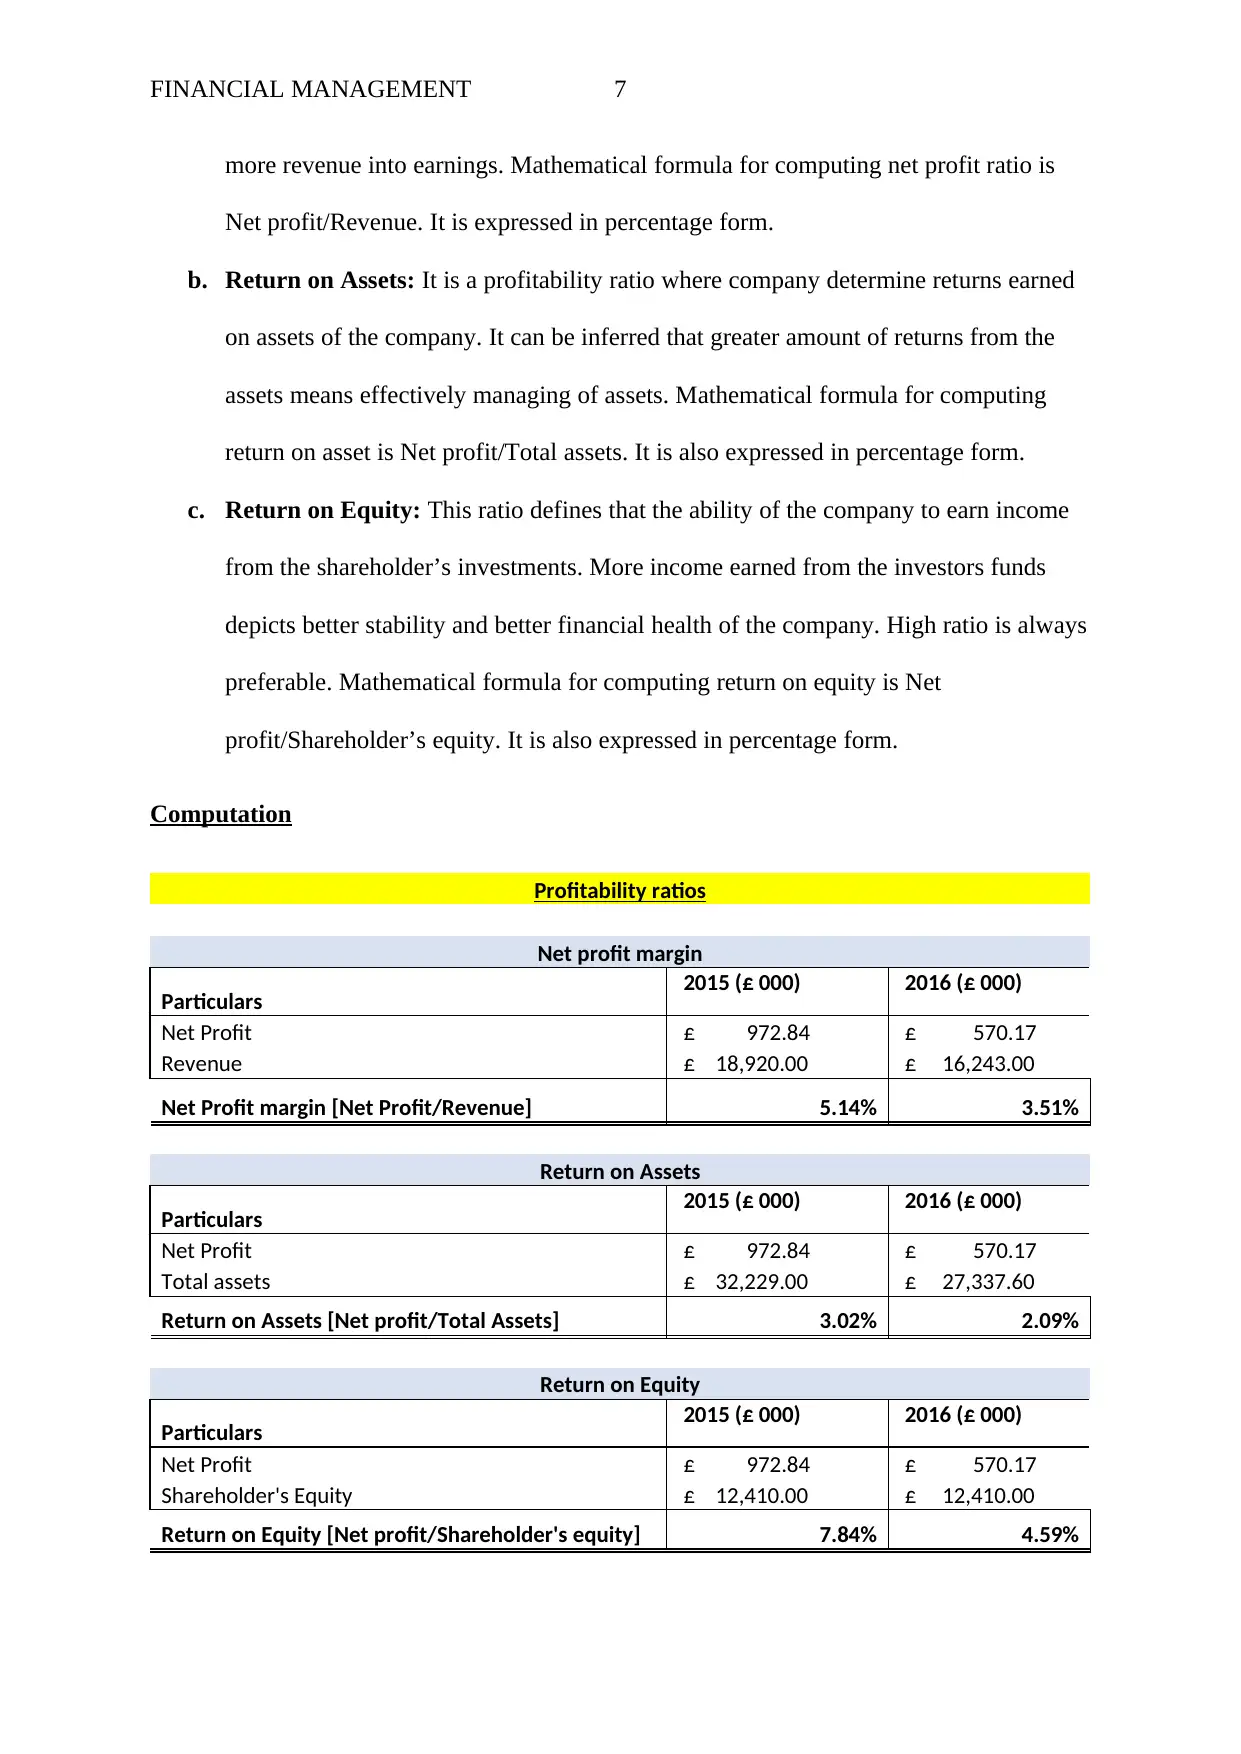
more revenue into earnings. Mathematical formula for computing net profit ratio is
Net profit/Revenue. It is expressed in percentage form.
b. Return on Assets: It is a profitability ratio where company determine returns earned
on assets of the company. It can be inferred that greater amount of returns from the
assets means effectively managing of assets. Mathematical formula for computing
return on asset is Net profit/Total assets. It is also expressed in percentage form.
c. Return on Equity: This ratio defines that the ability of the company to earn income
from the shareholder’s investments. More income earned from the investors funds
depicts better stability and better financial health of the company. High ratio is always
preferable. Mathematical formula for computing return on equity is Net
profit/Shareholder’s equity. It is also expressed in percentage form.
Computation
Profitability ratios
Net profit margin
Particulars 2015 (£ 000) 2016 (£ 000)
Net Profit £ 972.84 £ 570.17
Revenue £ 18,920.00 £ 16,243.00
Net Profit margin [Net Profit/Revenue] 5.14% 3.51%
Return on Assets
Particulars 2015 (£ 000) 2016 (£ 000)
Net Profit £ 972.84 £ 570.17
Total assets £ 32,229.00 £ 27,337.60
Return on Assets [Net profit/Total Assets] 3.02% 2.09%
Return on Equity
Particulars 2015 (£ 000) 2016 (£ 000)
Net Profit £ 972.84 £ 570.17
Shareholder's Equity £ 12,410.00 £ 12,410.00
Return on Equity [Net profit/Shareholder's equity] 7.84% 4.59%
FINANCIAL MANAGEMENT 8
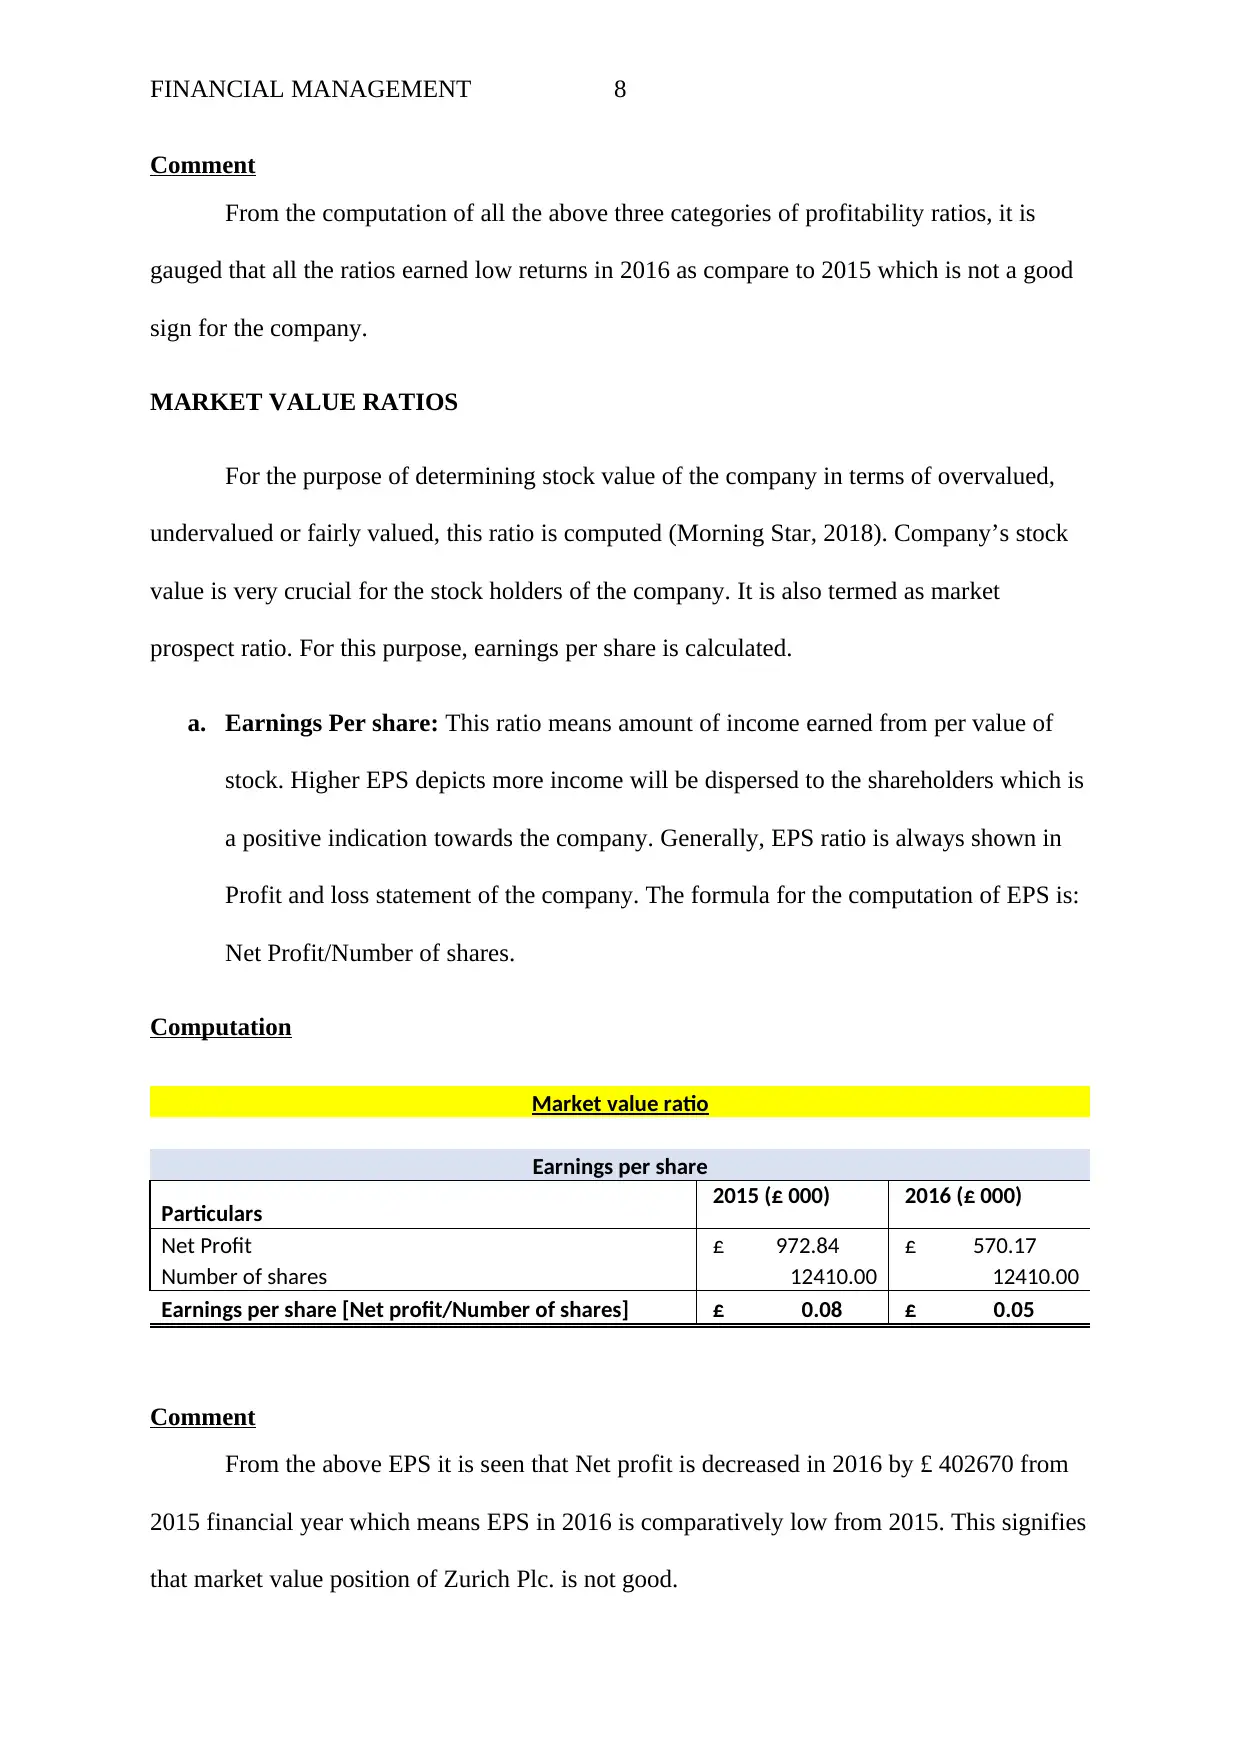
Comment
From the computation of all the above three categories of profitability ratios, it is
gauged that all the ratios earned low returns in 2016 as compare to 2015 which is not a good
sign for the company.
MARKET VALUE RATIOS
For the purpose of determining stock value of the company in terms of overvalued,
undervalued or fairly valued, this ratio is computed (Morning Star, 2018). Company’s stock
value is very crucial for the stock holders of the company. It is also termed as market
prospect ratio. For this purpose, earnings per share is calculated.
a. Earnings Per share: This ratio means amount of income earned from per value of
stock. Higher EPS depicts more income will be dispersed to the shareholders which is
a positive indication towards the company. Generally, EPS ratio is always shown in
Profit and loss statement of the company. The formula for the computation of EPS is:
Net Profit/Number of shares.
Computation
Market value ratio
Earnings per share
Particulars 2015 (£ 000) 2016 (£ 000)
Net Profit £ 972.84 £ 570.17
Number of shares 12410.00 12410.00
Earnings per share [Net profit/Number of shares] £ 0.08 £ 0.05
Comment
From the above EPS it is seen that Net profit is decreased in 2016 by £ 402670 from
2015 financial year which means EPS in 2016 is comparatively low from 2015. This signifies
that market value position of Zurich Plc. is not good.
Comment
From the computation of all the above three categories of profitability ratios, it is
gauged that all the ratios earned low returns in 2016 as compare to 2015 which is not a good
sign for the company.
MARKET VALUE RATIOS
For the purpose of determining stock value of the company in terms of overvalued,
undervalued or fairly valued, this ratio is computed (Morning Star, 2018). Company’s stock
value is very crucial for the stock holders of the company. It is also termed as market
prospect ratio. For this purpose, earnings per share is calculated.
a. Earnings Per share: This ratio means amount of income earned from per value of
stock. Higher EPS depicts more income will be dispersed to the shareholders which is
a positive indication towards the company. Generally, EPS ratio is always shown in
Profit and loss statement of the company. The formula for the computation of EPS is:
Net Profit/Number of shares.
Computation
Market value ratio
Earnings per share
Particulars 2015 (£ 000) 2016 (£ 000)
Net Profit £ 972.84 £ 570.17
Number of shares 12410.00 12410.00
Earnings per share [Net profit/Number of shares] £ 0.08 £ 0.05
Comment
From the above EPS it is seen that Net profit is decreased in 2016 by £ 402670 from
2015 financial year which means EPS in 2016 is comparatively low from 2015. This signifies
that market value position of Zurich Plc. is not good.
⊘ This is a preview!⊘
Do you want full access?
Subscribe today to unlock all pages.
Trusted by 1+ million students worldwide
FINANCIAL MANAGEMENT 9
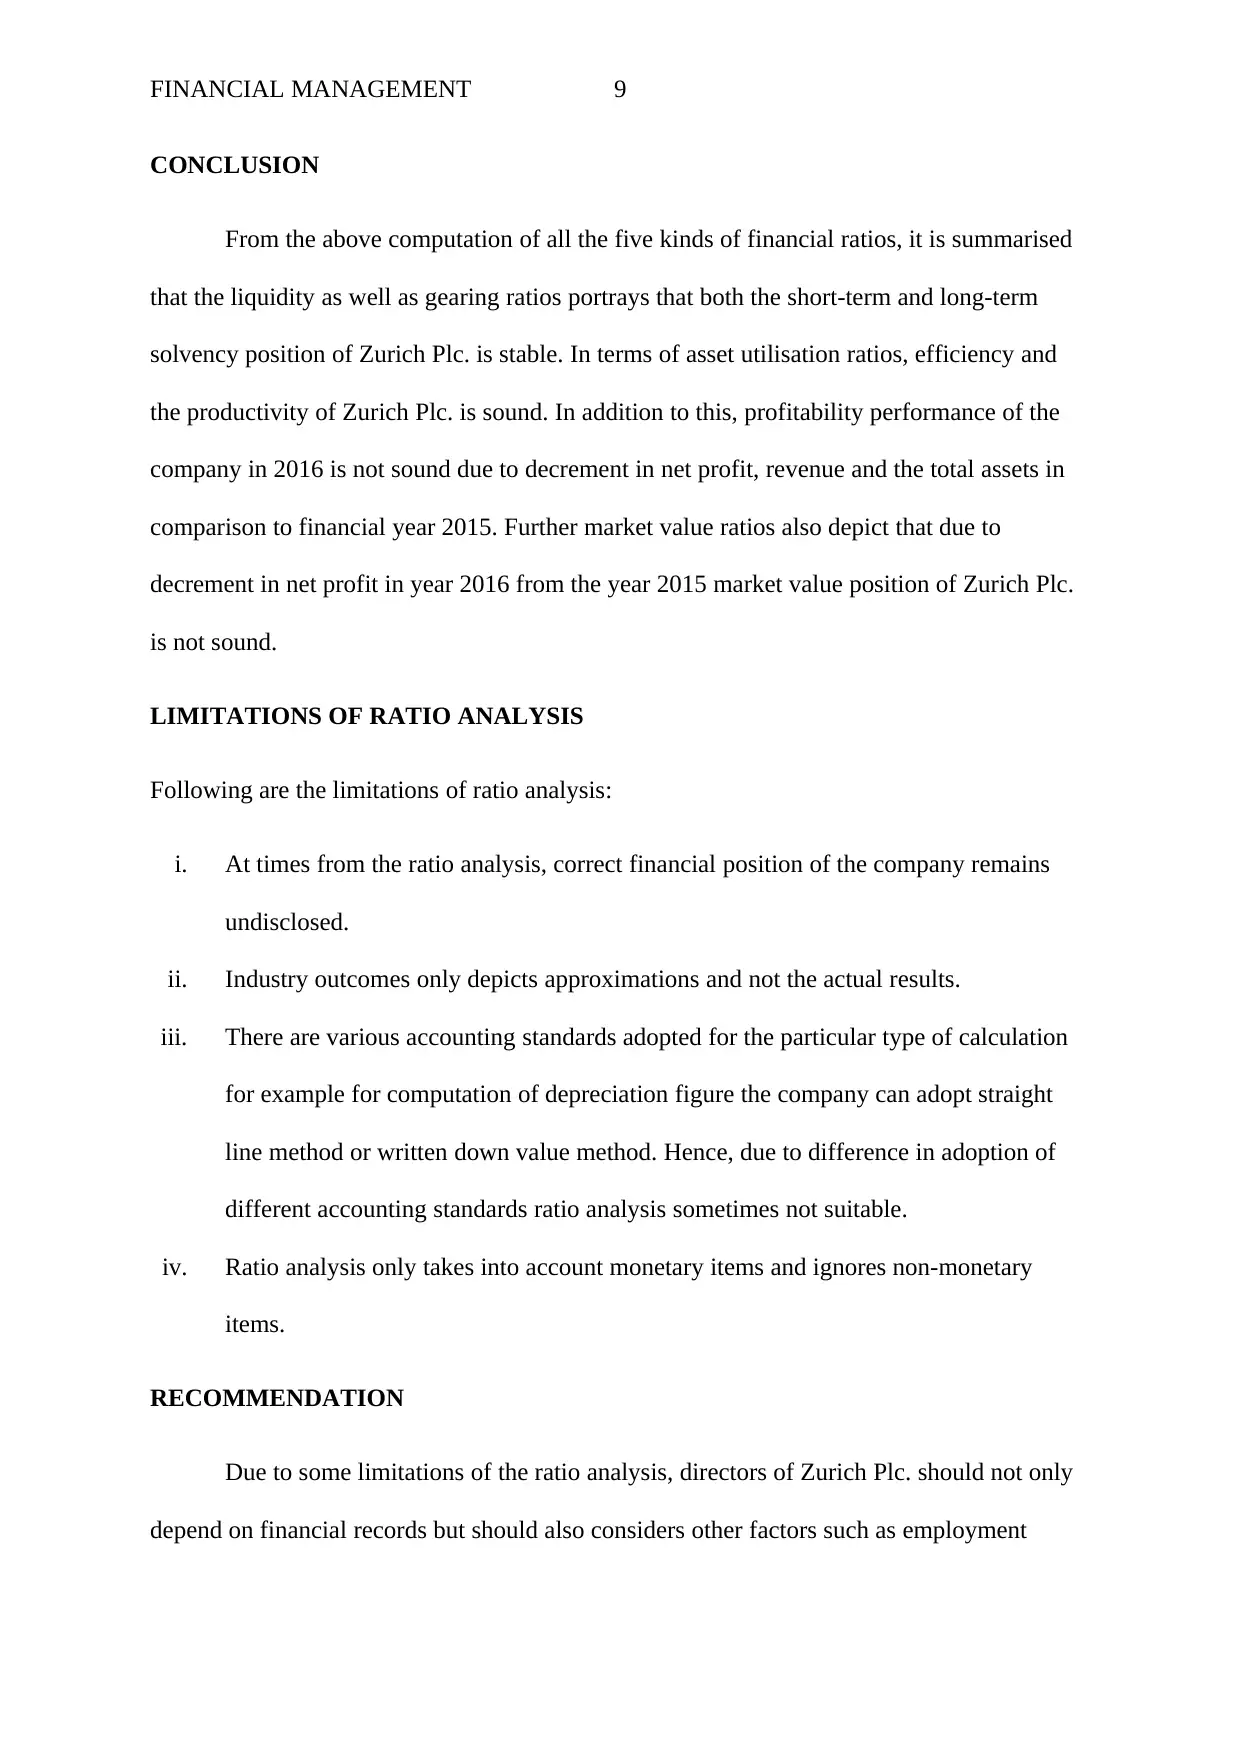
CONCLUSION
From the above computation of all the five kinds of financial ratios, it is summarised
that the liquidity as well as gearing ratios portrays that both the short-term and long-term
solvency position of Zurich Plc. is stable. In terms of asset utilisation ratios, efficiency and
the productivity of Zurich Plc. is sound. In addition to this, profitability performance of the
company in 2016 is not sound due to decrement in net profit, revenue and the total assets in
comparison to financial year 2015. Further market value ratios also depict that due to
decrement in net profit in year 2016 from the year 2015 market value position of Zurich Plc.
is not sound.
LIMITATIONS OF RATIO ANALYSIS
Following are the limitations of ratio analysis:
i. At times from the ratio analysis, correct financial position of the company remains
undisclosed.
ii. Industry outcomes only depicts approximations and not the actual results.
iii. There are various accounting standards adopted for the particular type of calculation
for example for computation of depreciation figure the company can adopt straight
line method or written down value method. Hence, due to difference in adoption of
different accounting standards ratio analysis sometimes not suitable.
iv. Ratio analysis only takes into account monetary items and ignores non-monetary
items.
RECOMMENDATION
Due to some limitations of the ratio analysis, directors of Zurich Plc. should not only
depend on financial records but should also considers other factors such as employment
Paraphrase This Document
Need a fresh take? Get an instant paraphrase of this document with our AI Paraphraser
FINANCIAL MANAGEMENT 10
welfare policies, customer satisfaction ratings, market value etc. for the purpose of decision
making about the company’s performance.
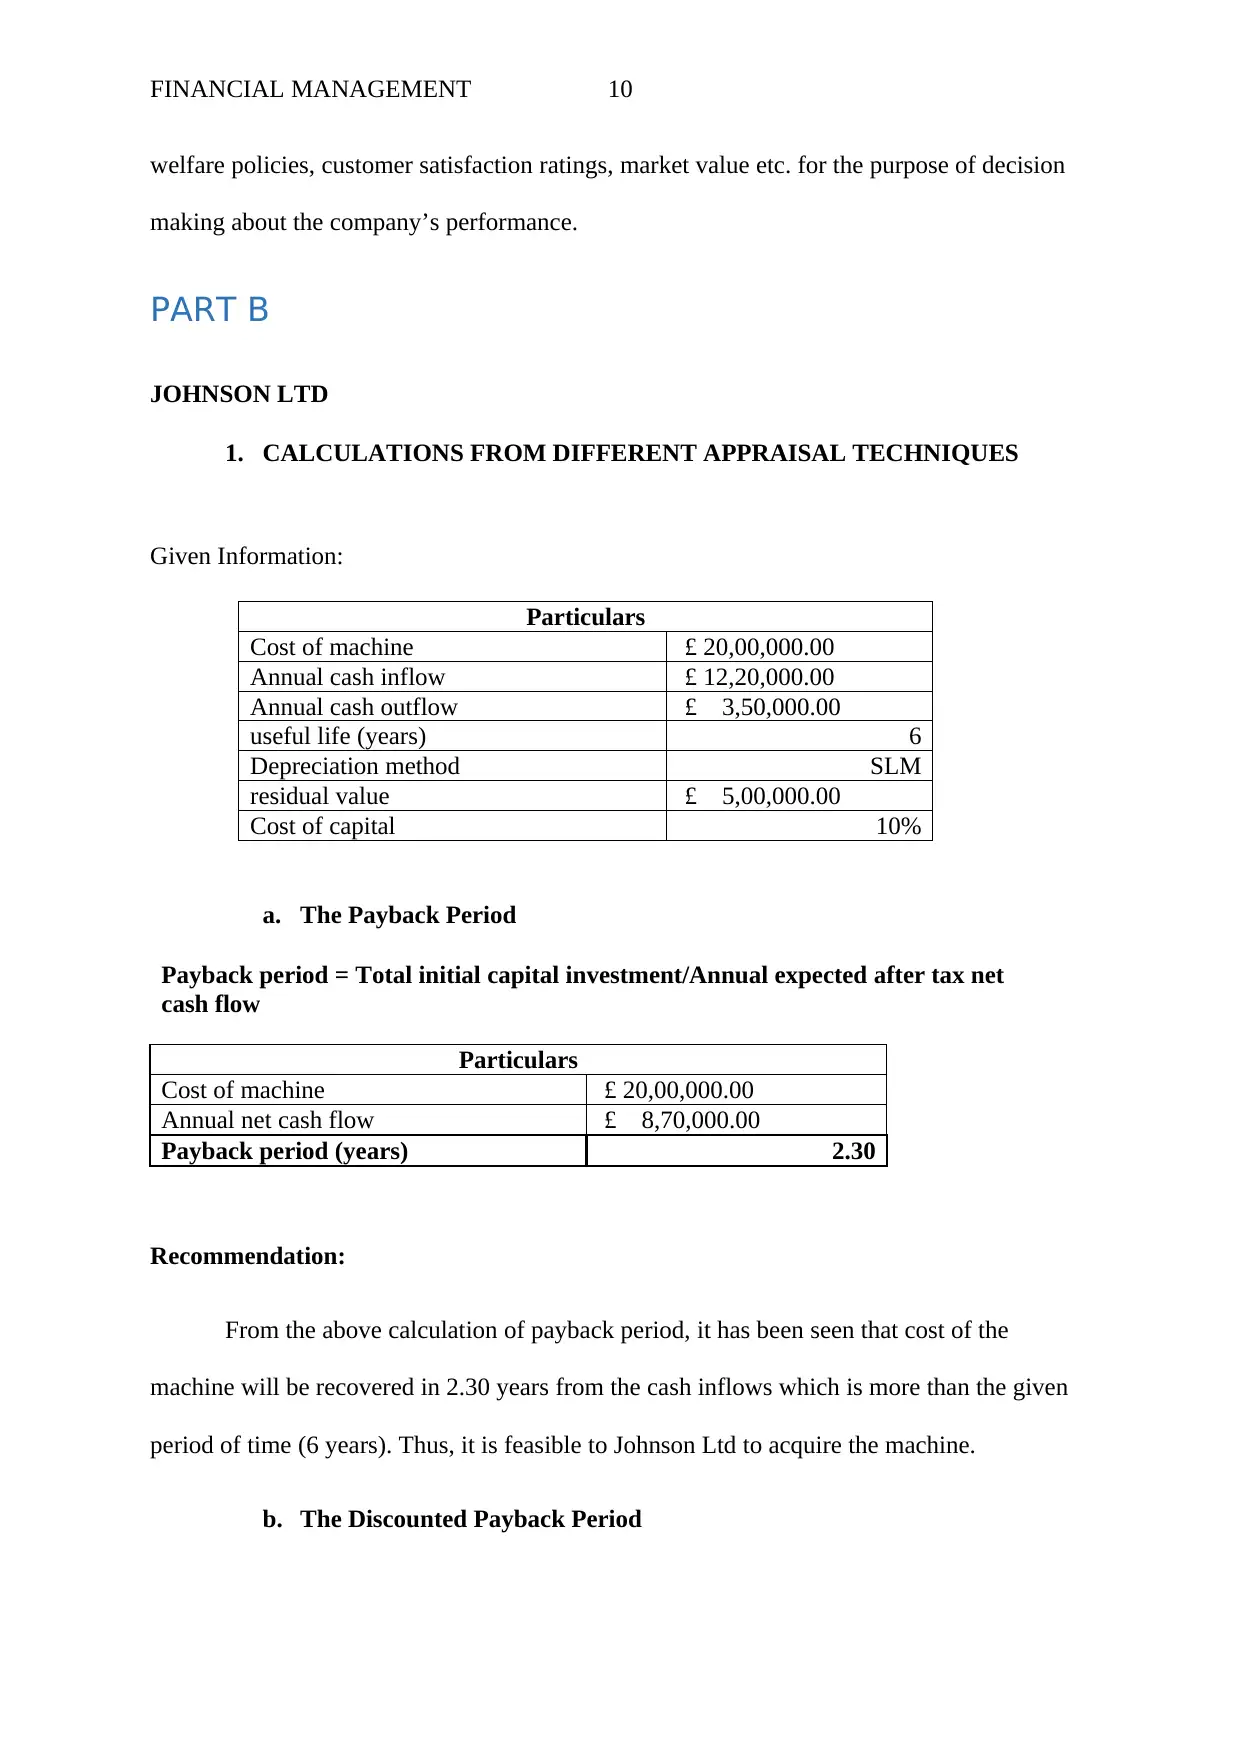
PART B
JOHNSON LTD
1. CALCULATIONS FROM DIFFERENT APPRAISAL TECHNIQUES
Given Information:
Particulars
Cost of machine £ 20,00,000.00
Annual cash inflow £ 12,20,000.00
Annual cash outflow £ 3,50,000.00
useful life (years) 6
Depreciation method SLM
residual value £ 5,00,000.00
Cost of capital 10%
a. The Payback Period
Payback period = Total initial capital investment/Annual expected after tax net
cash flow
Particulars
Cost of machine £ 20,00,000.00
Annual net cash flow £ 8,70,000.00
Payback period (years) 2.30
Recommendation:
From the above calculation of payback period, it has been seen that cost of the
machine will be recovered in 2.30 years from the cash inflows which is more than the given
period of time (6 years). Thus, it is feasible to Johnson Ltd to acquire the machine.
b. The Discounted Payback Period
welfare policies, customer satisfaction ratings, market value etc. for the purpose of decision
making about the company’s performance.
PART B
JOHNSON LTD
1. CALCULATIONS FROM DIFFERENT APPRAISAL TECHNIQUES
Given Information:
Particulars
Cost of machine £ 20,00,000.00
Annual cash inflow £ 12,20,000.00
Annual cash outflow £ 3,50,000.00
useful life (years) 6
Depreciation method SLM
residual value £ 5,00,000.00
Cost of capital 10%
a. The Payback Period
Payback period = Total initial capital investment/Annual expected after tax net
cash flow
Particulars
Cost of machine £ 20,00,000.00
Annual net cash flow £ 8,70,000.00
Payback period (years) 2.30
Recommendation:
From the above calculation of payback period, it has been seen that cost of the
machine will be recovered in 2.30 years from the cash inflows which is more than the given
period of time (6 years). Thus, it is feasible to Johnson Ltd to acquire the machine.
b. The Discounted Payback Period
FINANCIAL MANAGEMENT 11
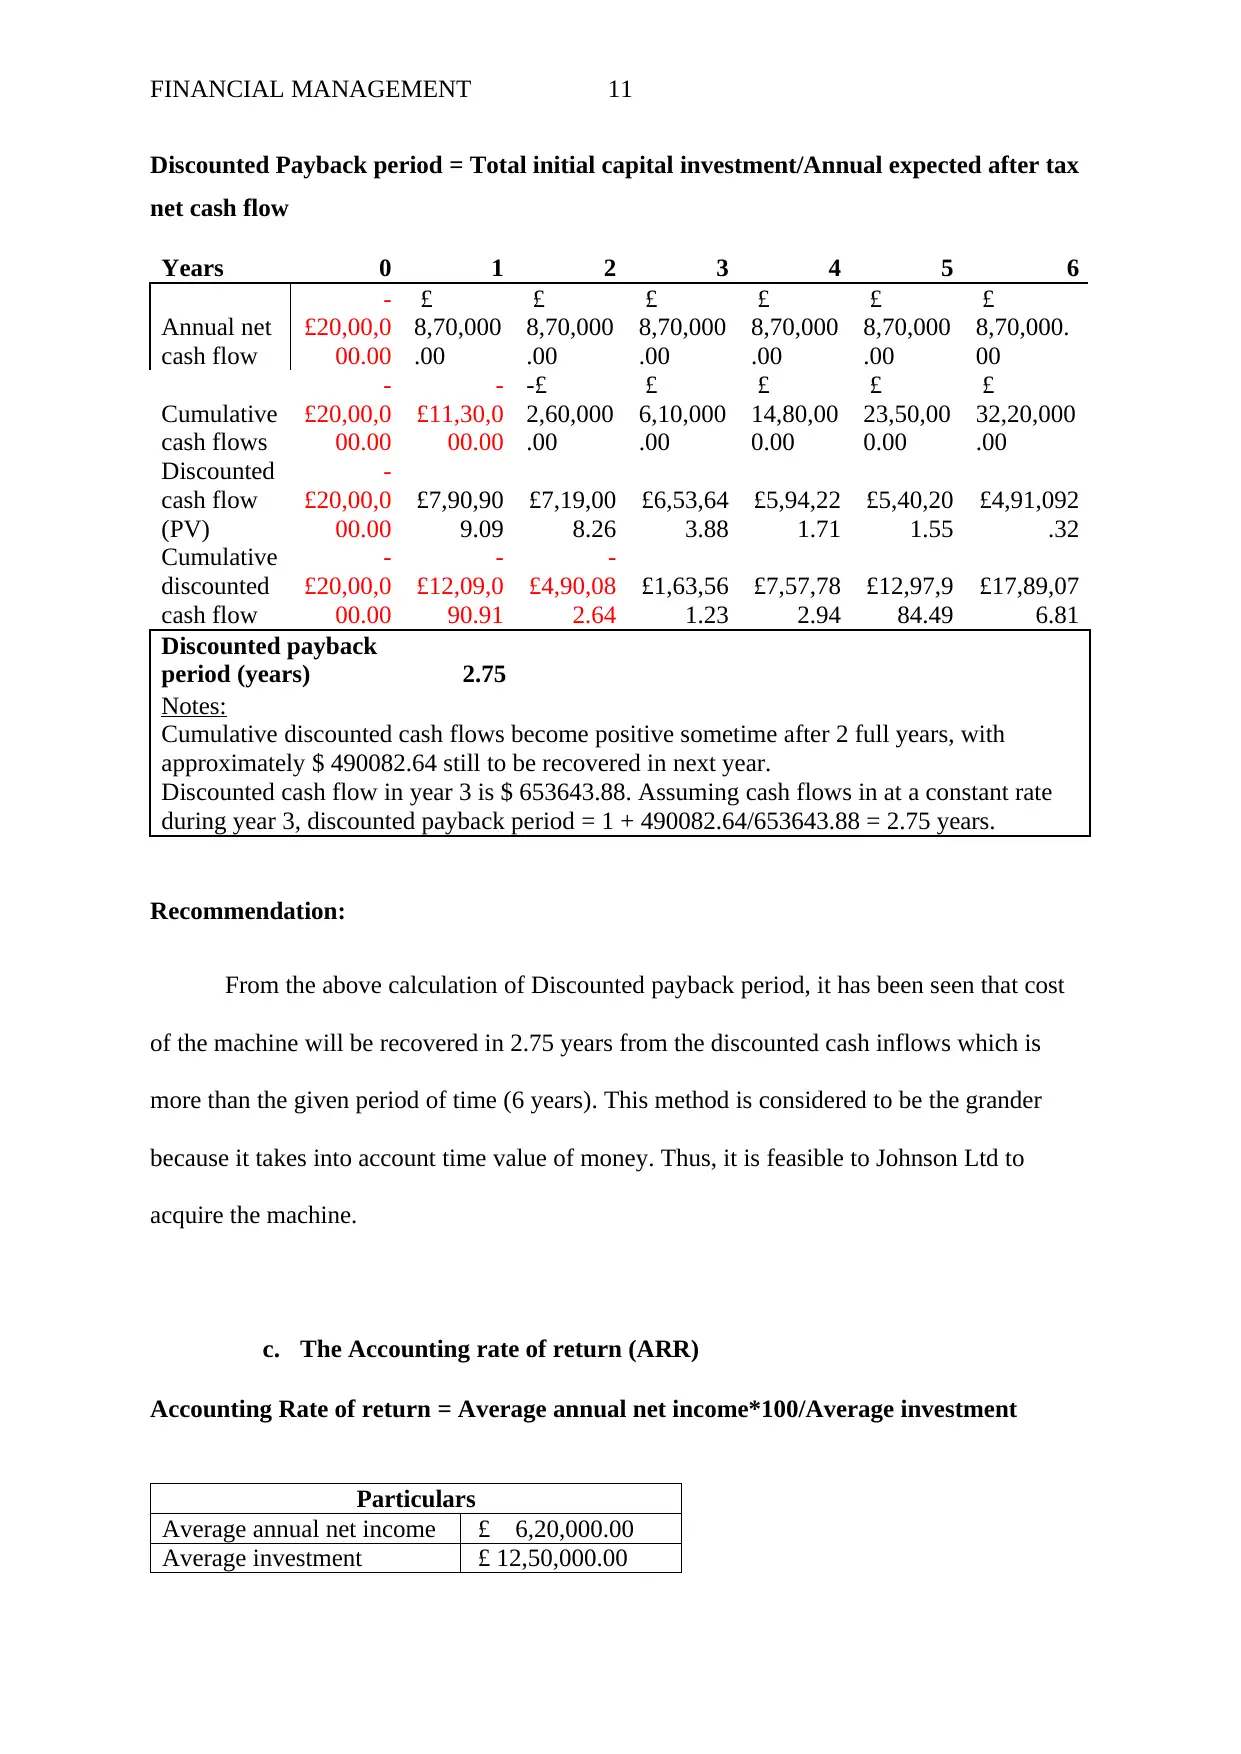
Discounted Payback period = Total initial capital investment/Annual expected after tax
net cash flow
Years 0 1 2 3 4 5 6
Annual net
cash flow
-
£20,00,0
00.00
£
8,70,000
.00
£
8,70,000
.00
£
8,70,000
.00
£
8,70,000
.00
£
8,70,000
.00
£
8,70,000.
00
Cumulative
cash flows
-
£20,00,0
00.00
-
£11,30,0
00.00
-£
2,60,000
.00
£
6,10,000
.00
£
14,80,00
0.00
£
23,50,00
0.00
£
32,20,000
.00
Discounted
cash flow
(PV)
-
£20,00,0
00.00
£7,90,90
9.09
£7,19,00
8.26
£6,53,64
3.88
£5,94,22
1.71
£5,40,20
1.55
£4,91,092
.32
Cumulative
discounted
cash flow
-
£20,00,0
00.00
-
£12,09,0
90.91
-
£4,90,08
2.64
£1,63,56
1.23
£7,57,78
2.94
£12,97,9
84.49
£17,89,07
6.81
Discounted payback
period (years) 2.75
Notes:
Cumulative discounted cash flows become positive sometime after 2 full years, with
approximately $ 490082.64 still to be recovered in next year.
Discounted cash flow in year 3 is $ 653643.88. Assuming cash flows in at a constant rate
during year 3, discounted payback period = 1 + 490082.64/653643.88 = 2.75 years.
Recommendation:
From the above calculation of Discounted payback period, it has been seen that cost
of the machine will be recovered in 2.75 years from the discounted cash inflows which is
more than the given period of time (6 years). This method is considered to be the grander
because it takes into account time value of money. Thus, it is feasible to Johnson Ltd to
acquire the machine.
c. The Accounting rate of return (ARR)
Accounting Rate of return = Average annual net income*100/Average investment
Particulars
Average annual net income £ 6,20,000.00
Average investment £ 12,50,000.00
⊘ This is a preview!⊘
Do you want full access?
Subscribe today to unlock all pages.
Trusted by 1+ million students worldwide
1 out of 22
Related Documents


Your All-in-One AI-Powered Toolkit for Academic Success.
+13062052269
info@desklib.com
Available 24*7 on WhatsApp / Email
![[object Object]](/_next/static/media/star-bottom.7253800d.svg)
Unlock your academic potential
Copyright © 2020–2026 A2Z Services. All Rights Reserved. Developed and managed by ZUCOL.