BBE604: Entrepreneurial Finance Assessment One: Financial Plan
VerifiedAdded on 2022/02/19
|20
|3442
|243
Project
AI Summary
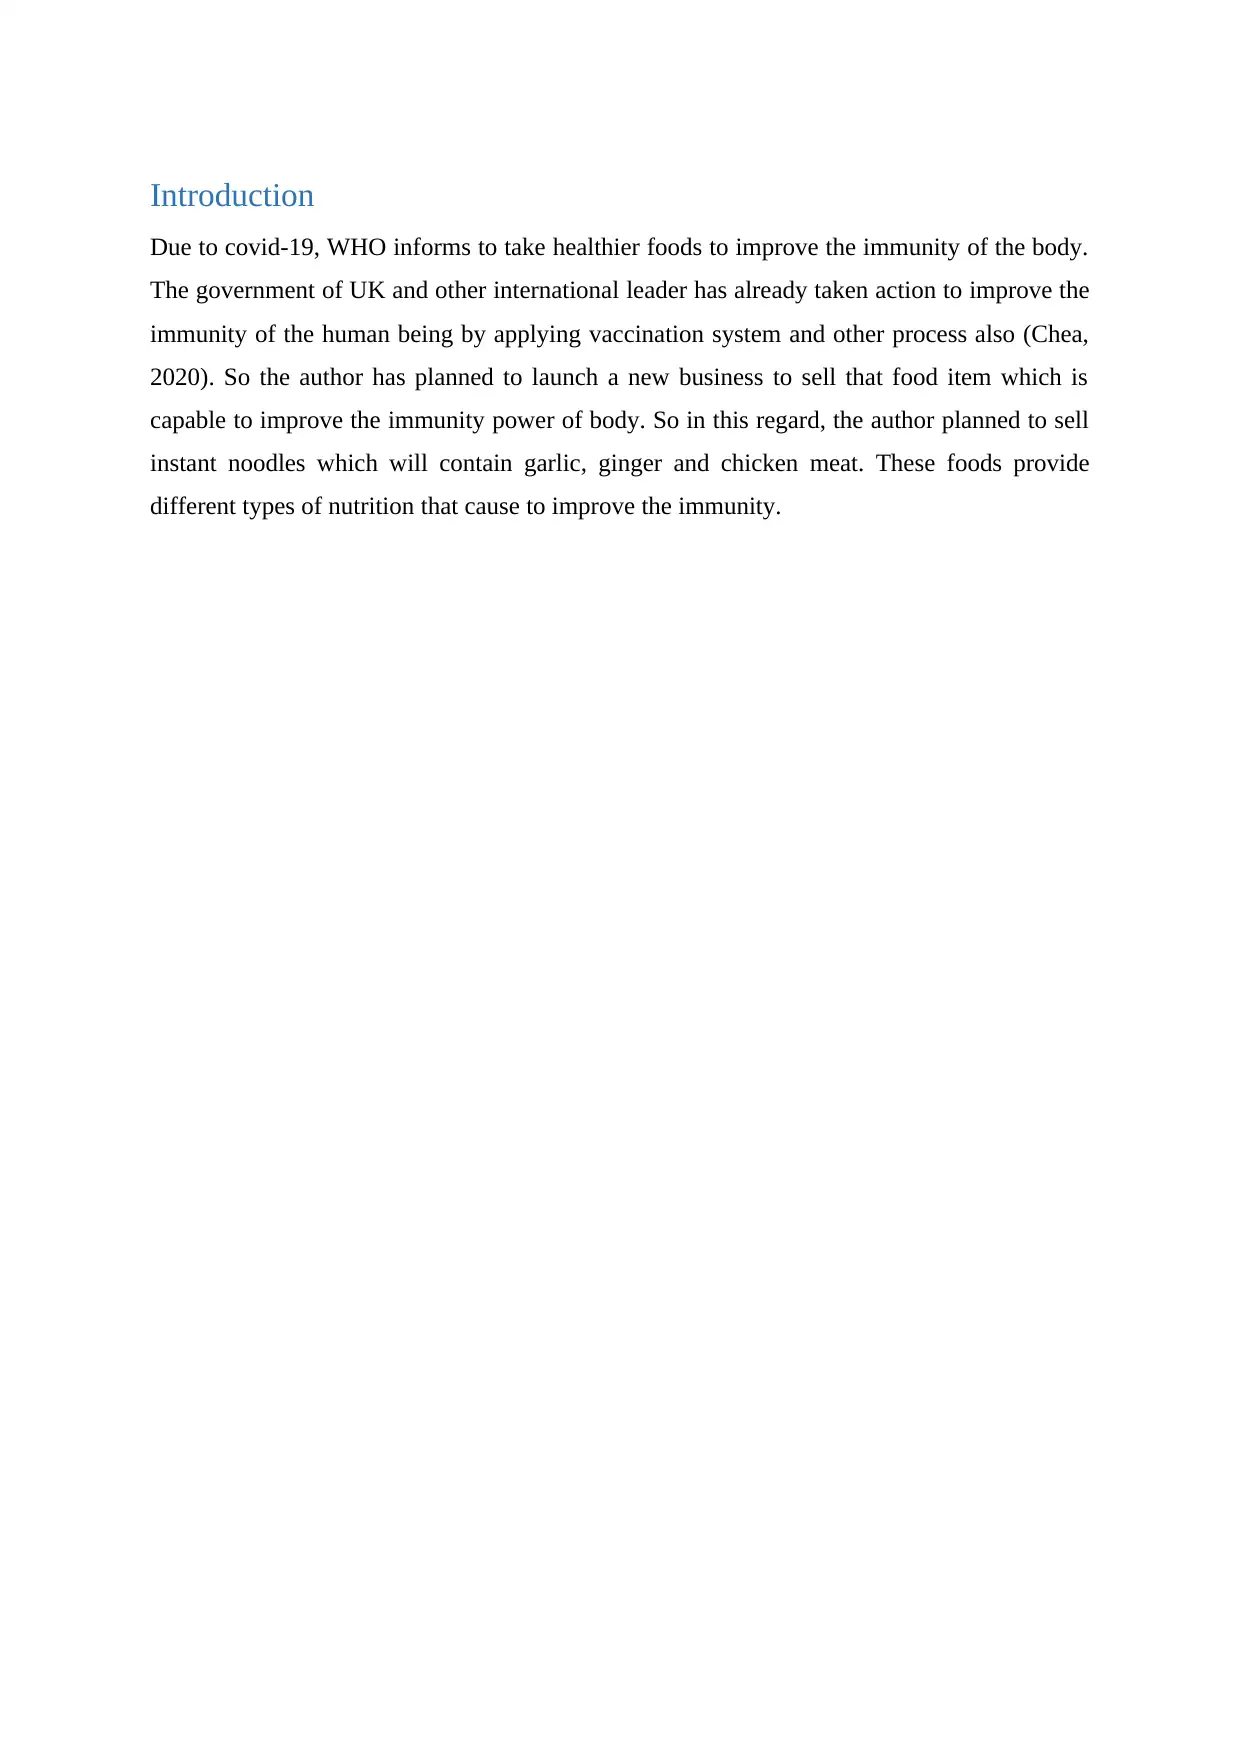
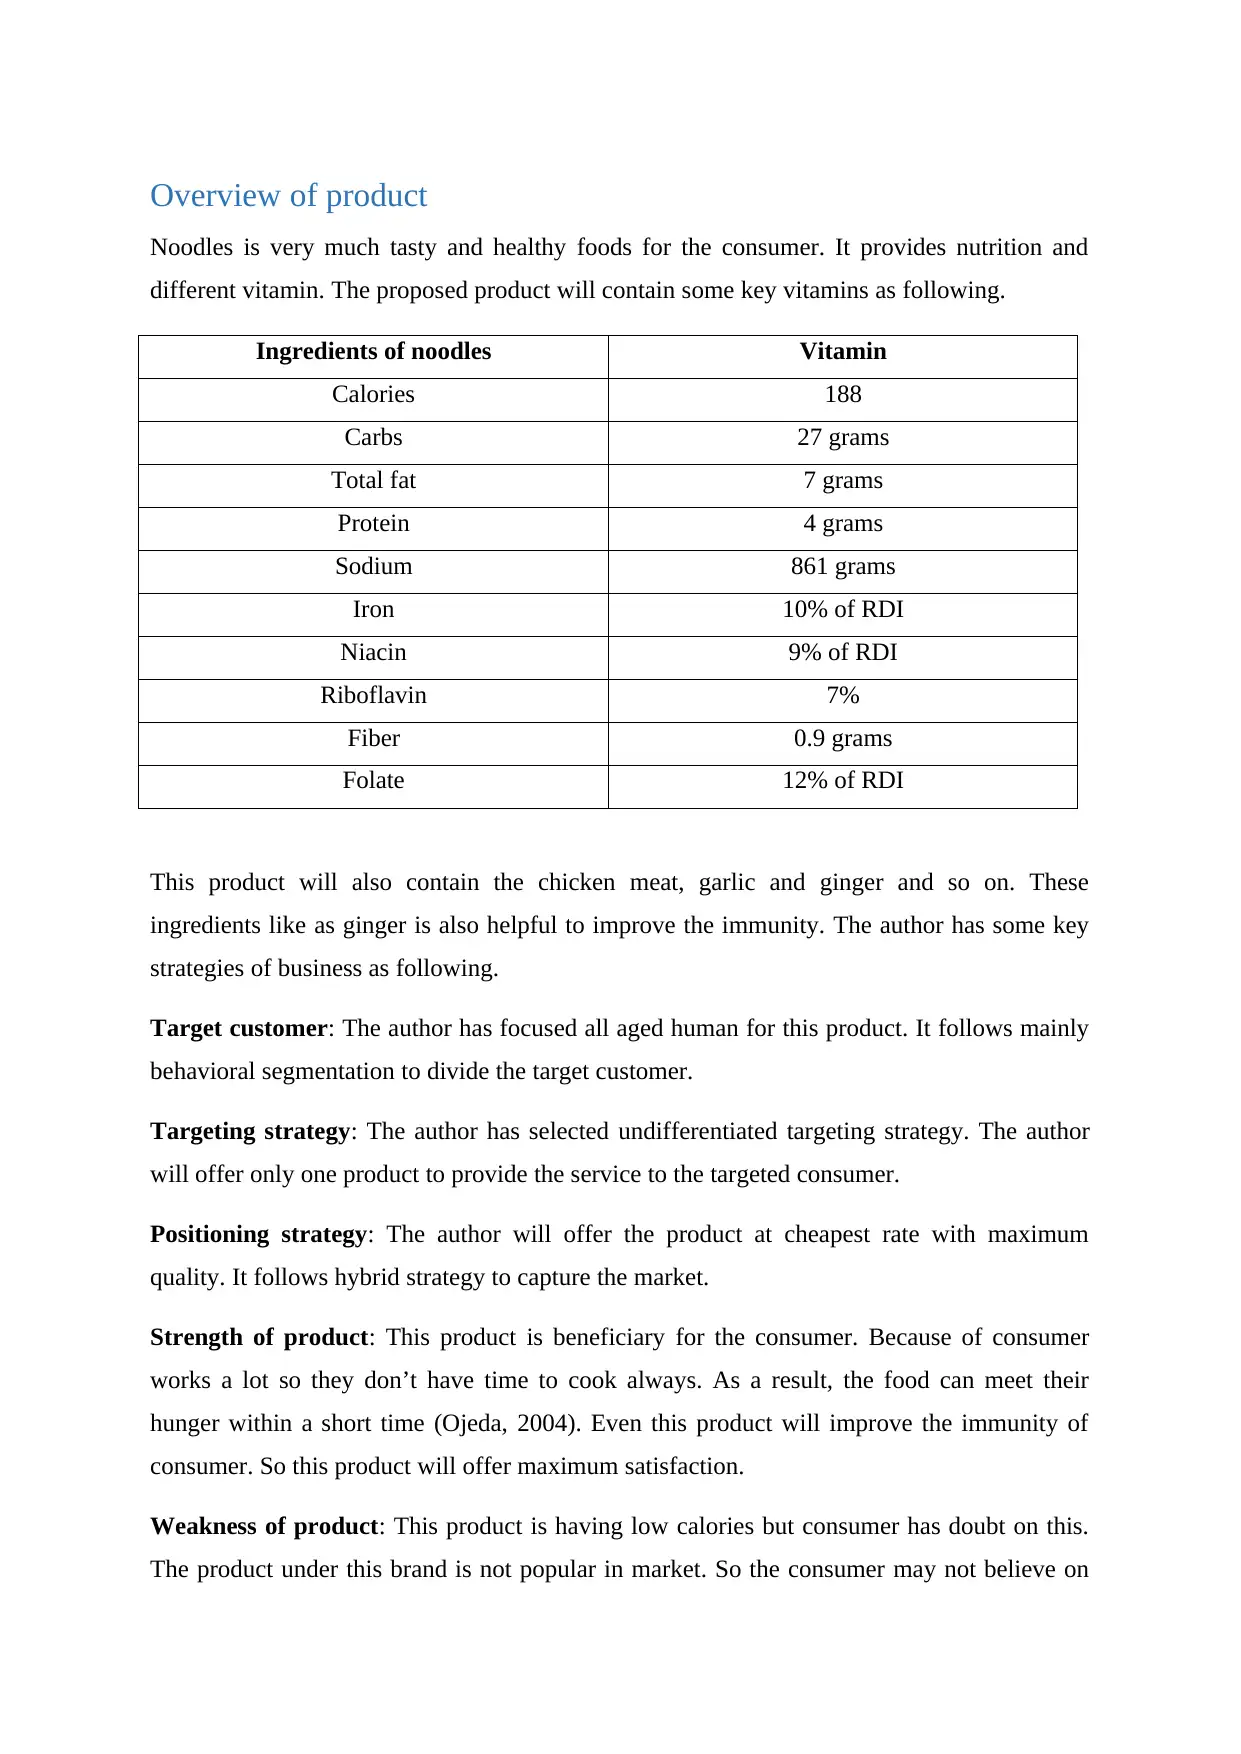
This project presents a comprehensive financial plan for a new food business venture specializing in instant noodles with immunity-boosting ingredients like garlic, ginger, and chicken. The plan includes an overview of the product, its strengths, and weaknesses, along with a detailed analysis of the target market and marketing strategies. The financial projections cover various scenarios, including reasonable, high-performing, and low-performing cases. The core of the project involves forecasted cash flow statements, projected income statements, and balance sheets over a five-year period, providing insights into the financial viability and sustainability of the business. The financial statements provide detailed information on sales revenue, cost of goods sold, operating expenses, and profitability, offering a clear picture of the financial performance and position of the business. The project also addresses the sources of funding for the venture. The student has meticulously analyzed financial data, providing a robust assessment of the business's potential and financial health.

BBE604-ENTREPRENEURIAL FINANCE
ASSESSMENT ONE: FINANCIAL PLAN
STUDENT NAME: ABDUS SALAM
STUDENT ID:
ASSESSMENT ONE: FINANCIAL PLAN
STUDENT NAME: ABDUS SALAM
STUDENT ID:
Paraphrase This Document
Need a fresh take? Get an instant paraphrase of this document with our AI Paraphraser

Table of Contents
Introduction...........................................................................................................................................3
Overview of product..............................................................................................................................4
Scenarios of projection for income and expenditure..............................................................................5
Forecasted cash flow.............................................................................................................................6
Projected income statement.................................................................................................................10
Projected balance sheet........................................................................................................................12
Source of fund.....................................................................................................................................18
Conclusion...........................................................................................................................................19

Introduction
Due to covid-19, WHO informs to take healthier foods to improve the immunity of the body.
The government of UK and other international leader has already taken action to improve the
immunity of the human being by applying vaccination system and other process also (Chea,
2020). So the author has planned to launch a new business to sell that food item which is
capable to improve the immunity power of body. So in this regard, the author planned to sell
instant noodles which will contain garlic, ginger and chicken meat. These foods provide
different types of nutrition that cause to improve the immunity.
⊘ This is a preview!⊘
Do you want full access?
Subscribe today to unlock all pages.

Trusted by 1+ million students worldwide

Overview of product
Noodles is very much tasty and healthy foods for the consumer. It provides nutrition and
different vitamin. The proposed product will contain some key vitamins as following.
Ingredients of noodles Vitamin
Calories 188
Carbs 27 grams
Total fat 7 grams
Protein 4 grams
Sodium 861 grams
Iron 10% of RDI
Niacin 9% of RDI
Riboflavin 7%
Fiber 0.9 grams
Folate 12% of RDI
This product will also contain the chicken meat, garlic and ginger and so on. These
ingredients like as ginger is also helpful to improve the immunity. The author has some key
strategies of business as following.
Target customer: The author has focused all aged human for this product. It follows mainly
behavioral segmentation to divide the target customer.
Targeting strategy: The author has selected undifferentiated targeting strategy. The author
will offer only one product to provide the service to the targeted consumer.
Positioning strategy: The author will offer the product at cheapest rate with maximum
quality. It follows hybrid strategy to capture the market.
Strength of product: This product is beneficiary for the consumer. Because of consumer
works a lot so they don’t have time to cook always. As a result, the food can meet their
hunger within a short time (Ojeda, 2004). Even this product will improve the immunity of
consumer. So this product will offer maximum satisfaction.
Weakness of product: This product is having low calories but consumer has doubt on this.
The product under this brand is not popular in market. So the consumer may not believe on
Paraphrase This Document
Need a fresh take? Get an instant paraphrase of this document with our AI Paraphraser

this product. Even the author has also found that there is some controversy about this product
in the market. Some people talks as this product is not sustain a long time.
Scenarios of projection for income and expenditure
At reasonable case: This product is getting popularity at all over the world under so many
organizations. So the author has great opportunities to increase the production and
productivity. If the consumer can increase the quality of product, then it can continue the
business for a long time (Pilbeam, 2013). So the author has planned that the price of product
will be £1.20 for all time. Though the cost would be increased in several case. But in the
normal case, the cost would be same, there will be no change in the process of production. So
the cost will be same also. The author has understood that if productivity of employee may
decrease then the cost of the product would be increased. So the author has planned to tackle
the situation by applying different strategy.
At high performing case: The author of this project has planned to improve the business. So
the author has addressed that if the organization can continue the business perfectly then it
can reduce the cost product and increase the salary. Linking with Williams (2015), it is very
much significant that if the author can increase the production process then the author can
decrease the cost. It is known to all that if number of production can increase then the per unit
cost of product could be decreased (Templar, 2001). So the author has planned to increase the
quality and quantity to maintain the cost. The author will also reduce the cost but maintain
the price of product. Because of market competition is high so the author will remain the
price at same at the higher position of business.
At low performing case: At low performing case, the author will maintain the price of
product and cost also. Because of cost could be increased in the time of lower production
(Williams, 2015). The author of this report, is also forecasting the price and cost of product
during the low performing stage. The author has also addressed that this increasing trend of
cost may reduce the profitability. It could be increased around 20% during lower number of
production. Even the author has also found that lower production of product can impact the
opportunity cost also.

Forecasted cash flow
Each company is dependent, big and little, on cash. Dave runs a landscaping company and is
always in need of money to pay his staff and maintain his facilities. It is unsustainable to
borrow money in the long run to fulfil these requirements, and therefore he must have a good
picture of what his financial position would look like if he succeeds in the near future
(Williams, 2015). Let's look at how Dave develops and utilises his company in cash flow
predictions. Templar (2001), argue that a cash flow forecast illustrates the amount of money
anticipated and expenditures that go into the company. McLaughlin and Richards (2020),
address that it is a distinct notion from corporate profit; a company may earn a profit, but still
has a cash flow issue. For instance, when Dave receives a one-month lawn care payment in
advance and has a big tax bill that month, how will he pay his normal costs and tax?
Although he might make up his share by earning enough money next month and still make a
profit at the end of the quarter or year, he has urgent bonds to pay now (Madura and Hoque,
2018). For example, a customer's late payment may lead to an epic catastrophe for most small
companies. When the organisation predicts various situations correctly, it may nonetheless
prepare for the 'what if' which can provide a better calm and confident implementation of
programmes.
Particular Per unit
Sales revenue 1.2
Material cost 0.45
Direct labour cost 0.15
Manufacturing overhead cost 0.05
0.65
Year 1
Particular
Mo
nth-
1
Mo
nth-
2
Mo
nth-
3
Mo
nth-
4
Mo
nth-
5
Mo
nth-
6
Mo
nth-
7
Mo
nth-
8
Mo
nth-
9
Mon
th-
10
Mon
th-
11
Mon
th-
12
Beginning
cash in hand
45.
00
45.
00
45.
00
45.
00
45.
00
45.
00
320
.00
320
.00
320.
00
320.
00
320.
00
⊘ This is a preview!⊘
Do you want full access?
Subscribe today to unlock all pages.

Trusted by 1+ million students worldwide

Cash in-
flow
Sales
revenue
120
0
120
0
120
0
120
0
120
0
120
0
180
0
180
0
180
0
180
0
180
0
180
0
Cash out
flow
Cost of
goods sold 650 650 650 650 650 650 975 975 975 975 975 975
Non-
variable
cost
Salaries and
remuneratio
n 130 130 130 130 130 130 130 130 130 130 130 130
Office rent 120 120 120 120 120 120 120 120 120 120 120 120
Advertising 150 150 150 150 150 150 150 150 150 150 150 150
Financial
cost 75 75 75 75 75 75 75 75 75 75 75 75
Others 30 30 30 30 30 30 30 30 30 30 30 30
Total cash
in hand
45.
00
45.
00
45.
00
45.
00
45.
00
45.
00
320
.00
320
.00
320
.00
320.
00
320.
00
320.
00
Year 2
Particular
Mo
nth-
1
Mo
nth-
2
Mo
nth-
3
Mo
nth-
4
Mo
nth-
5
Mo
nth-
6
Mo
nth-
7
Mo
nth-
8
Mo
nth-
9
Mon
th-
10
Mon
th-
11
Mon
th-
12
Beginning
cash in hand
320
.00
750
.00
118
0.0
0
161
0.0
0
204
0.0
0
247
0.0
0
290
0.0
0
344
0.0
0
398
0.0
0
452
0.00
506
0.00
560
0.00
Cash in-
flow
Sales
revenue
204
0
204
0
204
0
204
0
204
0
204
0
228
0
228
0
228
0
228
0
228
0
228
0
flow
Sales
revenue
120
0
120
0
120
0
120
0
120
0
120
0
180
0
180
0
180
0
180
0
180
0
180
0
Cash out
flow
Cost of
goods sold 650 650 650 650 650 650 975 975 975 975 975 975
Non-
variable
cost
Salaries and
remuneratio
n 130 130 130 130 130 130 130 130 130 130 130 130
Office rent 120 120 120 120 120 120 120 120 120 120 120 120
Advertising 150 150 150 150 150 150 150 150 150 150 150 150
Financial
cost 75 75 75 75 75 75 75 75 75 75 75 75
Others 30 30 30 30 30 30 30 30 30 30 30 30
Total cash
in hand
45.
00
45.
00
45.
00
45.
00
45.
00
45.
00
320
.00
320
.00
320
.00
320.
00
320.
00
320.
00
Year 2
Particular
Mo
nth-
1
Mo
nth-
2
Mo
nth-
3
Mo
nth-
4
Mo
nth-
5
Mo
nth-
6
Mo
nth-
7
Mo
nth-
8
Mo
nth-
9
Mon
th-
10
Mon
th-
11
Mon
th-
12
Beginning
cash in hand
320
.00
750
.00
118
0.0
0
161
0.0
0
204
0.0
0
247
0.0
0
290
0.0
0
344
0.0
0
398
0.0
0
452
0.00
506
0.00
560
0.00
Cash in-
flow
Sales
revenue
204
0
204
0
204
0
204
0
204
0
204
0
228
0
228
0
228
0
228
0
228
0
228
0
Paraphrase This Document
Need a fresh take? Get an instant paraphrase of this document with our AI Paraphraser

Cash out
flow
Cost of
goods sold
110
5
110
5
110
5
110
5
110
5
110
5
123
5
123
5
123
5
123
5
123
5
123
5
Non-
variable
cost
Salaries and
remuneratio
n 130 130 130 130 130 130 130 130 130 130 130 130
Office rent 120 120 120 120 120 120 120 120 120 120 120 120
Advertising 150 150 150 150 150 150 150 150 150 150 150 150
Financial
cost 75 75 75 75 75 75 75 75 75 75 75 75
Others 30 30 30 30 30 30 30 30 30 30 30 30
Total cash
in hand
750
.00
118
0.0
0
161
0.0
0
204
0.0
0
247
0.0
0
290
0.0
0
344
0.0
0
398
0.0
0
452
0.0
0
506
0.00
560
0.00
614
0.00
Year 3
Particular Quarter-1 Quarter-2 Quarter-3 Quarter-4
Beginning cash in hand 6140.00 7925.00 9710.00 11825.00
Cash in-flow
Sales revenue 7200 7200 7920 7920
Cash out flow
Cost of goods sold 3900 3900 4290 4290
Non-variable cost
Salaries and remuneration 390 390 390 390
Office rent 360 360 360 360
Advertising 450 450 450 450
Financial cost 225 225 225 225
Others 90 90 90 90
Total cash in hand 7925.00 9710.00 11825.00 13940.00

Year 4
Particular Quarter-1 Quarter-2 Quarter-3 Quarter-4
Beginning cash in hand 13940.00 17375.00 20810.00 24245.00
Cash in-flow
Sales revenue 10800 10800 10800 10800
Cash out flow
Cost of goods sold 5850 5850 5850 5850
Non-variable cost
Salaries and remuneration 390 390 390 390
Office rent 360 360 360 360
Advertising 450 450 450 450
Financial cost 225 225 225 225
Others 90 90 90 90
Total cash in hand 17375.00 20810.00 24245.00 27680.00
Year 5
Particular Quarter-1 Quarter-2 Quarter-3 Quarter-4
Beginning cash in hand 27680.00 29740.00 31800.00 33860.00
Cash in-flow
Sales revenue 7800 7800 7800 7800
Cash out flow
Cost of goods sold 4225 4225 4225 4225
Non-variable cost
Salaries and remuneration 390 390 390 390
Office rent 360 360 360 360
Advertising 450 450 450 450
Financial cost 225 225 225 225
Others 90 90 90 90
Total cash in hand 29740.00 31800.00 33860.00 35920.00
Particular Quarter-1 Quarter-2 Quarter-3 Quarter-4
Beginning cash in hand 13940.00 17375.00 20810.00 24245.00
Cash in-flow
Sales revenue 10800 10800 10800 10800
Cash out flow
Cost of goods sold 5850 5850 5850 5850
Non-variable cost
Salaries and remuneration 390 390 390 390
Office rent 360 360 360 360
Advertising 450 450 450 450
Financial cost 225 225 225 225
Others 90 90 90 90
Total cash in hand 17375.00 20810.00 24245.00 27680.00
Year 5
Particular Quarter-1 Quarter-2 Quarter-3 Quarter-4
Beginning cash in hand 27680.00 29740.00 31800.00 33860.00
Cash in-flow
Sales revenue 7800 7800 7800 7800
Cash out flow
Cost of goods sold 4225 4225 4225 4225
Non-variable cost
Salaries and remuneration 390 390 390 390
Office rent 360 360 360 360
Advertising 450 450 450 450
Financial cost 225 225 225 225
Others 90 90 90 90
Total cash in hand 29740.00 31800.00 33860.00 35920.00
⊘ This is a preview!⊘
Do you want full access?
Subscribe today to unlock all pages.

Trusted by 1+ million students worldwide

Projected income statement
One of the three major financial statements for the company plan are the revenue statement
projection, often termed the profit and loss forecast (Madura and Hoque, 2018). The forecast
displays the financial performance of a company throughout an accounting period. Pilbeam
(2013), mentions that the accounting period may be of any duration but typically is one
month or one year. Mclaney (2017), argue that the following structure provides a fast
indication and establishes the most frequent accounting conditions when dealing with the
income statement of a company plan. The following example shows a common and helpful
management income statement structure (Templar, 2001). Company will choose the degree
of details for each item and who uses it. For example, income may be divided by product
category, while operational costs can be divided into several lines such as rent, labour, light
and heat, and so on (Eiteman, Stonehill and Moffett, 2019).
Year ended at 1
Particular
Amount
(£)
Amount
(£)
Sales 19000
Less: COGS 10500
Gross profit 8500
Less: Administrative cost
Salaries and remuneration 1800
Office rent 1200
Others 600
Depreciation 200
Financial cost 960
4760
Advertising 1200
Net profit 2540.00
Year ended at 2
Particular
Amount
(£)
Amount
(£)
Sales 26920
Paraphrase This Document
Need a fresh take? Get an instant paraphrase of this document with our AI Paraphraser

Less: COGS 15120
Gross profit 11800
Less: Administrative cost
Salaries and remuneration 1800
Office rent 1200
Others 600
Depreciation 200
Financial cost 1800
5600
Advertising 1440
Net profit 4760
Year ended at 3
Particular
Amount
(£)
Amount
(£)
Sales 31040
Less: COGS 17640
Gross profit 13400
Less: Administrative cost
Salaries and remuneration 2000
Office rent 1440
Others 400
Depreciation 200
Financial cost 1800
5840
Advertising 1800
Net profit 5760
Year ended at 4
Particular
Amount
(£)
Amount
(£)
Sales 44000

Less: COGS 25200
Gross profit 18800
Less: Administrative cost
Salaries and remuneration 2000
Office rent 1440
Others 400
Depreciation 200
Financial cost 1800
5840
Advertising 1800
Net profit 11160
Year ended at 5
Particular
Amount
(£)
Amount
(£)
Sales 32000
Less: COGS 18200
Gross profit 13800
Less: Administrative cost
Salaries and remuneration 2400
Office rent 1600
Others 400
Depreciation 200
Financial cost 1800
6400
Advertising 2000
Net profit 5400
Projected balance sheet
At any particular time, the balance sheet displays the financial scene of the business - assets,
liabilities and capital (Remolina, 2020). McLaughlin and Richards (2020), address that it
helps to realise that profit and loss is a long-term, quarter or year, demonstration of financial
⊘ This is a preview!⊘
Do you want full access?
Subscribe today to unlock all pages.

Trusted by 1+ million students worldwide
1 out of 20
Related Documents

Your All-in-One AI-Powered Toolkit for Academic Success.
+13062052269
info@desklib.com
Available 24*7 on WhatsApp / Email
Unlock your academic potential
Copyright © 2020–2025 A2Z Services. All Rights Reserved. Developed and managed by ZUCOL.