Project Report: Manage Budgets and Financial Plan - Part 1 & 2
VerifiedAdded on 2020/04/07
|10
|1432
|30
Project
AI Summary
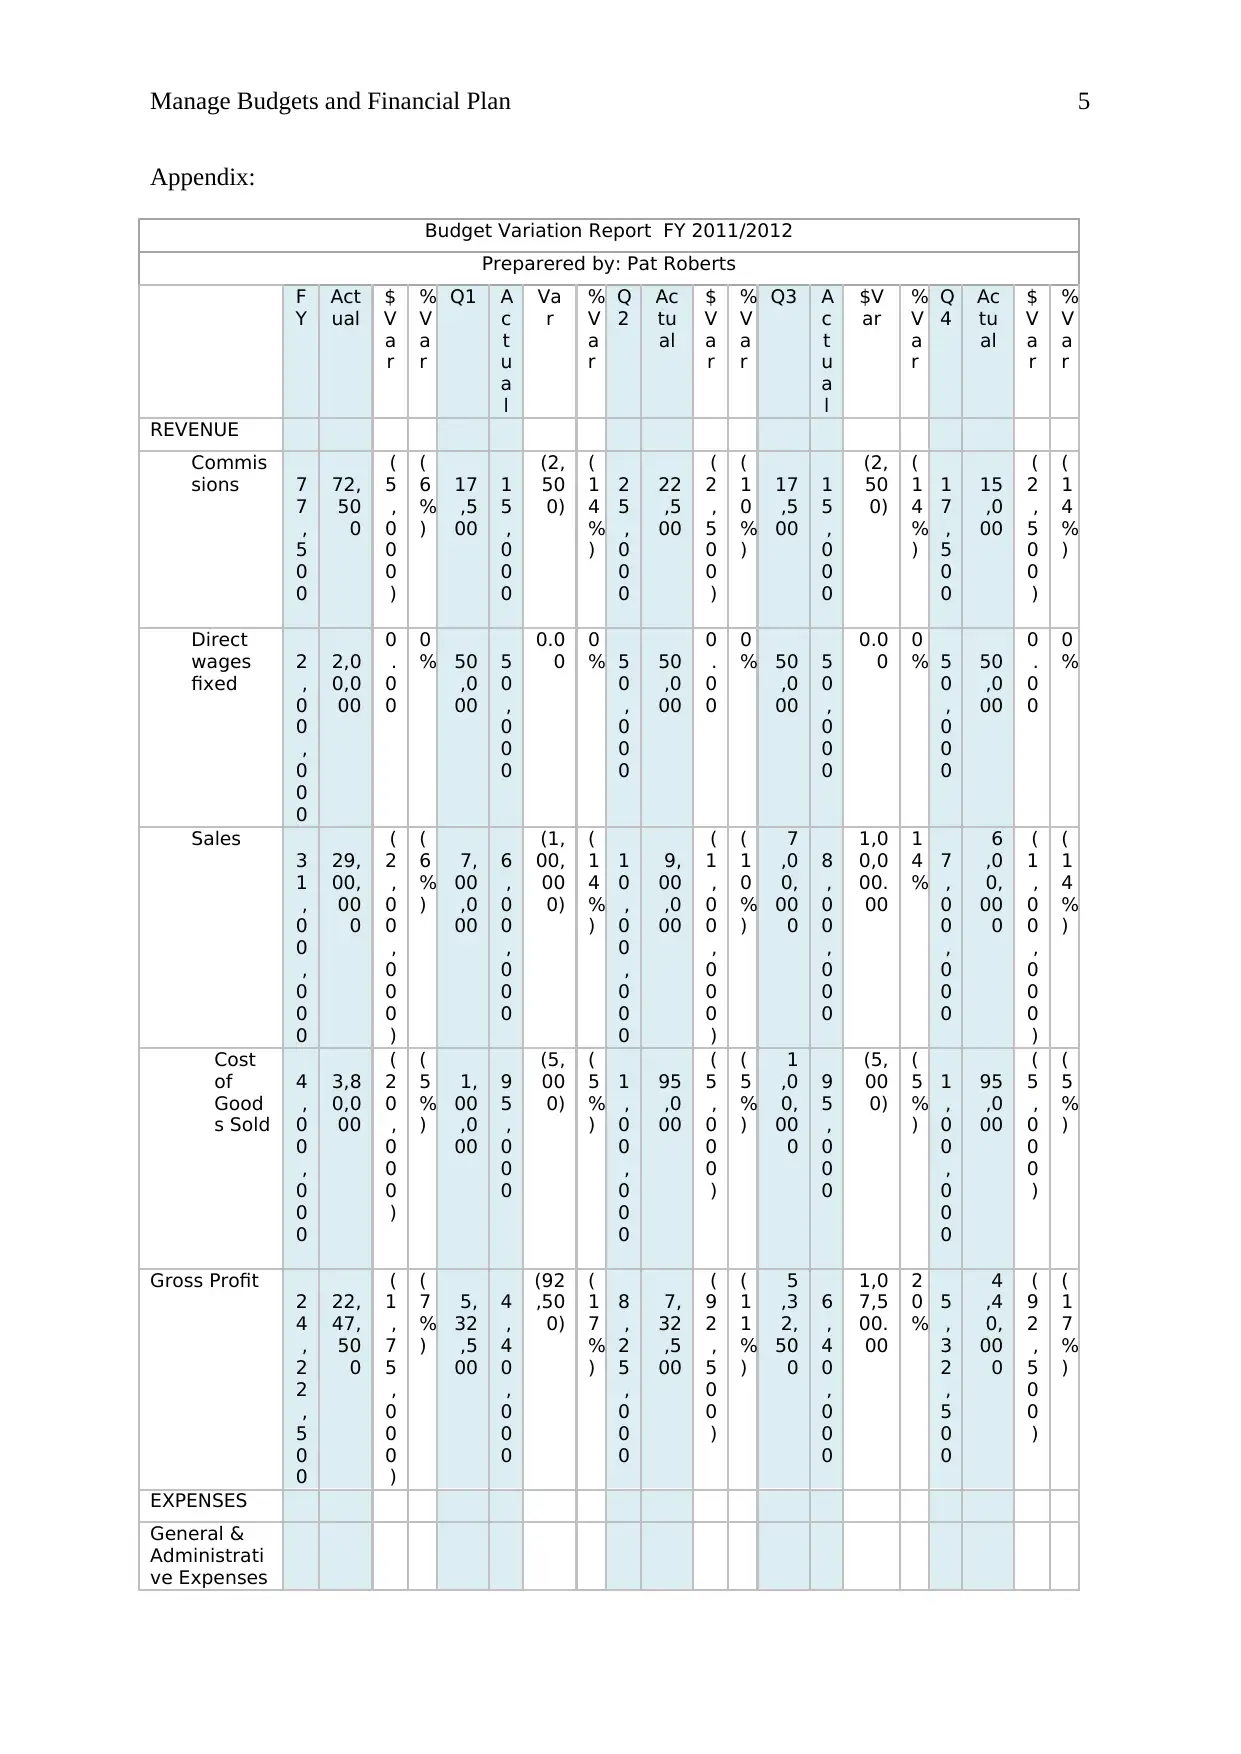
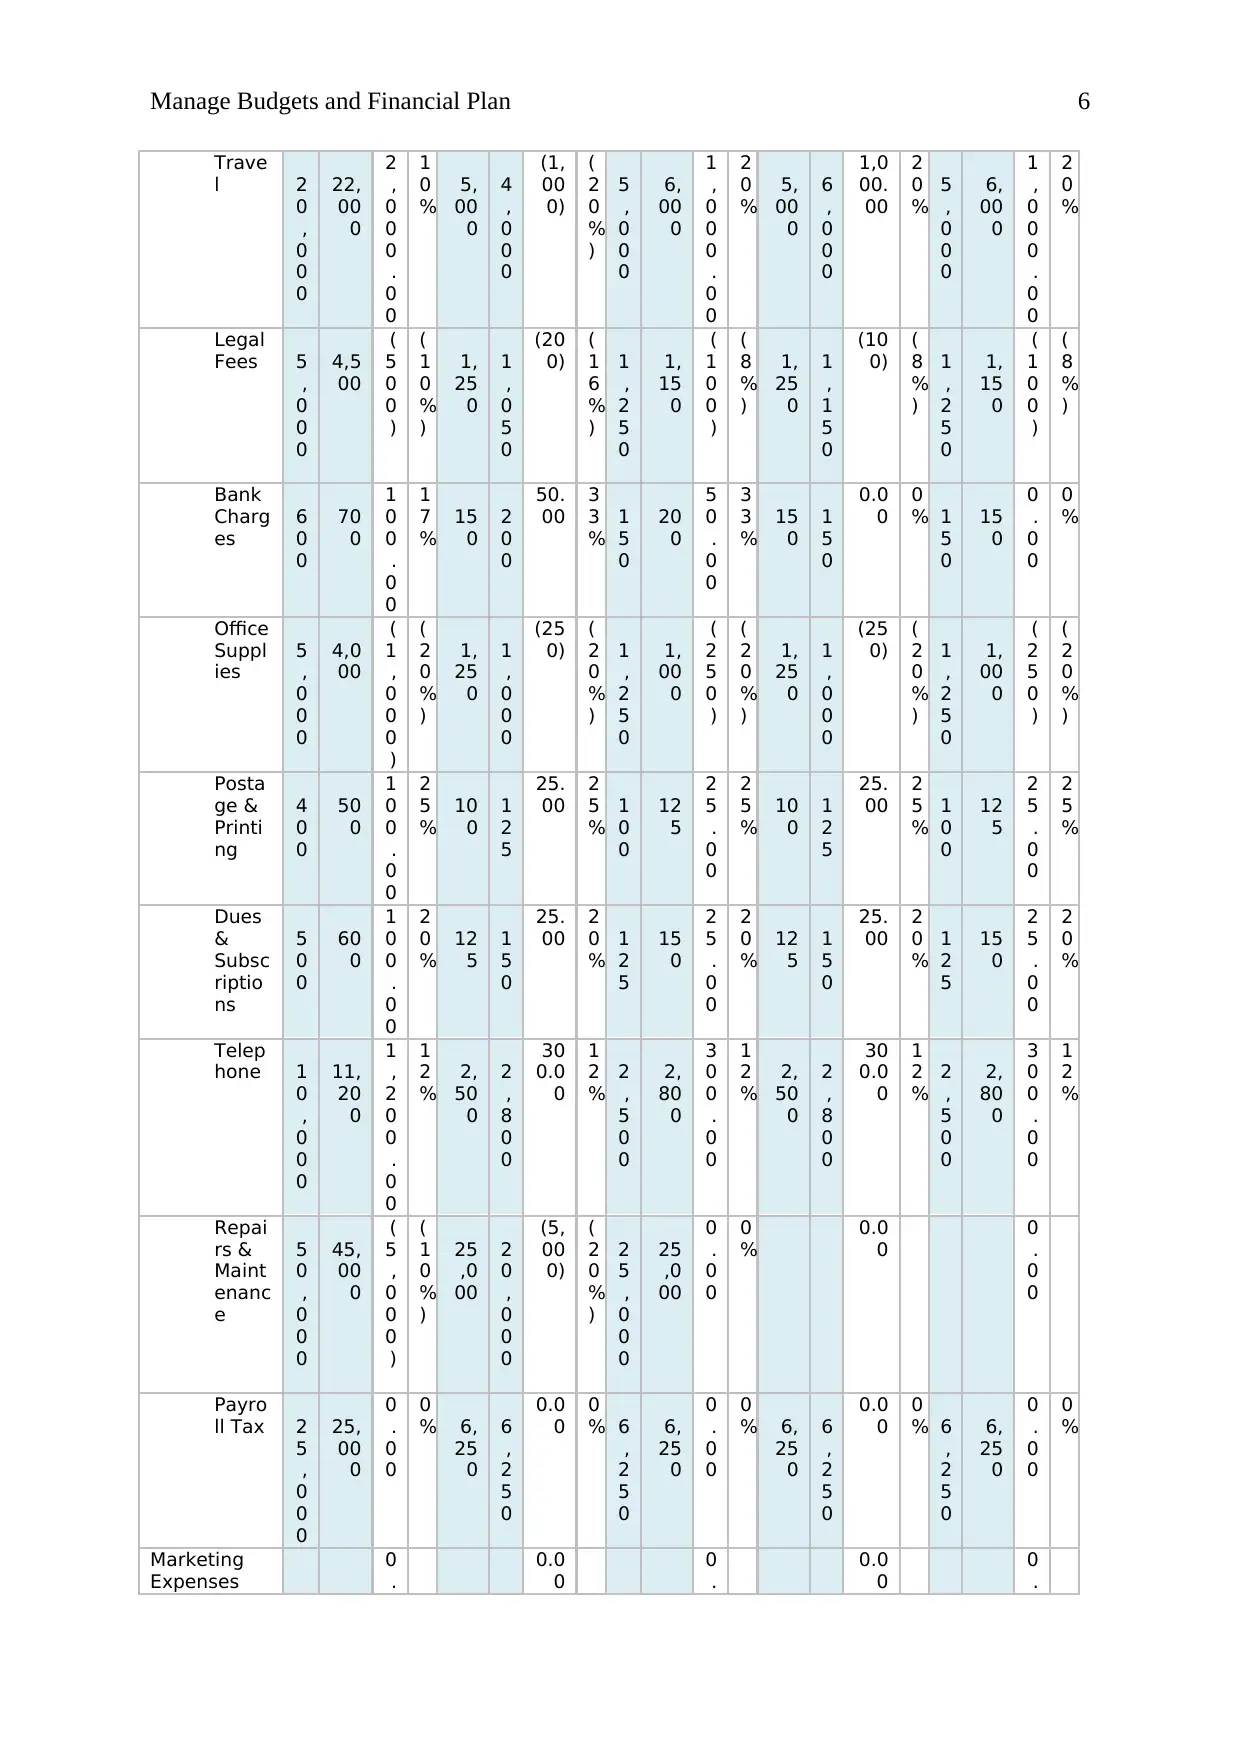
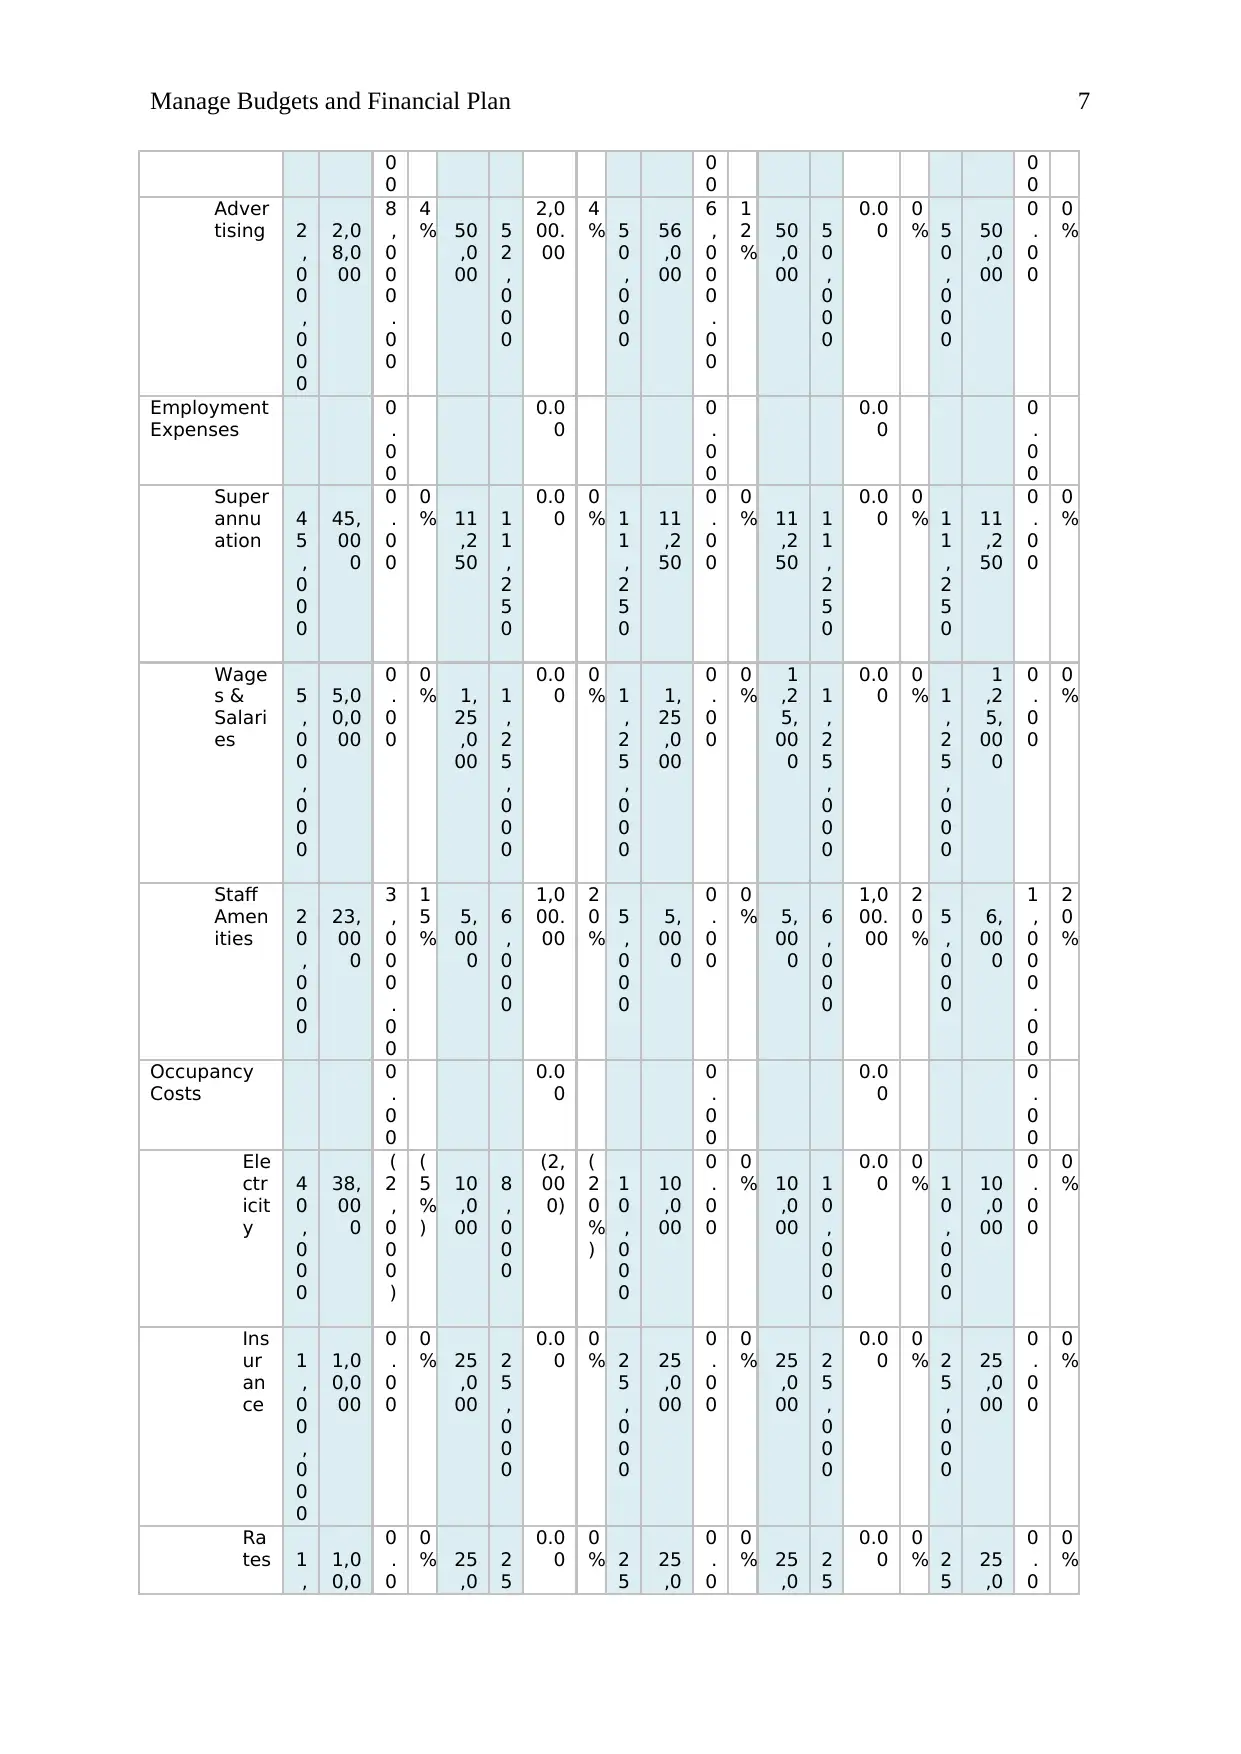
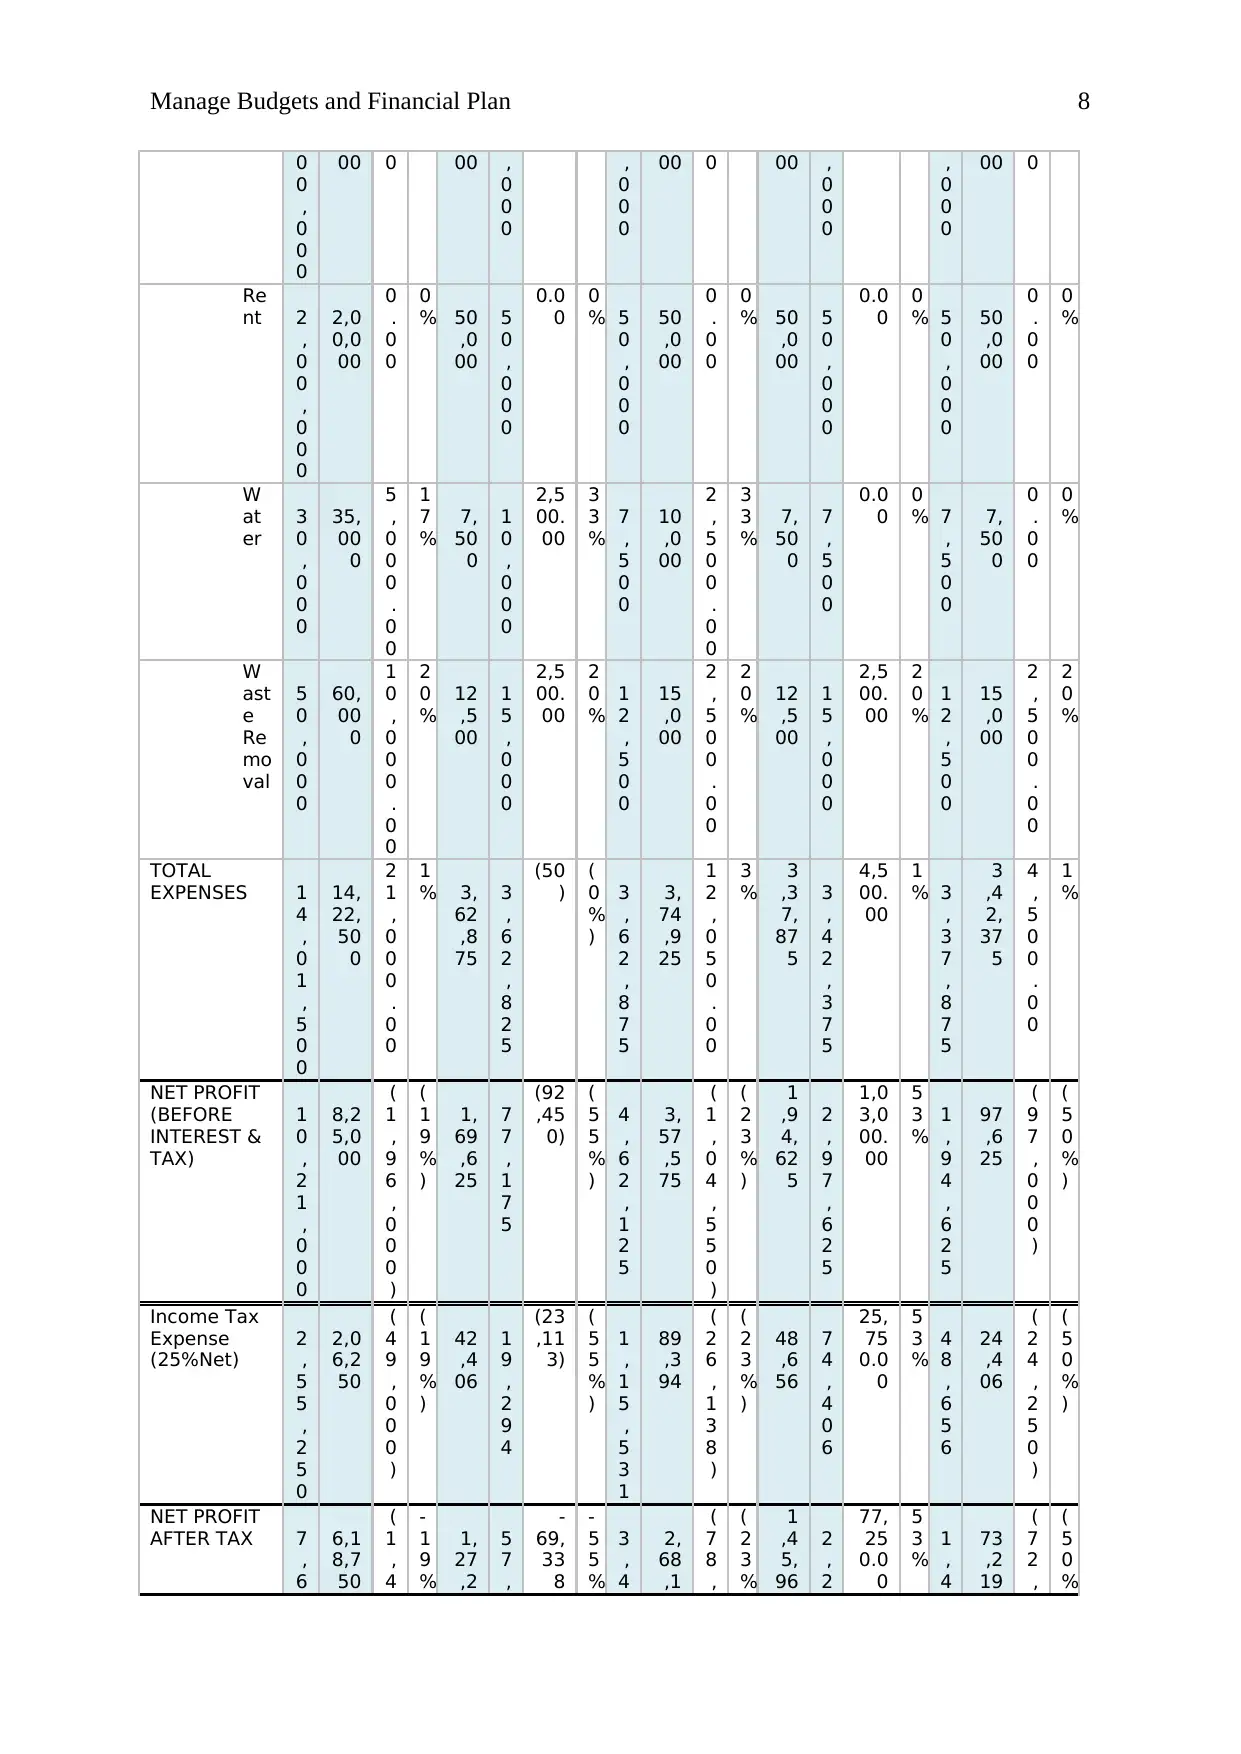
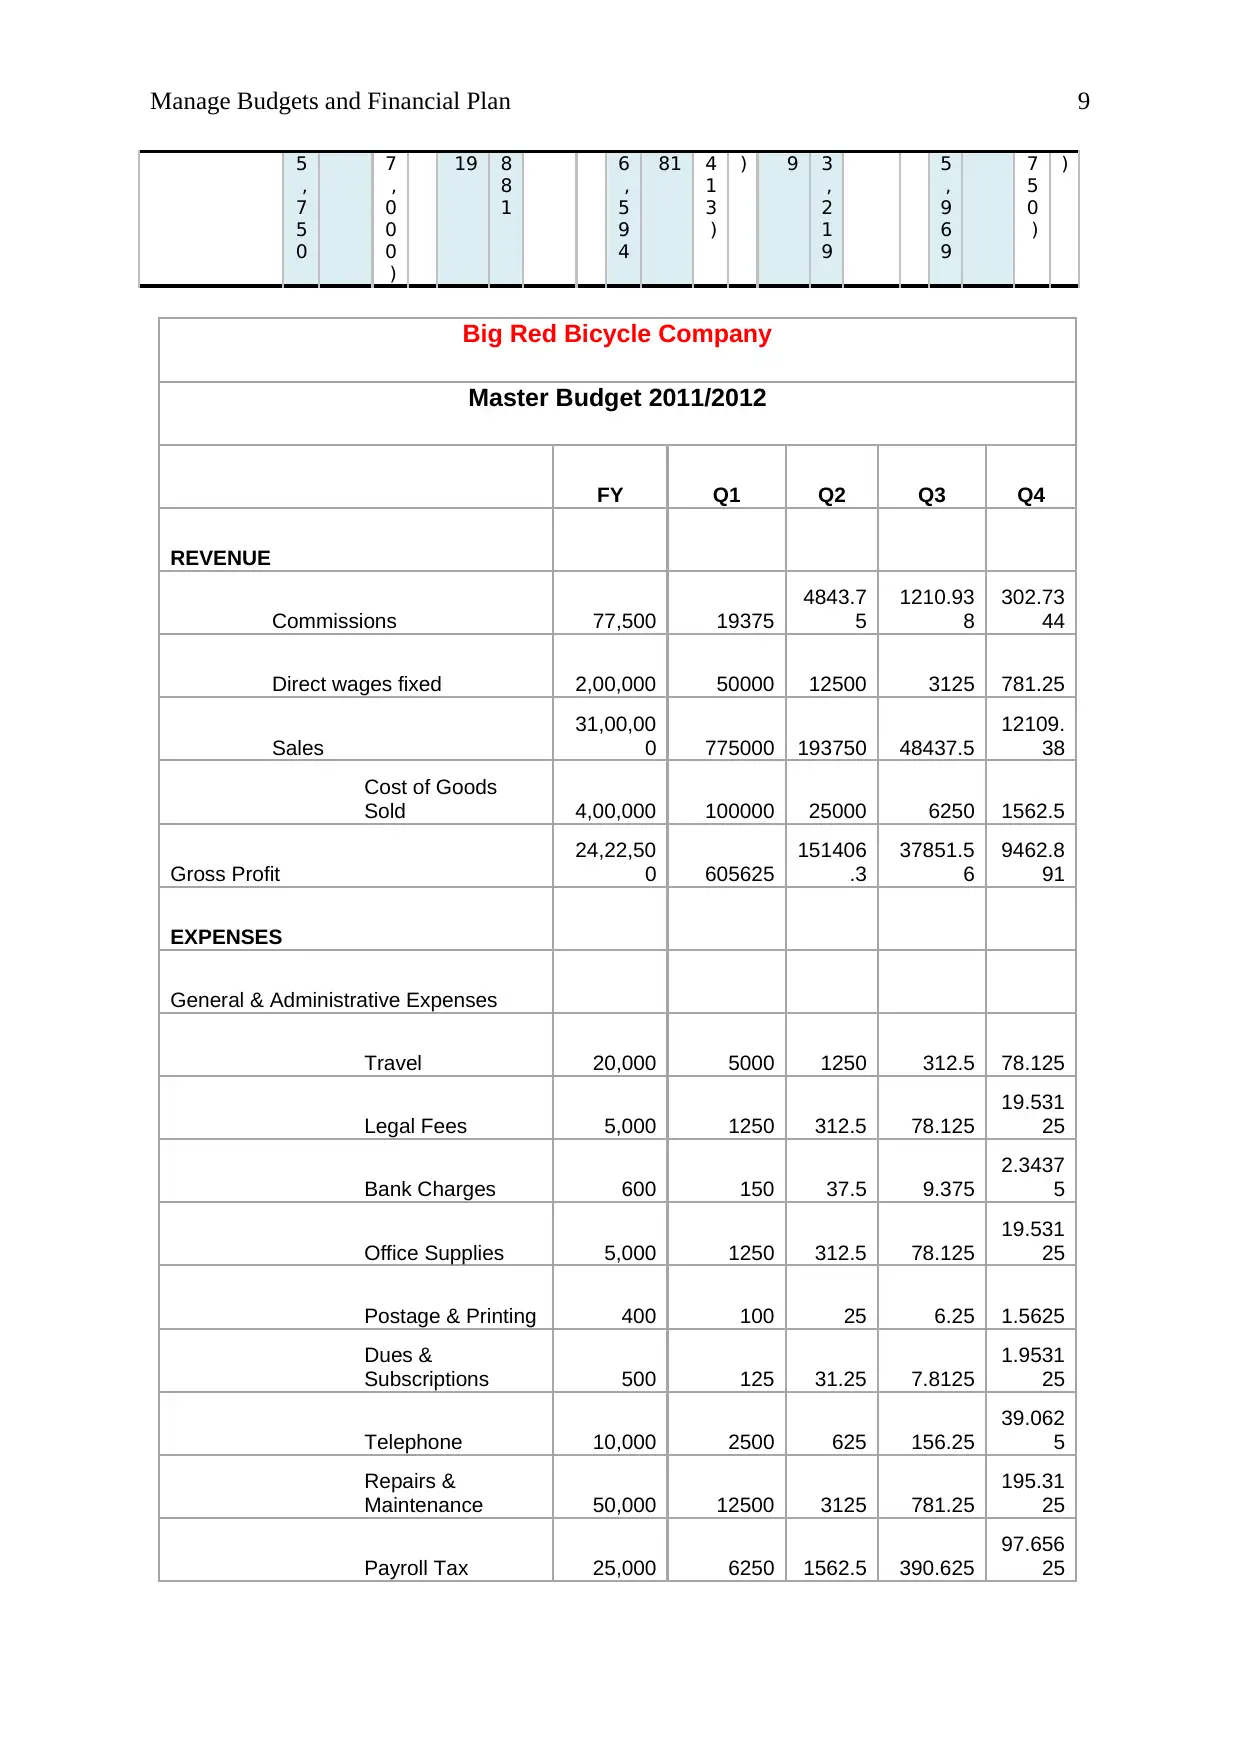
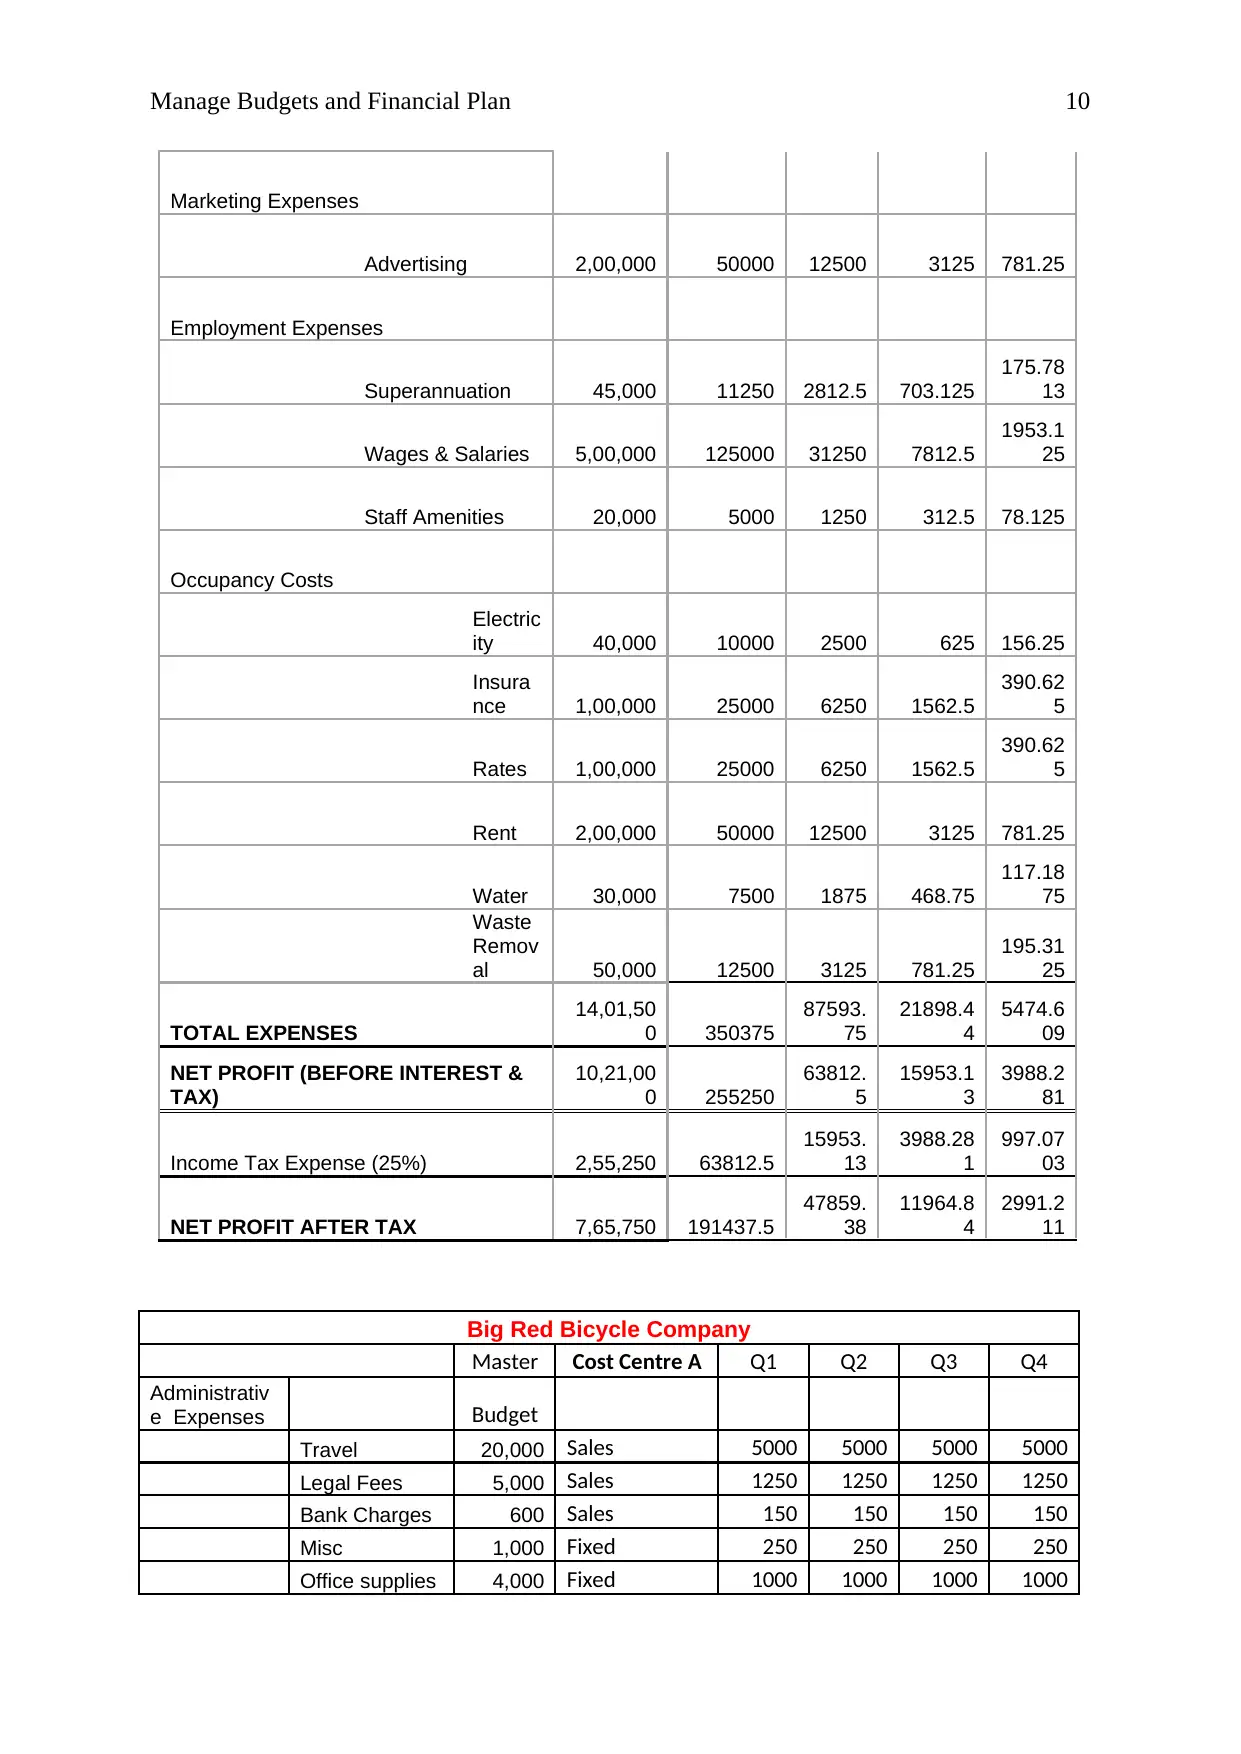
This project report focuses on managing budgets and financial plans for a company, covering Part 1: Develop Master Budget & Cost Centre Budget. It includes a master budget, cost centre budget, and a contingency plan to address company changes. The report analyzes the company's financial performance, comparing budgeted and actual figures, and evaluating variances to identify areas for improvement. It also reviews the company's revenue and expenses, highlighting the impact of variances on profitability. The report emphasizes strategic planning, including how to manage costs and enhance profits. References are provided to support the analysis. The appendix includes a detailed budget variation report for the fiscal year 2011/2012, with calculations and data for revenue, expenses, and cost centers. The report provides insights into the company's financial position and suggests areas for improvement. Additionally, it presents a master budget and cost center details for the Big Red Bicycle Company.
1 out of 10
Related Documents


Your All-in-One AI-Powered Toolkit for Academic Success.
+13062052269
info@desklib.com
Available 24*7 on WhatsApp / Email
![[object Object]](/_next/static/media/star-bottom.7253800d.svg)
Copyright © 2020–2026 A2Z Services. All Rights Reserved. Developed and managed by ZUCOL.