Financial Plan, Analysis, and Forecasting Results for Prorich

Verified

Added on  2020/05/08

|16
|2974
|178
Report
AI Summary
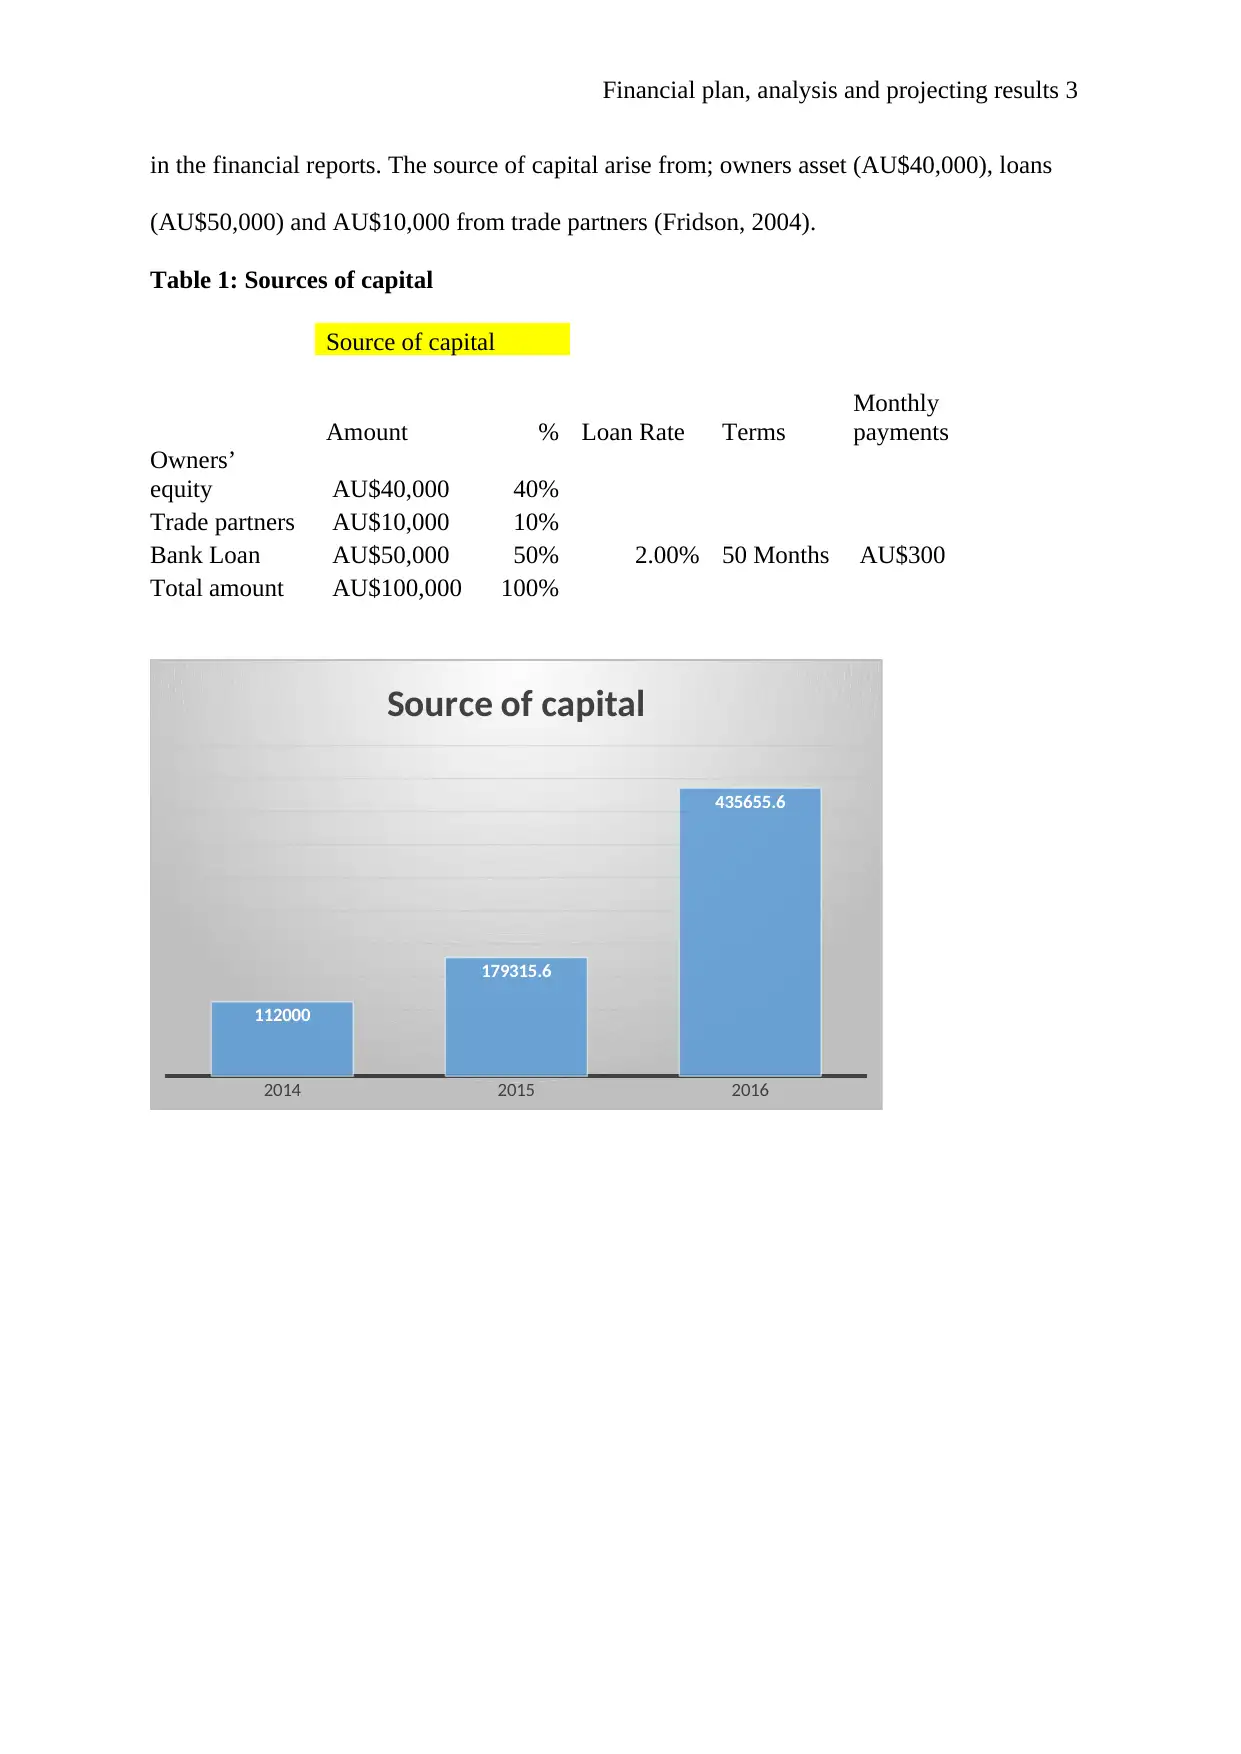
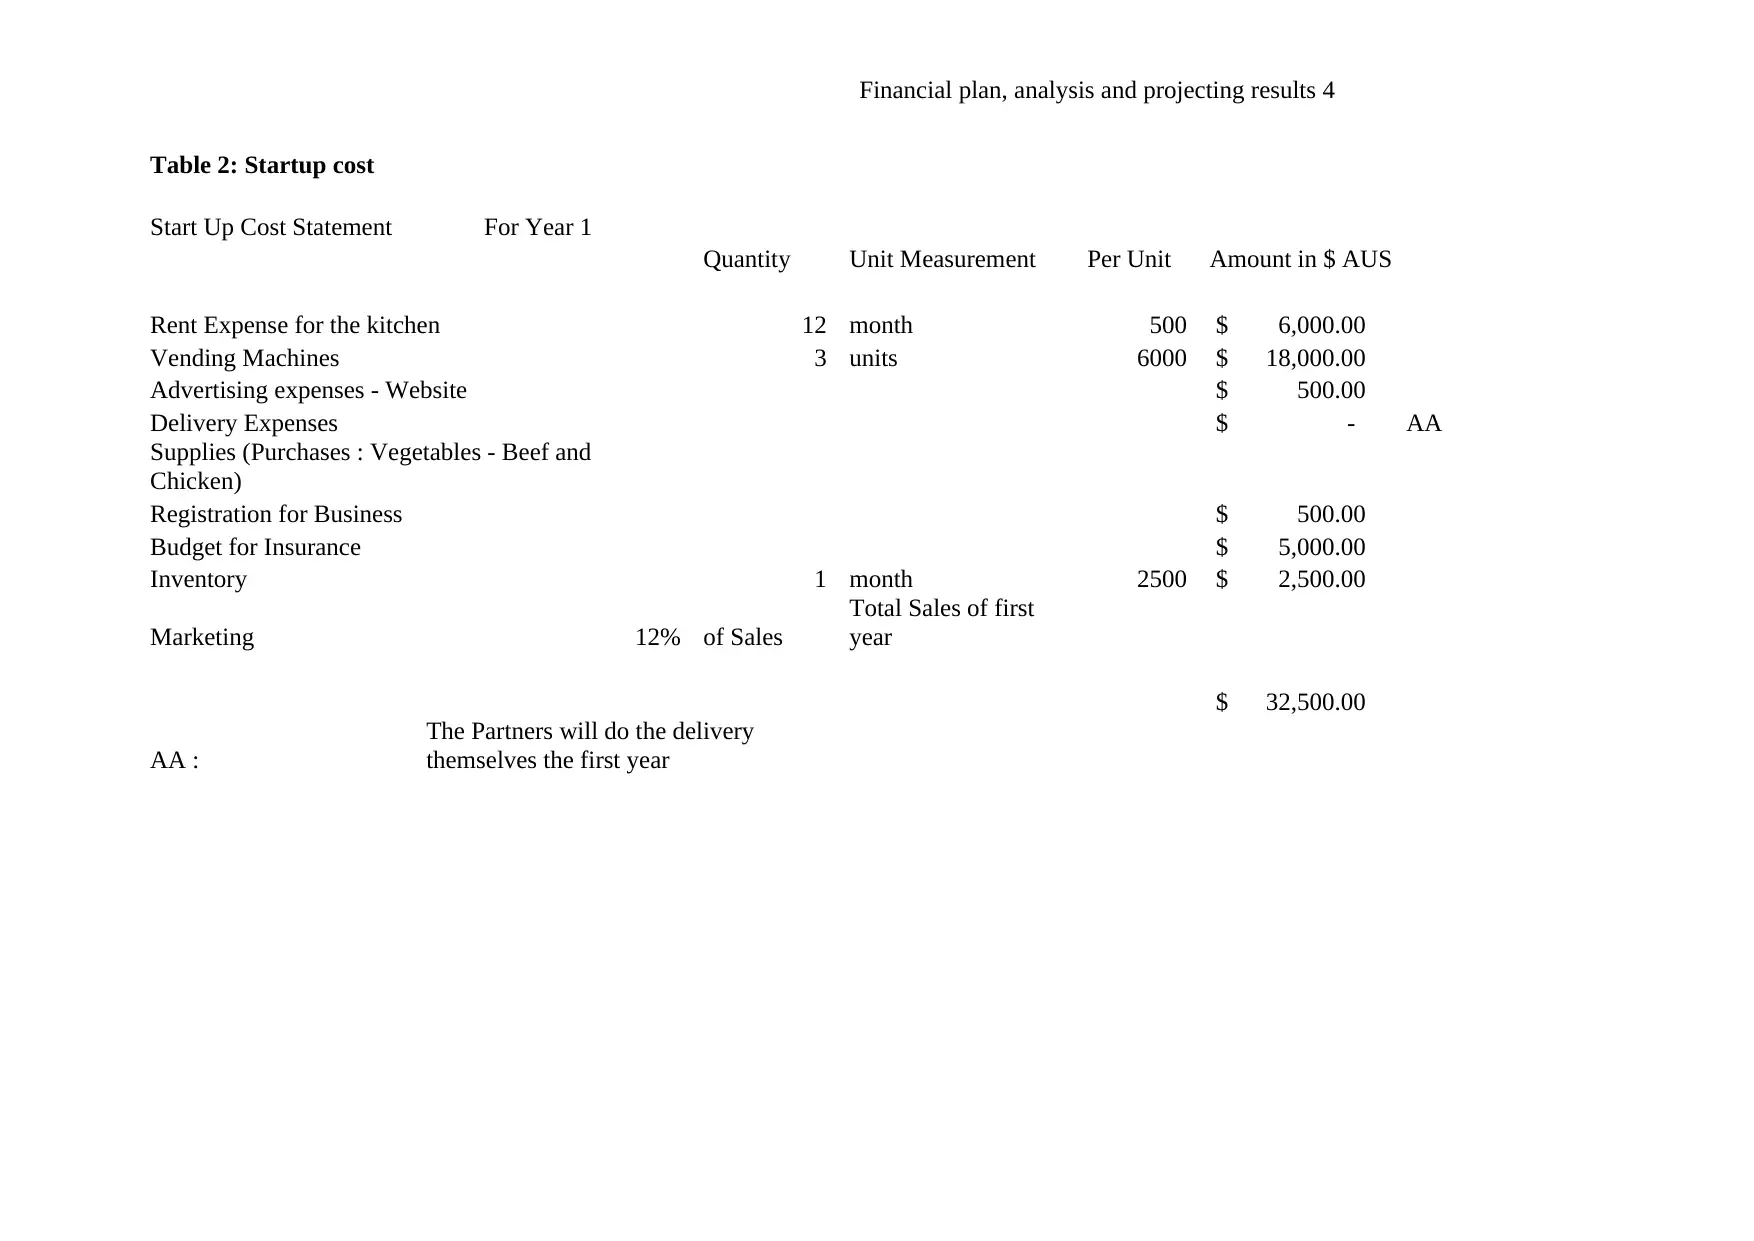
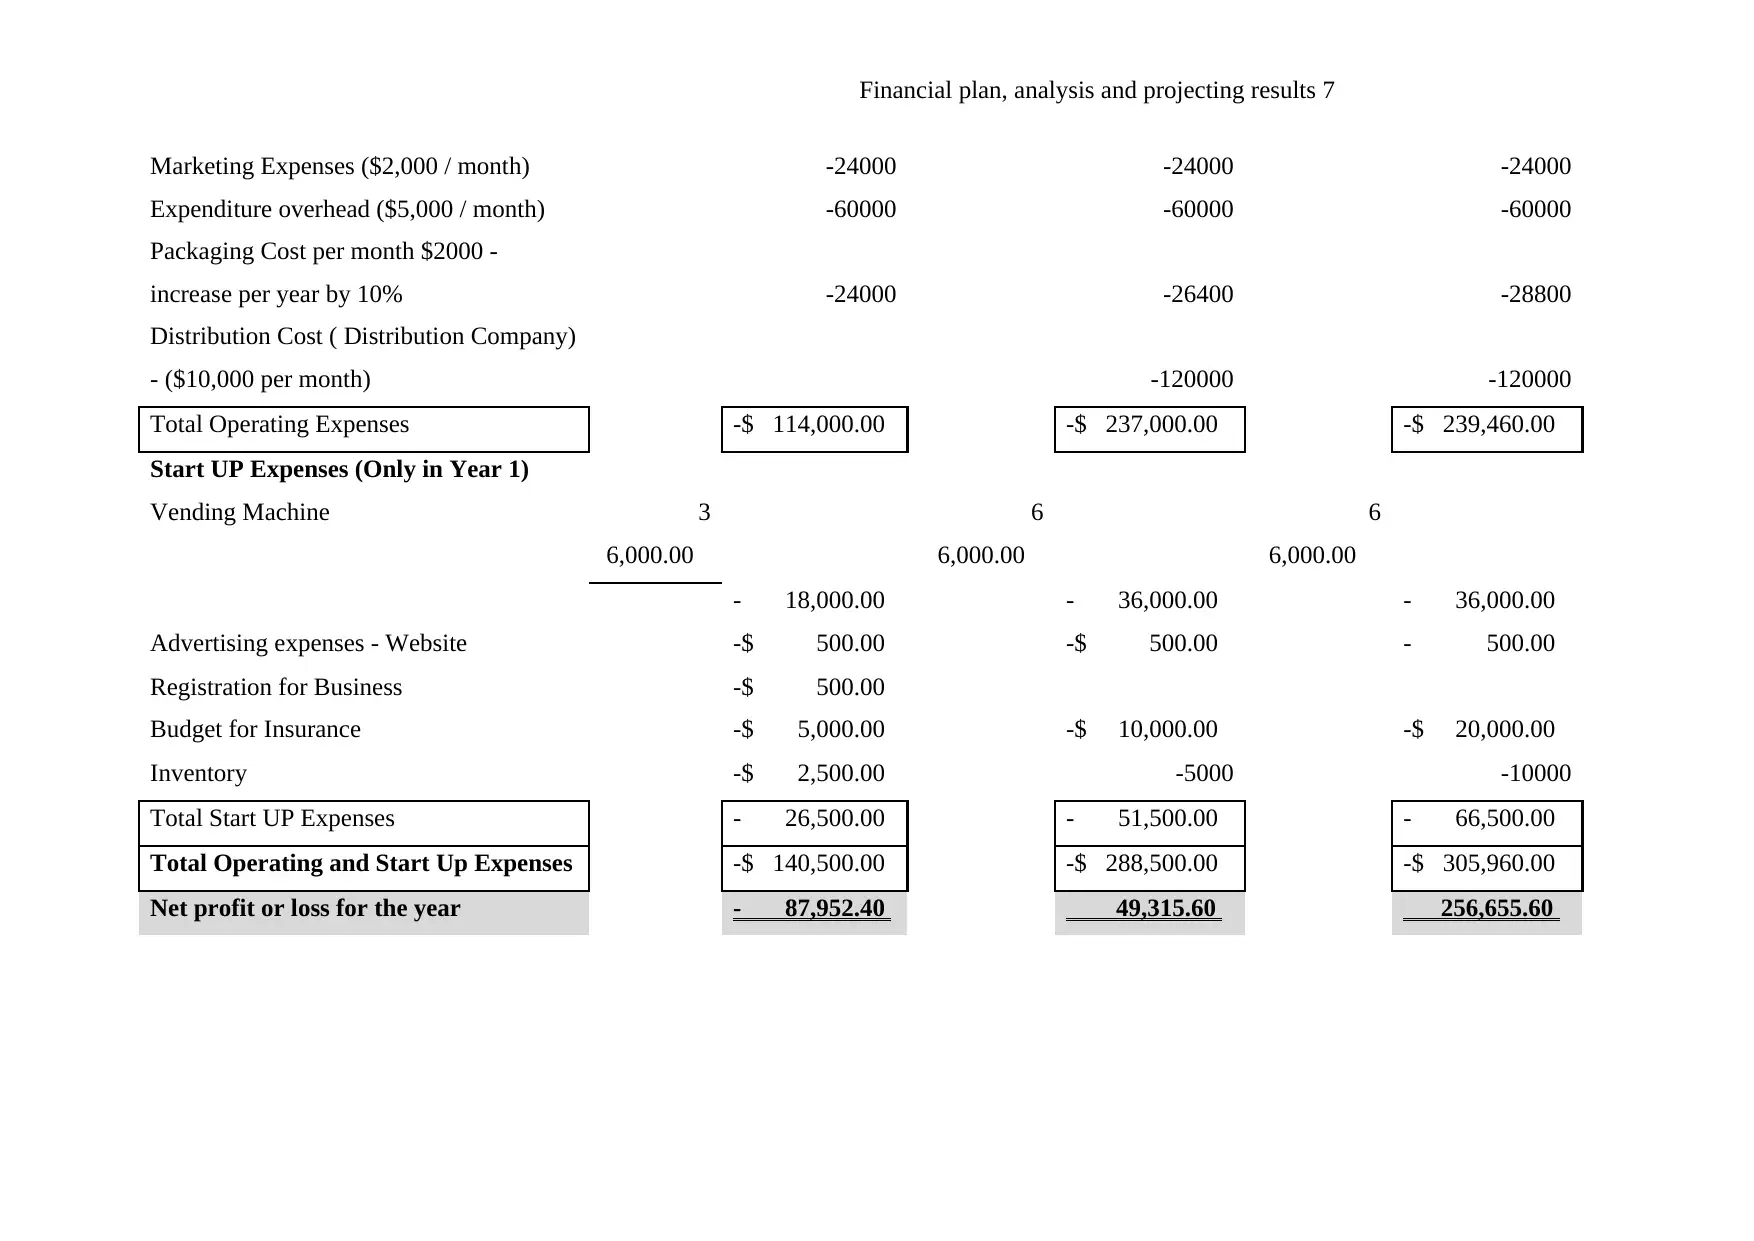
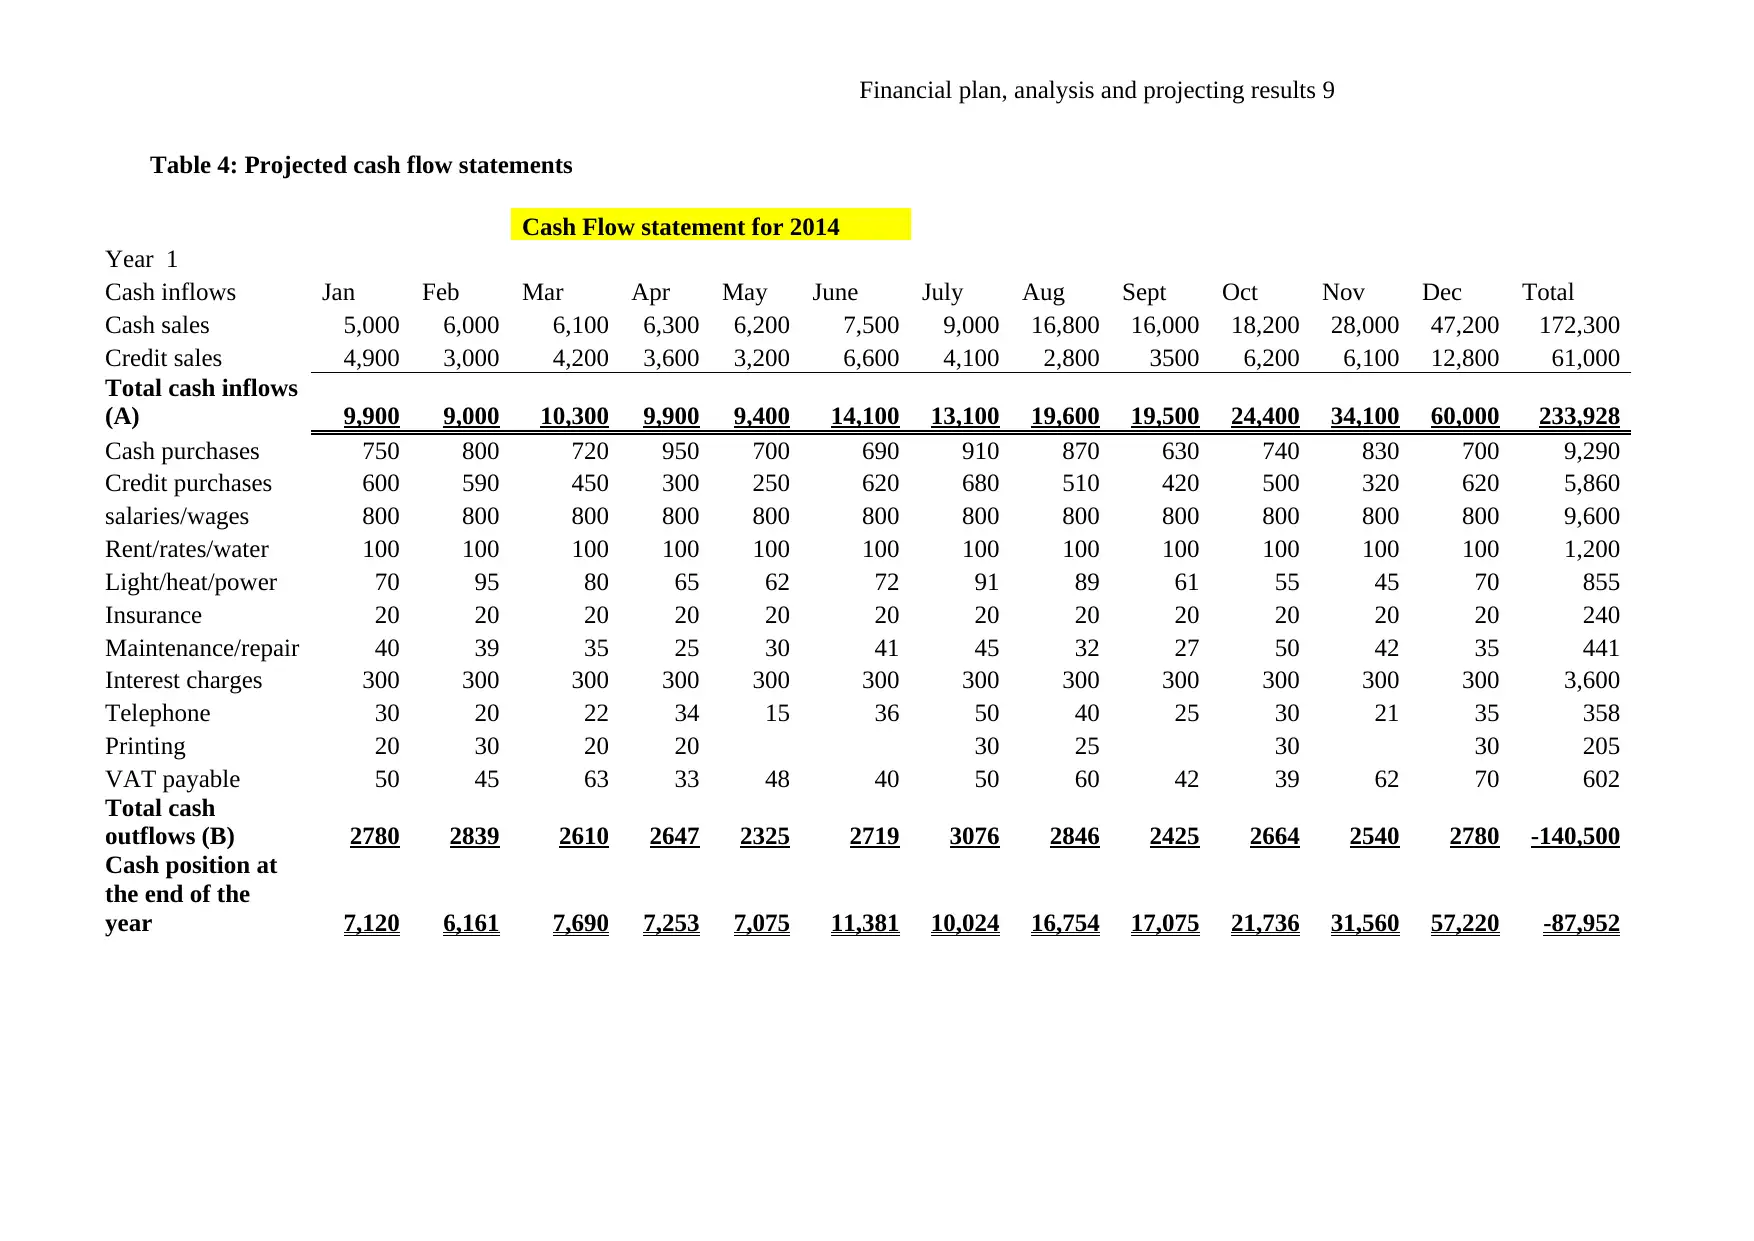
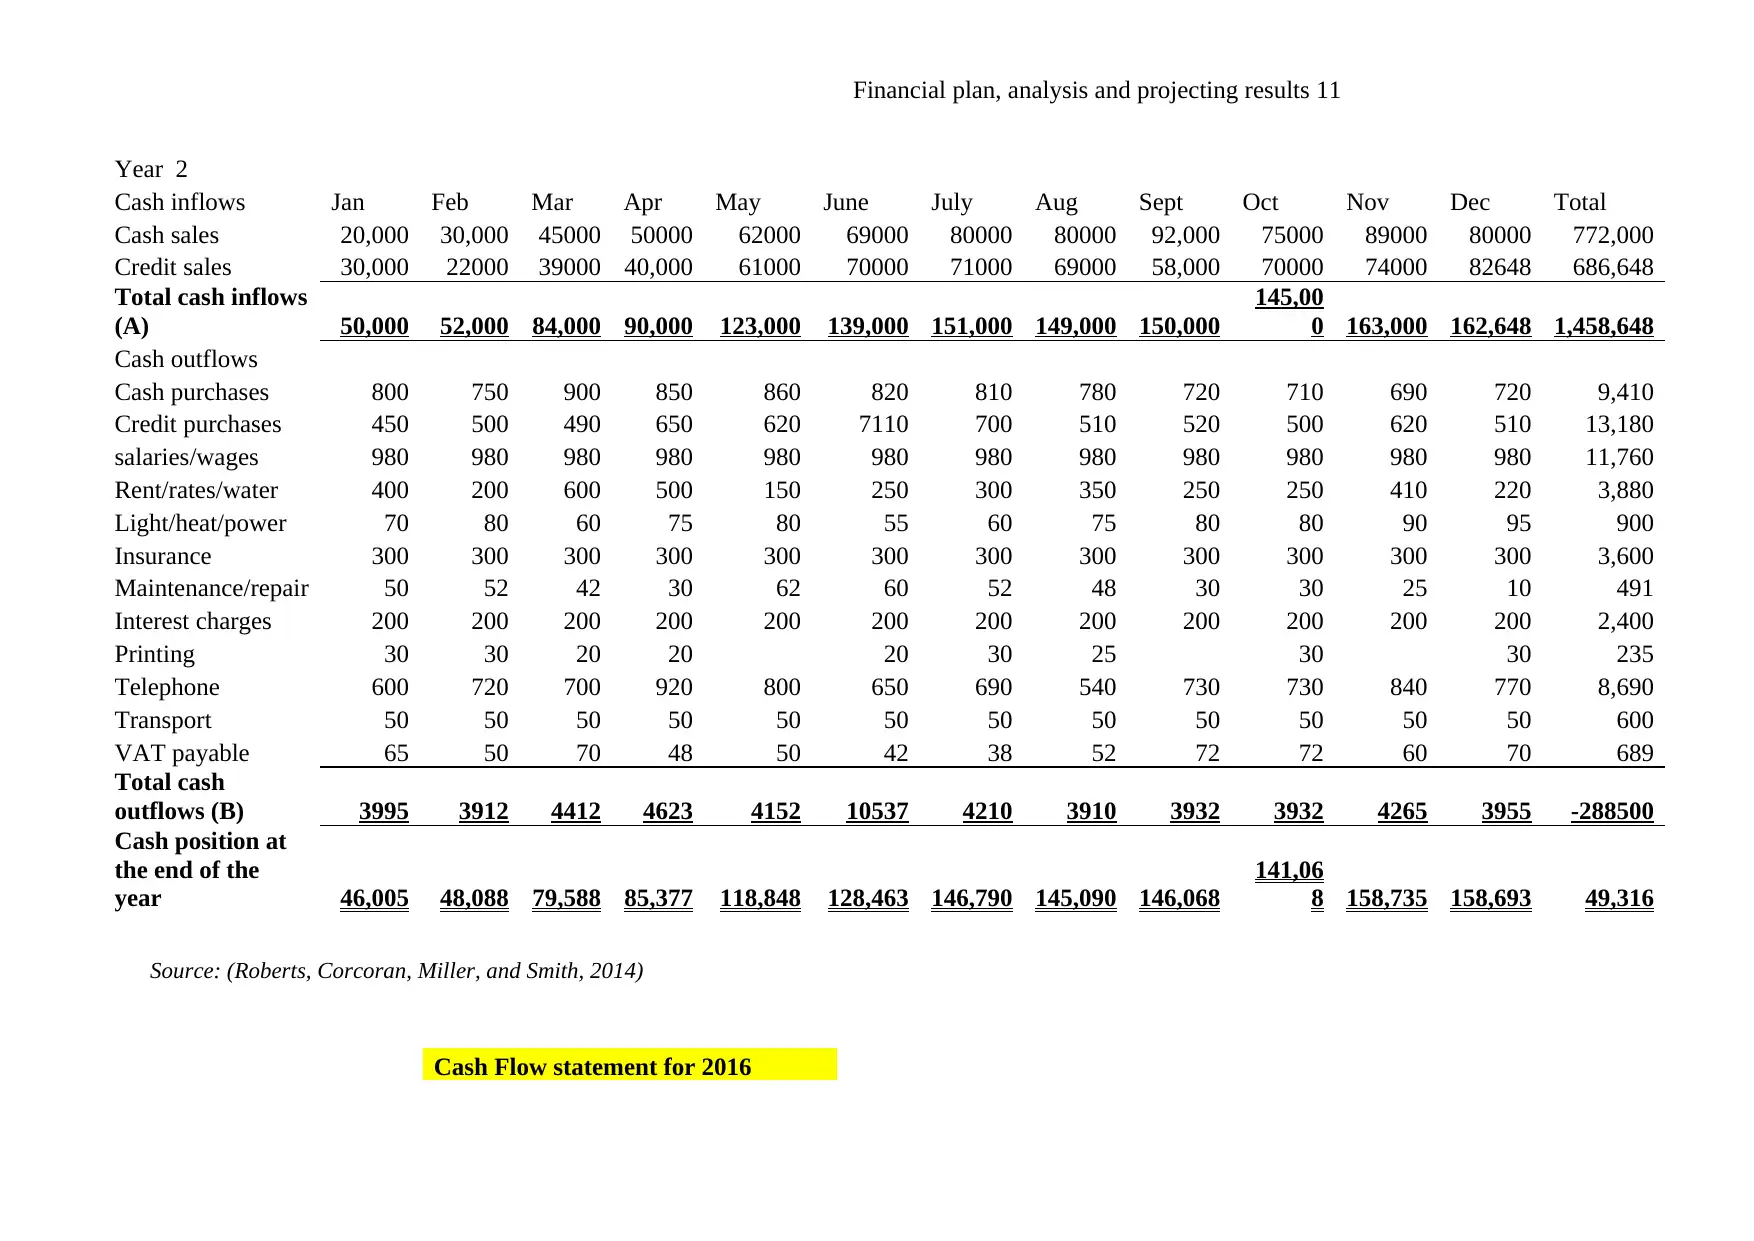
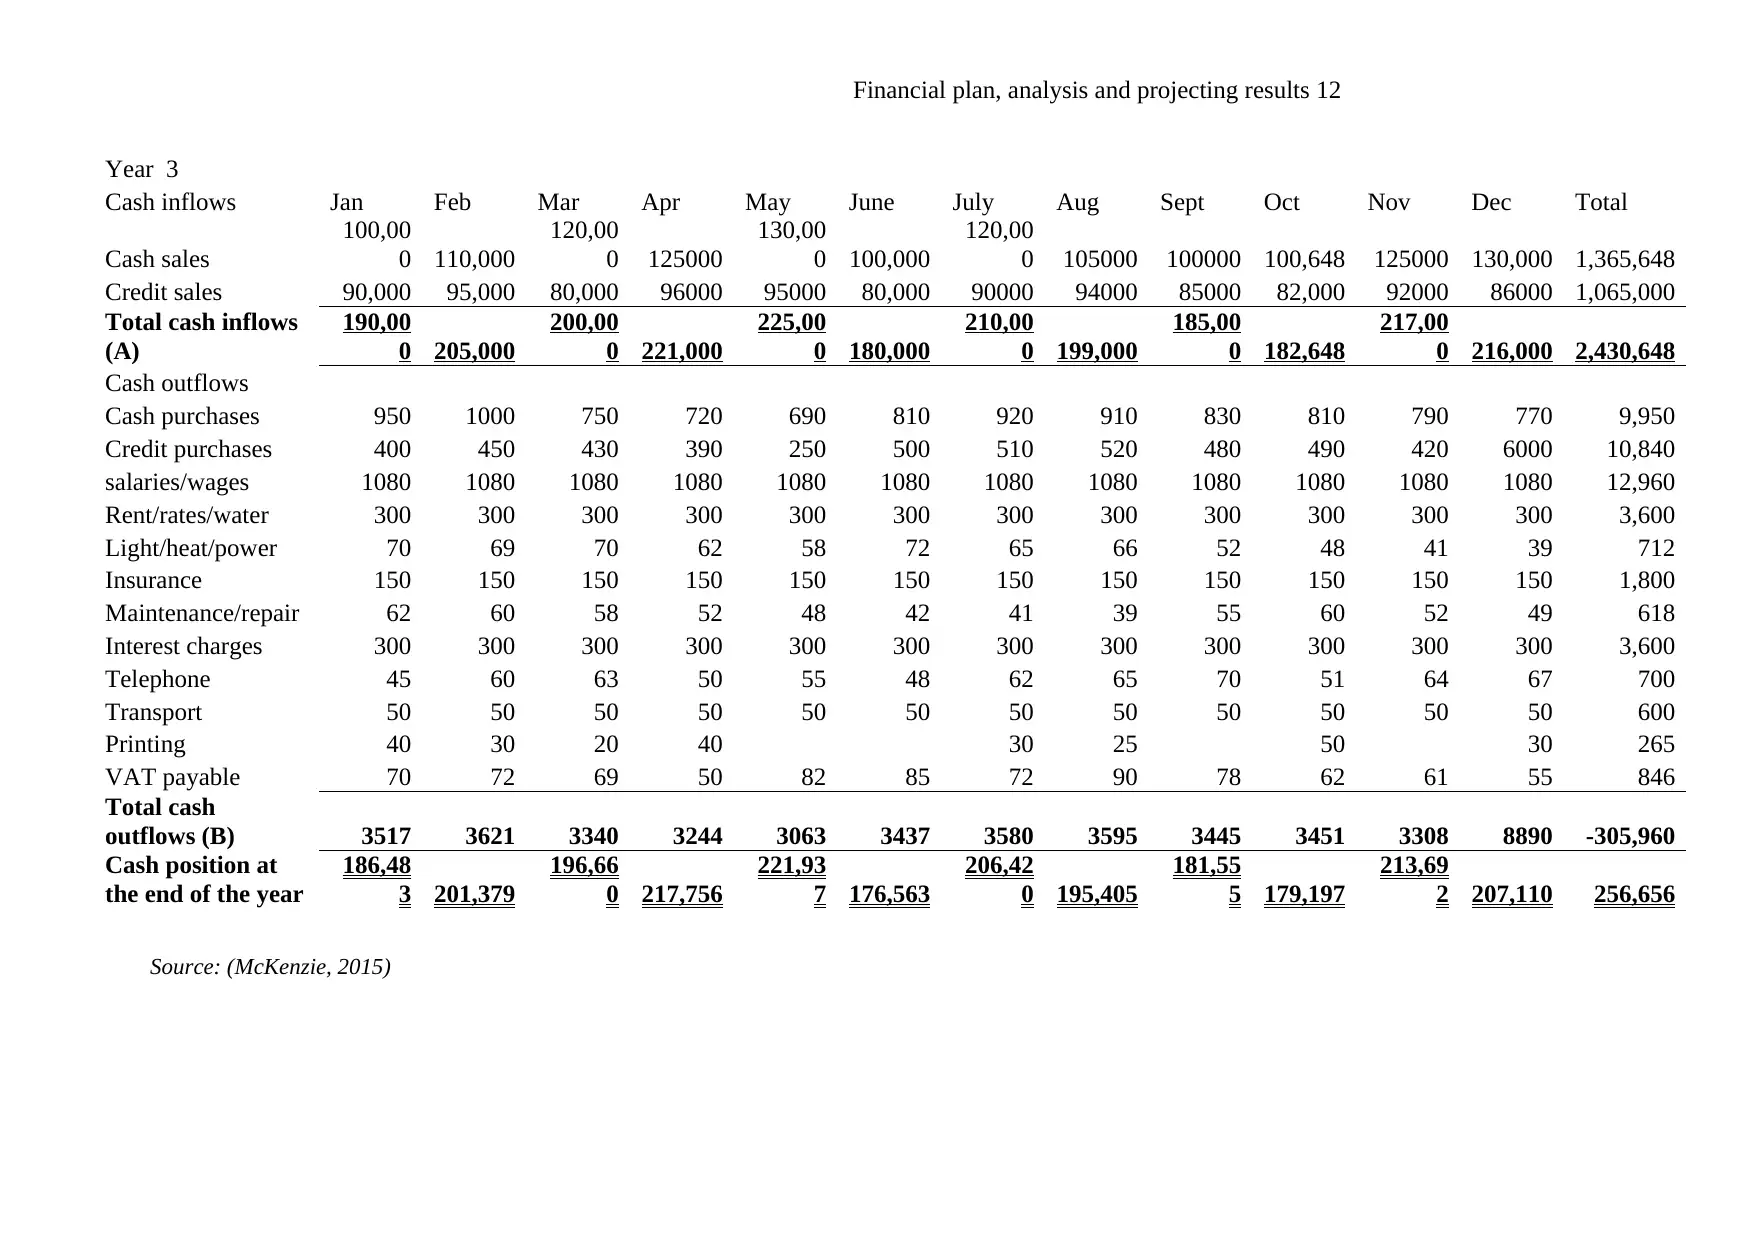
This report presents a detailed financial plan, analysis, and forecasting results for a vending machine business named Prorich. It includes startup cost analysis, projected income statements for three years, and cash flow projections. The report details the sources of capital, including owner's equity, trade partners, and a bank loan. It also includes a break-even analysis and business risk assessment. The financial projections encompass revenue, cost of sales, operating expenses, and net profit or loss. The cash flow statements provide monthly cash inflows and outflows for each year, offering insights into the business's financial health. The report also includes a projected balance sheet outlining the company's assets, liabilities, and equity over the three-year period. The report is a comprehensive financial analysis designed to evaluate the business's viability and financial performance.
tabler-icon-diamond-filled.svg

Contribute Materials

Your contribution can guide someone’s learning journey. Share your documents today.
Document Page
Financial plan, analysis and projecting results 1
FINANCIAL PLAN, ANALYSIS AND FORECASTING RESULTS
By Name
Course Title
Instructor’s name
Name of Institution
Name of Department
tabler-icon-diamond-filled.svg

Secure Best Marks with AI Grader

Need help grading? Try our AI Grader for instant feedback on your assignments.
Document Page
Financial plan, analysis and projecting results 2
Financial plan, analysis and estimating results
The aspect of financial projection is basically established based on logistic and accounting
expert who is proficient in financial accountant (DeYoung, and Baas, 2012). At preliminary
stage, the business will capitalize on acquiring long period loans from diverse financial
organizations with significant lower rates of interest as well as its own assets to expedite the
sufficient resources to meet the entire business forecasts.
Assumption in preparing the business financial plan
Most significant hypothesis in the financial plan is the cash flow statements that will offer a
cash flow for one years and cash flows for at least three years and the point in sales and value
to break even (Healy, Paul, and Krishna, 2012). The business plan also includes significant
forecasts based on the likelihood examination and braced by the new inclination in the hotel
industry markets. In this case, the business plan entirely depend on the below assumptions;
The obtainable capital equity will basically facilitate financial support of diverse
business activities.
There will be a enhanced growth of the Australian economy in the town since there is
little competition in the city of Melbourne (Hamilton, 2011).
There is also an immaterial influence on technological tendency that may basically
render the business and its goods and services to be obsolete.
Simplified financial projections and analysis
Finance
Prorich vending machine will basically require AU$100, 000 as a startup capital for labor
force, leasing business space, business permit, supplies, vending machine, legal expense,
advertisements and credit repayments (Hollensen, 2015). The project plan depends heavily
upon any necessary reservations that may arise in the due course of the business as projected
Document Page
Financial plan, analysis and projecting results 3
in the financial reports. The source of capital arise from; owners asset (AU$40,000), loans
(AU$50,000) and AU$10,000 from trade partners (Fridson, 2004).
Table 1: Sources of capital
Source of capital
Amount % Loan Rate Terms
Monthly
payments
Owners’
equity AU$40,000 40%
Trade partners AU$10,000 10%
Bank Loan AU$50,000 50% 2.00% 50 Months AU$300
Total amount AU$100,000 100%
2014 2015 2016
112000
179315.6
435655.6
Source of capital
Document Page
Financial plan, analysis and projecting results 4
Table 2: Startup cost
Start Up Cost Statement For Year 1
Quantity Unit Measurement Per Unit Amount in $ AUS
Rent Expense for the kitchen 12 month 500 $ 6,000.00
Vending Machines 3 units 6000 $ 18,000.00
Advertising expenses - Website $ 500.00
Delivery Expenses $ - AA
Supplies (Purchases : Vegetables - Beef and
Chicken)
Registration for Business $ 500.00
Budget for Insurance $ 5,000.00
Inventory 1 month 2500 $ 2,500.00
Marketing 12% of Sales
Total Sales of first
year
$ 32,500.00
AA :
The Partners will do the delivery
themselves the first year
tabler-icon-diamond-filled.svg

Secure Best Marks with AI Grader

Need help grading? Try our AI Grader for instant feedback on your assignments.
Document Page
Financial plan, analysis and projecting results 5
Projected income statement
Projected income statement is considered to be an estimate of the financial results that a
business will see in a future period of time (Diamond, and Tolley, 2013). The statement
usually measures the business future expenses and income, it also shows losses and profits
for a specific future period.
Document Page
Financial plan, analysis and projecting results 6
Table 3: Projected income statement
2014 2015 2016
Units Amount in $ Units Amount in $ Units Amount in $
Number of Vending Machines ( Number
of Gym) 3 9 15
Number of Meals Per Vending Machine 12 25 25
12,960.00 81,000.00 135,000.00
Revenue
Sales ( $ 18 per meal ) 649.80 4,051.80 6,751.80
Sales - Per Year 233,928.00 1,458,648.00 2,430,648.00
Cost of Sales
Gym takes 5% - 11,696.40 - 72,932.40 - 121,532.40
Cost of the meals ($ 12 per meal ) - 155,520.00 - 972,000.00 - 1,620,000.00
Shelf Life Test - 2,500.00 - 3,000.00 - 5,000.00
Commission to Gym (90 Cents per meal) - 11,664.00 - 72,900.00 - 121,500.00
Cost Per Year - 181,380.40 - 1,120,832.40 - 1,868,032.40
Gross Margin 52,547.60 337,815.60 562,615.60
Operating Expenses
Rent Expense (Rent of Shared kitchen in
St.Kilda) - increase 10% each year -$6,000.00 -$6,600.00 -$6,660.00
Document Page
Financial plan, analysis and projecting results 7
Marketing Expenses ($2,000 / month) -24000 -24000 -24000
Expenditure overhead ($5,000 / month) -60000 -60000 -60000
Packaging Cost per month $2000 -
increase per year by 10% -24000 -26400 -28800
Distribution Cost ( Distribution Company)
- ($10,000 per month) -120000 -120000
Total Operating Expenses -$ 114,000.00 -$ 237,000.00 -$ 239,460.00
Start UP Expenses (Only in Year 1)
Vending Machine 3 6 6
6,000.00 6,000.00 6,000.00
- 18,000.00 - 36,000.00 - 36,000.00
Advertising expenses - Website -$ 500.00 -$ 500.00 - 500.00
Registration for Business -$ 500.00
Budget for Insurance -$ 5,000.00 -$ 10,000.00 -$ 20,000.00
Inventory -$ 2,500.00 -5000 -10000
Total Start UP Expenses - 26,500.00 - 51,500.00 - 66,500.00
Total Operating and Start Up Expenses -$ 140,500.00 -$ 288,500.00 -$ 305,960.00
Net profit or loss for the year - 87,952.40 49,315.60 256,655.60
tabler-icon-diamond-filled.svg

Paraphrase This Document

Need a fresh take? Get an instant paraphrase of this document with our AI Paraphraser
Document Page
Financial plan, analysis and projecting results 8
Projected cash flow statements
Cash flow statements often provide a comprehensive entries of cash outflows and inflows
data in a precise manner.in this case, Prorich vending machine is seeking capital that amounts
to AU$100,000 (Barringer, 2012). Conversely, the business may be forced to require more
funds in case of expansion. The below table demonstrate Prorich vending machine cash flows
for each of the three years (2014 – 2016) (Economides, 2012).
Document Page
Financial plan, analysis and projecting results 9
Table 4: Projected cash flow statements
Cash Flow statement for 2014
Year 1
Cash inflows Jan Feb Mar Apr May June July Aug Sept Oct Nov Dec Total
Cash sales 5,000 6,000 6,100 6,300 6,200 7,500 9,000 16,800 16,000 18,200 28,000 47,200 172,300
Credit sales 4,900 3,000 4,200 3,600 3,200 6,600 4,100 2,800 3500 6,200 6,100 12,800 61,000
Total cash inflows
(A) 9,900 9,000 10,300 9,900 9,400 14,100 13,100 19,600 19,500 24,400 34,100 60,000 233,928
Cash purchases 750 800 720 950 700 690 910 870 630 740 830 700 9,290
Credit purchases 600 590 450 300 250 620 680 510 420 500 320 620 5,860
salaries/wages 800 800 800 800 800 800 800 800 800 800 800 800 9,600
Rent/rates/water 100 100 100 100 100 100 100 100 100 100 100 100 1,200
Light/heat/power 70 95 80 65 62 72 91 89 61 55 45 70 855
Insurance 20 20 20 20 20 20 20 20 20 20 20 20 240
Maintenance/repair 40 39 35 25 30 41 45 32 27 50 42 35 441
Interest charges 300 300 300 300 300 300 300 300 300 300 300 300 3,600
Telephone 30 20 22 34 15 36 50 40 25 30 21 35 358
Printing 20 30 20 20 30 25 30 30 205
VAT payable 50 45 63 33 48 40 50 60 42 39 62 70 602
Total cash
outflows (B) 2780 2839 2610 2647 2325 2719 3076 2846 2425 2664 2540 2780 -140,500
Cash position at
the end of the
year 7,120 6,161 7,690 7,253 7,075 11,381 10,024 16,754 17,075 21,736 31,560 57,220 -87,952
Document Page
Financial plan, analysis and projecting results 10
Cash Flow statement for 2015
tabler-icon-diamond-filled.svg

Secure Best Marks with AI Grader

Need help grading? Try our AI Grader for instant feedback on your assignments.
Document Page
Financial plan, analysis and projecting results 11
Year 2
Cash inflows Jan Feb Mar Apr May June July Aug Sept Oct Nov Dec Total
Cash sales 20,000 30,000 45000 50000 62000 69000 80000 80000 92,000 75000 89000 80000 772,000
Credit sales 30,000 22000 39000 40,000 61000 70000 71000 69000 58,000 70000 74000 82648 686,648
Total cash inflows
(A) 50,000 52,000 84,000 90,000 123,000 139,000 151,000 149,000 150,000
145,00
0 163,000 162,648 1,458,648
Cash outflows
Cash purchases 800 750 900 850 860 820 810 780 720 710 690 720 9,410
Credit purchases 450 500 490 650 620 7110 700 510 520 500 620 510 13,180
salaries/wages 980 980 980 980 980 980 980 980 980 980 980 980 11,760
Rent/rates/water 400 200 600 500 150 250 300 350 250 250 410 220 3,880
Light/heat/power 70 80 60 75 80 55 60 75 80 80 90 95 900
Insurance 300 300 300 300 300 300 300 300 300 300 300 300 3,600
Maintenance/repair 50 52 42 30 62 60 52 48 30 30 25 10 491
Interest charges 200 200 200 200 200 200 200 200 200 200 200 200 2,400
Printing 30 30 20 20 20 30 25 30 30 235
Telephone 600 720 700 920 800 650 690 540 730 730 840 770 8,690
Transport 50 50 50 50 50 50 50 50 50 50 50 50 600
VAT payable 65 50 70 48 50 42 38 52 72 72 60 70 689
Total cash
outflows (B) 3995 3912 4412 4623 4152 10537 4210 3910 3932 3932 4265 3955 -288500
Cash position at
the end of the
year 46,005 48,088 79,588 85,377 118,848 128,463 146,790 145,090 146,068
141,06
8 158,735 158,693 49,316
Source: (Roberts, Corcoran, Miller, and Smith, 2014)
Cash Flow statement for 2016
Document Page
Financial plan, analysis and projecting results 12
Year 3
Cash inflows Jan Feb Mar Apr May June July Aug Sept Oct Nov Dec Total
Cash sales
100,00
0 110,000
120,00
0 125000
130,00
0 100,000
120,00
0 105000 100000 100,648 125000 130,000 1,365,648
Credit sales 90,000 95,000 80,000 96000 95000 80,000 90000 94000 85000 82,000 92000 86000 1,065,000
Total cash inflows
(A)
190,00
0 205,000
200,00
0 221,000
225,00
0 180,000
210,00
0 199,000
185,00
0 182,648
217,00
0 216,000 2,430,648
Cash outflows
Cash purchases 950 1000 750 720 690 810 920 910 830 810 790 770 9,950
Credit purchases 400 450 430 390 250 500 510 520 480 490 420 6000 10,840
salaries/wages 1080 1080 1080 1080 1080 1080 1080 1080 1080 1080 1080 1080 12,960
Rent/rates/water 300 300 300 300 300 300 300 300 300 300 300 300 3,600
Light/heat/power 70 69 70 62 58 72 65 66 52 48 41 39 712
Insurance 150 150 150 150 150 150 150 150 150 150 150 150 1,800
Maintenance/repair 62 60 58 52 48 42 41 39 55 60 52 49 618
Interest charges 300 300 300 300 300 300 300 300 300 300 300 300 3,600
Telephone 45 60 63 50 55 48 62 65 70 51 64 67 700
Transport 50 50 50 50 50 50 50 50 50 50 50 50 600
Printing 40 30 20 40 30 25 50 30 265
VAT payable 70 72 69 50 82 85 72 90 78 62 61 55 846
Total cash
outflows (B) 3517 3621 3340 3244 3063 3437 3580 3595 3445 3451 3308 8890 -305,960
Cash position at
the end of the year
186,48
3 201,379
196,66
0 217,756
221,93
7 176,563
206,42
0 195,405
181,55
5 179,197
213,69
2 207,110 256,656
Source: (McKenzie, 2015)
Document Page
Financial plan, analysis and projecting results 13
2014 2015 2016
Series1
Source: (Wedel, M., & Kamakura, 2012)
Projected balance sheet
A balance sheet is considered to be a financial report that usually shows the business
shareholders equity, liabilities and assets at a particular period of time. The table below
basically shows the Prorich vending machine shareholders equity, liabilities and assets for
each year (Connole, Shannon, Watson, Wrisberg, Etzel, and Schimmel, 2014).
Table 4: Projected balance sheet statements
Balance sheet
2014 2015 2016
Assets
Current Assets
Cash AU$40,000 AU$100,000 AU$200,000
Inventories AU$50,000 AU$180,000 AU$200,000
Receivables AU$15,000 AU$25,000 AU$30,000
Other current assets AU$35,000 AU$45,315.60 AU$55,655.60
Fixed assets
Plant, property and
Equipment AU$30,000 AU$70,000 AU$150,000
Total Assets AU$112,000
AU$179,315.6
0
AU$435,655.6
0
Equity and Liabilities
Current Liabilities
Accounts Payable AU$22,000 AU$40,000 AU$800,000
Long-Term Liabilities
Long Term Loans AU$50,000 AU$50,000 AU$50,000
tabler-icon-diamond-filled.svg

Paraphrase This Document

Need a fresh take? Get an instant paraphrase of this document with our AI Paraphraser
Document Page
Financial plan, analysis and projecting results 14
Total Liabilities AU$72,000 AU$90,000 AU$130,000
Shareholders capital AU$40,000 AU$40,000 AU$40,000
Retained Income 0.00 49,315.60 265,655.60
Total shareholders capital AU$40,000 AU$89,315.60
AU$305,655.6
0
Total capital and liabilities AU$112,000
AU$179,315.6
0
AU$435,655.6
0
Source: (Weinstein, 2013)
Break even analysis
Break even examination basically sums up the amount that incomes outweighs the point to
which the company starts to make income (Schutz, Rezg, and Léger, 2013). For this case,
Prorich vending machine utilizes the following data, PBIT and total fixed expenses.
Revenue Margin (Sales %)
Gross profit margins 562615.6
Total direct expense -305960
Net profit margin 256655.6
Total fixed expenditures
Operational expenses -305,960
Break Even sales in AU$ (annual)
PBIT 256,656
Total fixed expenses 32500
Amount to Break Even (yearly) 256,656
2014 2015 2016
Balance sheet
Document Page
Financial plan, analysis and projecting results 15
Source: (McKeever, 2016)
Break-Even Point
(units) = 8,000
Break-Even Point
($'s) = $64,000
Total Fixed Costs TFC = $32,500 Formulas:
Variable Cost per Unit VCU = $10.00 BEP (units) = TFC/(SPU-VCU)
Sales Price per Unit SPU = $18.00 BEP ($'s) = BEP (units) * SPU
Business risk analysis
Management of risk is considered to be a process in which the business identify the types of
risks exposure within. Since almost all the investments and organizations are often exposed to
risk (Club, and Chen, 2015). Prorich vending machine will also be exposed to significant
risks that need to be measured. In this case, since the outcome of most business activities are
uncertain, they usually contain some elements of risks (Parks, Olson, & Bokor, 2015).
Table 6: Prorich vending machine business analysis of probability and consequences
Risk factor Consequences Probability Potential impact
Technical failure High Medium Serious
Competitor first to market High Low Moderate
Loss of lead chef High Low Serious
Cut of budget Medium Low Minor
Source: (Schaper, Volery, Weber, and Gibson, 2014)
Document Page
Financial plan, analysis and projecting results 16
Bibliography
Barringer, B. 2012. Entrepreneurship: Successfully Launching New Ventures, (2012).
Blank, S. 2013. Why the lean start-up changes everything. Harvard Business Review, 91(5),
63-72.
Connole, I. J., Shannon, V. R., Watson, J. C., Wrisberg, C., Etzel, E., & Schimmel, C. 2014.
NCAA athletic administrators' preferred characteristics for sport psychology positions: a
consumer market analysis. Sport Psychologist, 28(4), 406-417.
Club, B., & Chen, Z. 2015. Business Plan.
DeYoung, A., & Baas, T. K. 2012. Making the Case for a Strong Public Research University:
The University of Kentucky Top-20 Business Plan. The University in the Age of
Globalization: Rankings, Resources and Reforms, 82.
Diamond, D. B., & Tolley, G. S. (Eds.). 2013. The economics of urban amenities. Elsevier.
Economides, N., & Tåg, J. 2012. Network neutrality on the Internet: A two-sided market
analysis. Information Economics and Policy, 24(2), 91-104.
Fridson, M. S. 2004. The Investor's Guide to Economic Fundamentals (a review) The
Investor's Guide to Economic Fundamentals John Calverley John Wiley & Sons, Ltd. The
Atrium, Southern Gate, Chichester, West Sussex PO19 8SQ, England (+44) 1243 779777,
www.wiley.com. 242 pages, $79.95." Financial Analysts Journal 60.3: 91-92. Web.
<10.2469/faj.v60.n3.2625>.
Healy, Paul, and Krishna Palepu. 2012. Business Analysis Valuation: Using Financial
Statements. Cengage Learning,
Hamilton, C. 2011. Keep Right LLC, business plan (Doctoral dissertation).
Hollensen, S. 2015. Marketing management: A relationship approach. Pearson Education.
McKeever, Mike. 2016. How to write a business plan. Nolo
McKenzie, D. 2015. Identifying and Spurring High-Growth Entrepreneurship.
chevron_up_icon
1 out of 16
circle_padding
hide_on_mobile
zoom_out_icon
logo.png

Your All-in-One AI-Powered Toolkit for Academic Success.

Available 24*7 on WhatsApp / Email

[object Object]