University Business Planning Report: Financial Analysis and Budgeting
VerifiedAdded on 2022/12/30
|21
|2311
|40
Report
AI Summary
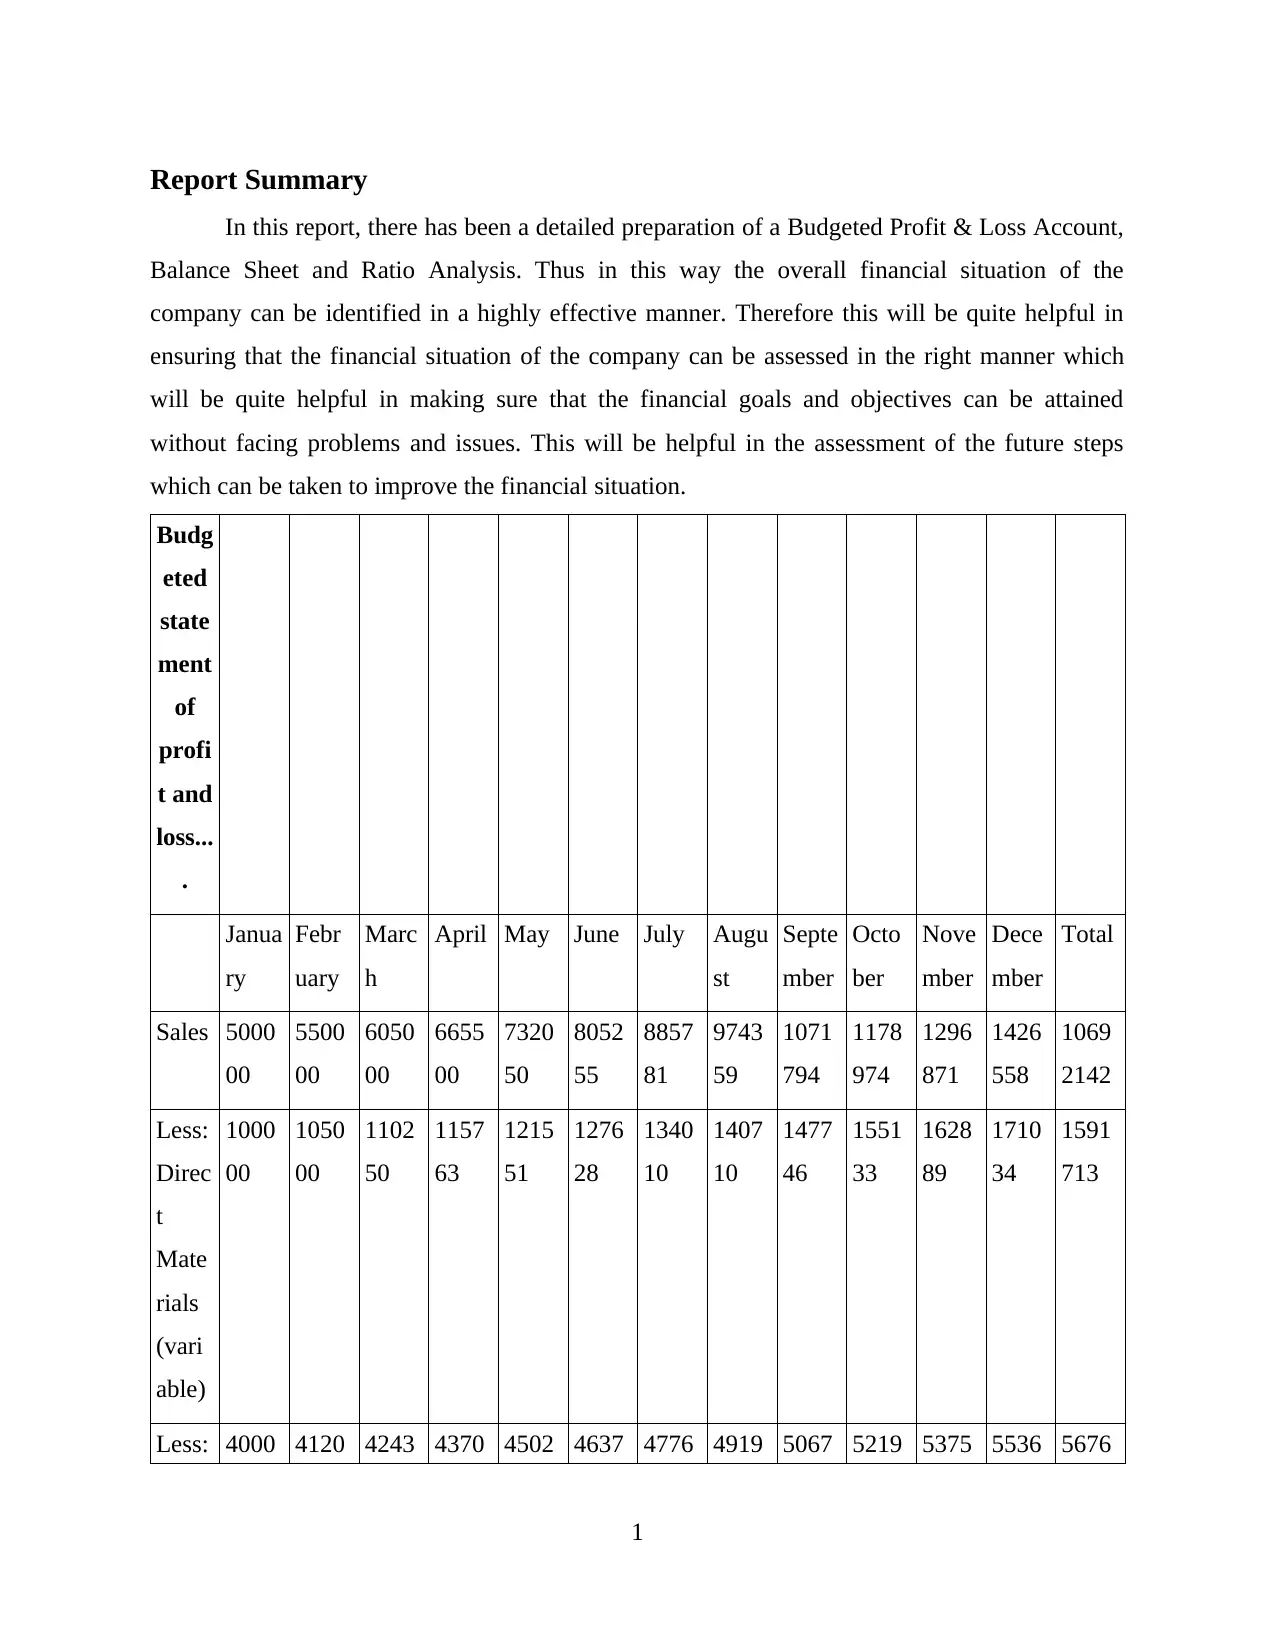
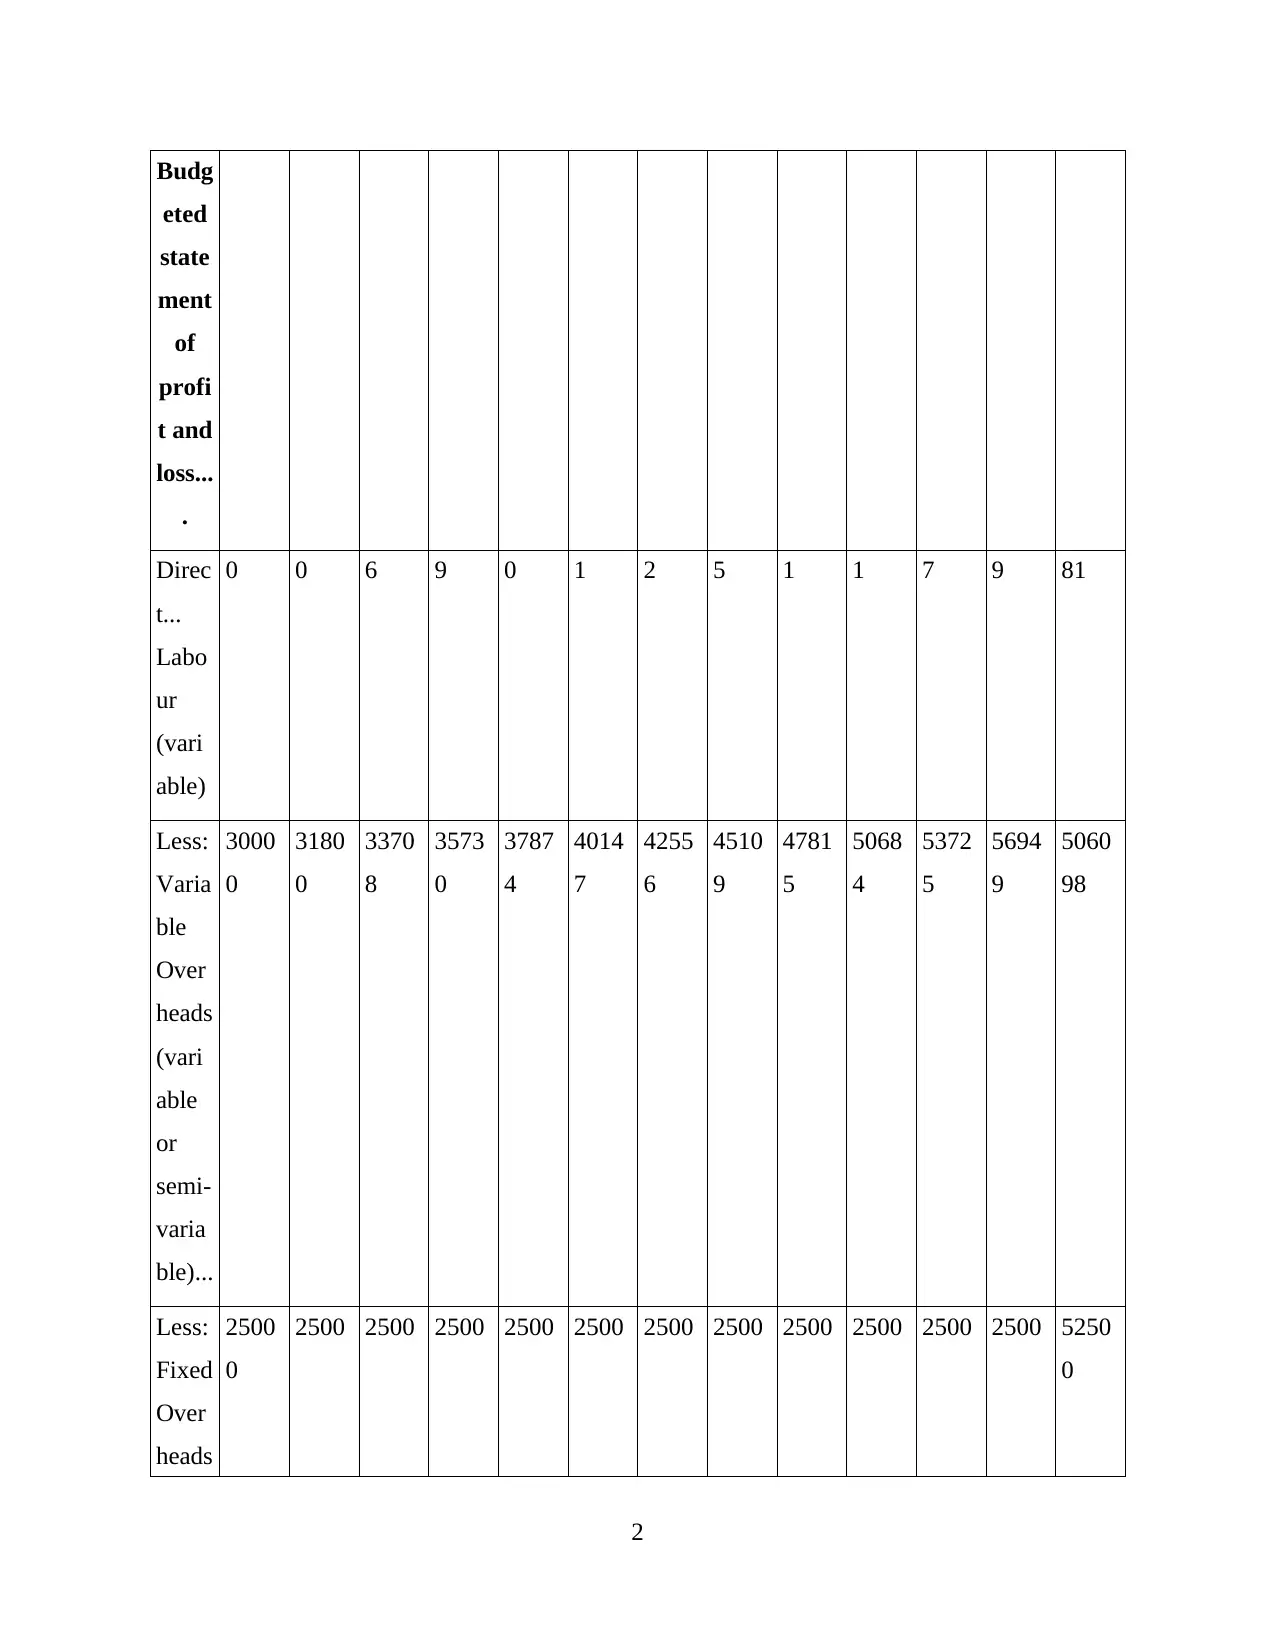
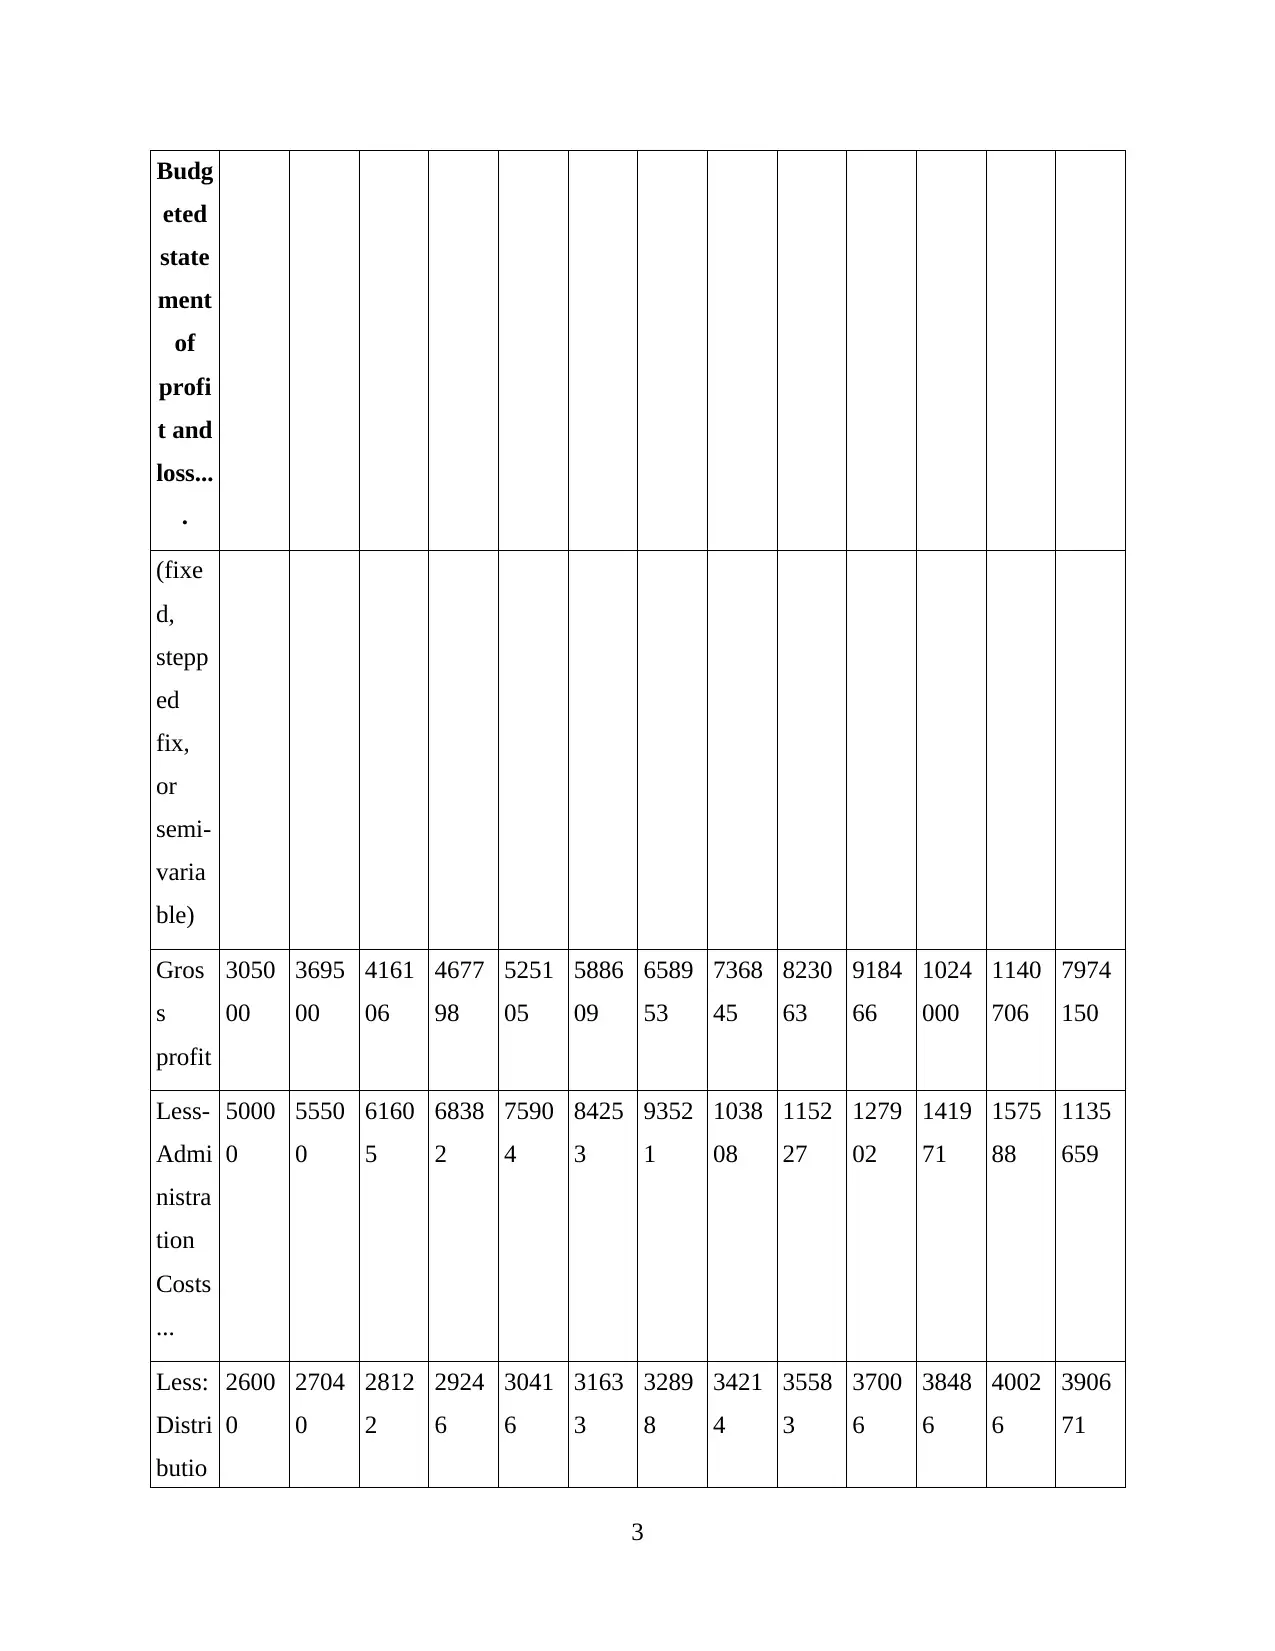
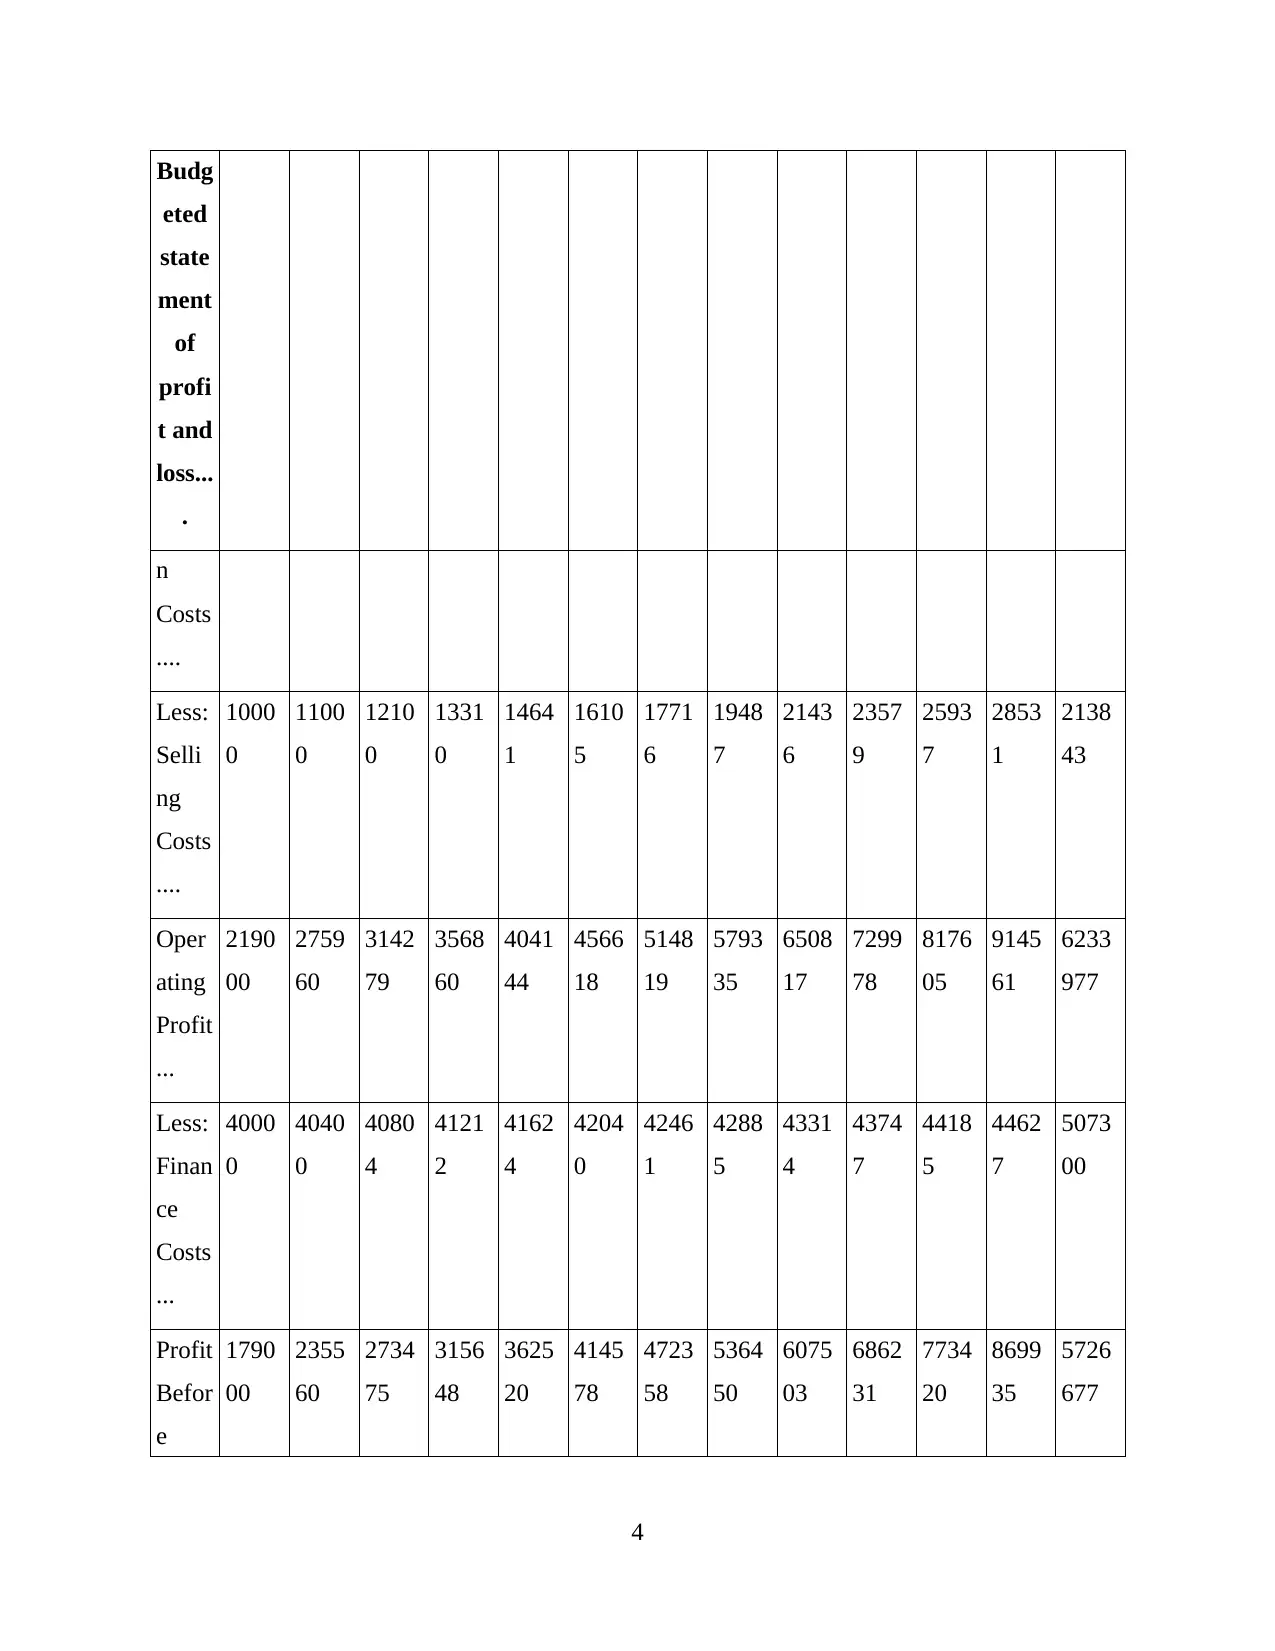
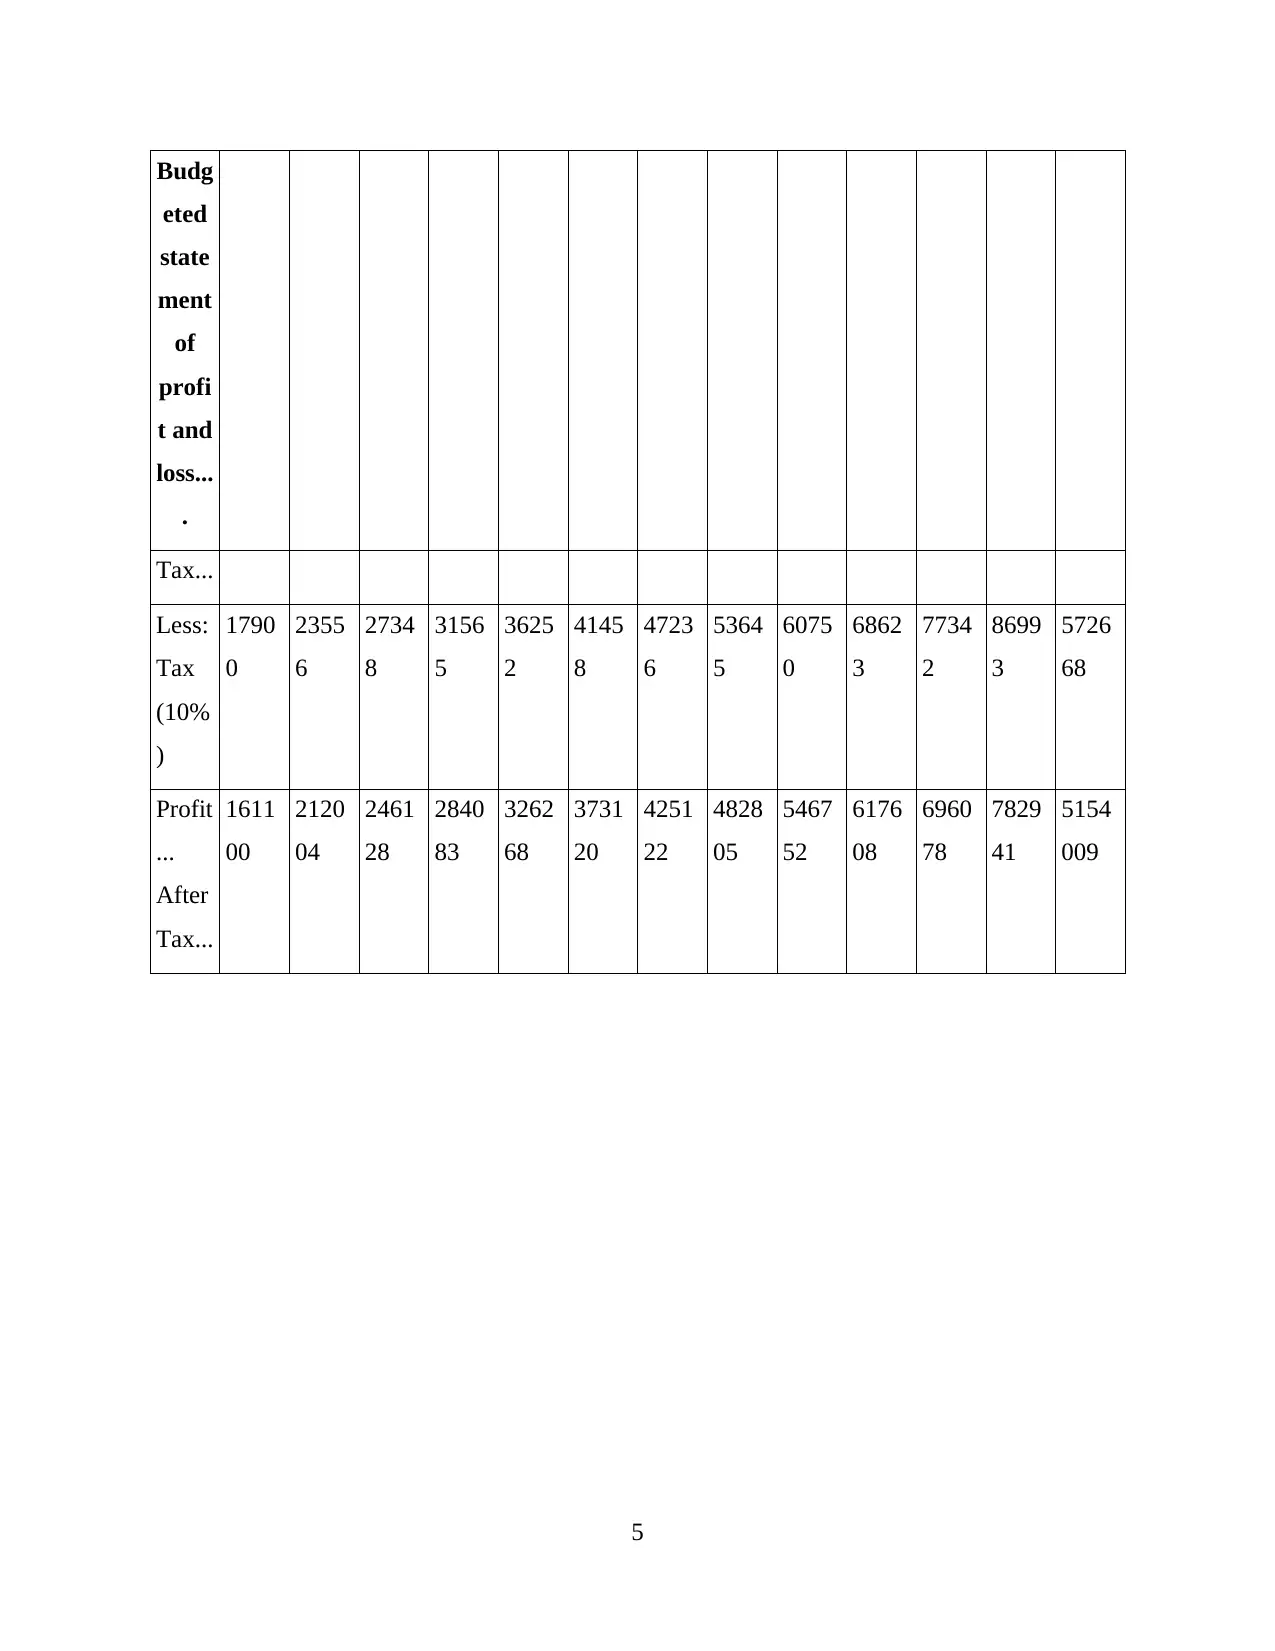
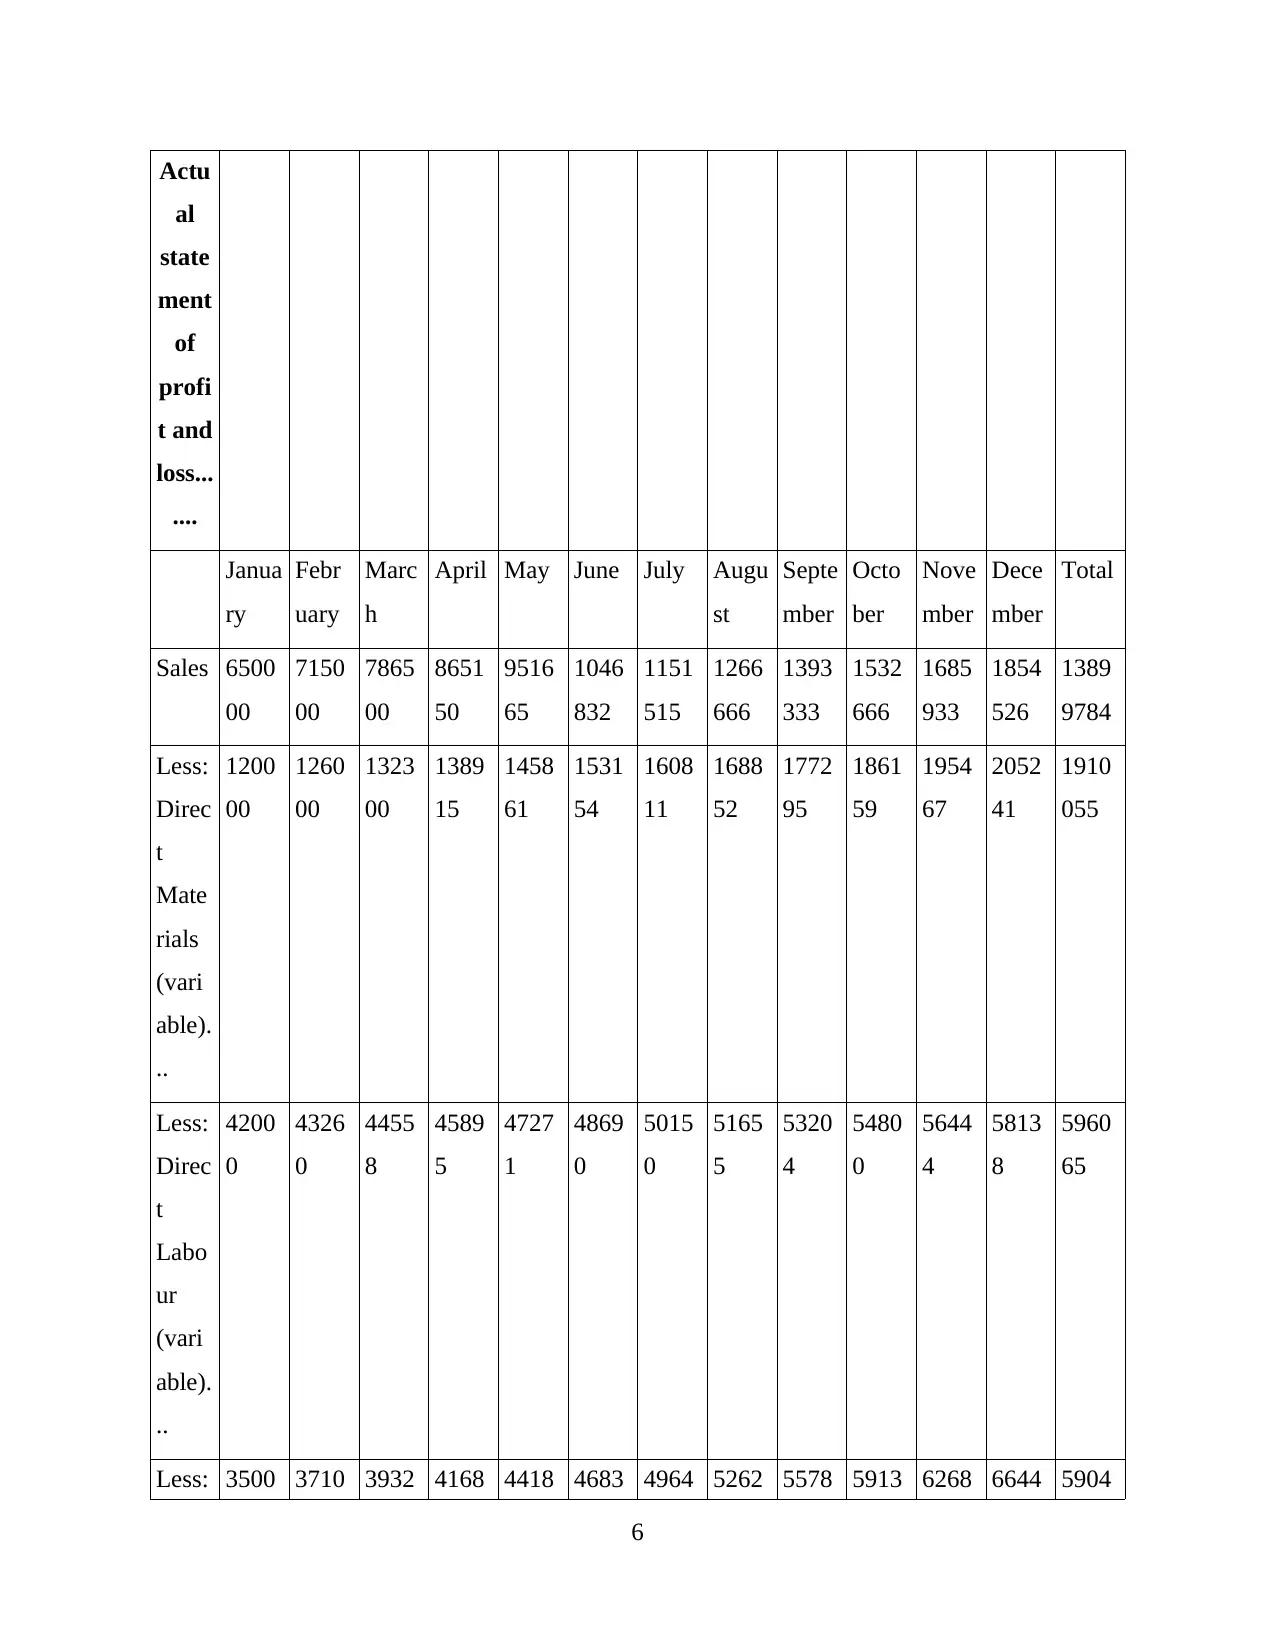
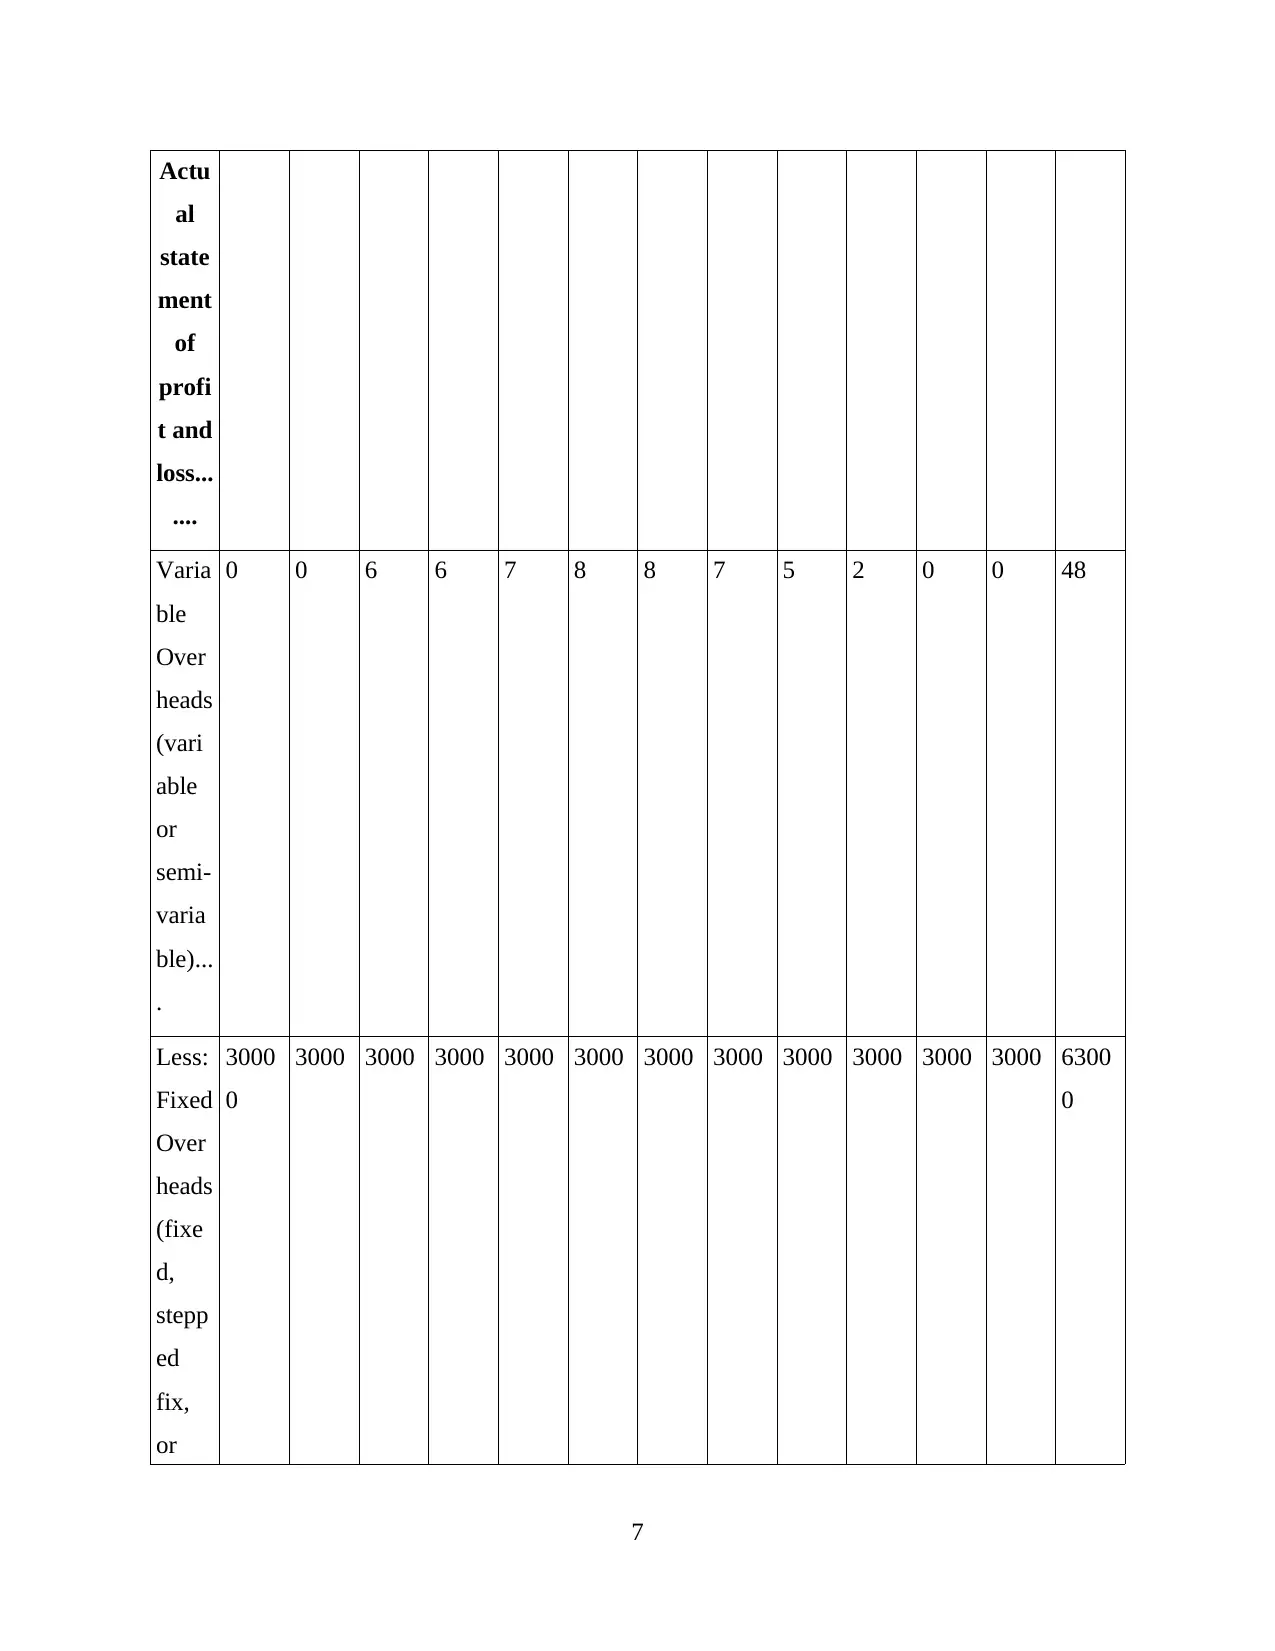
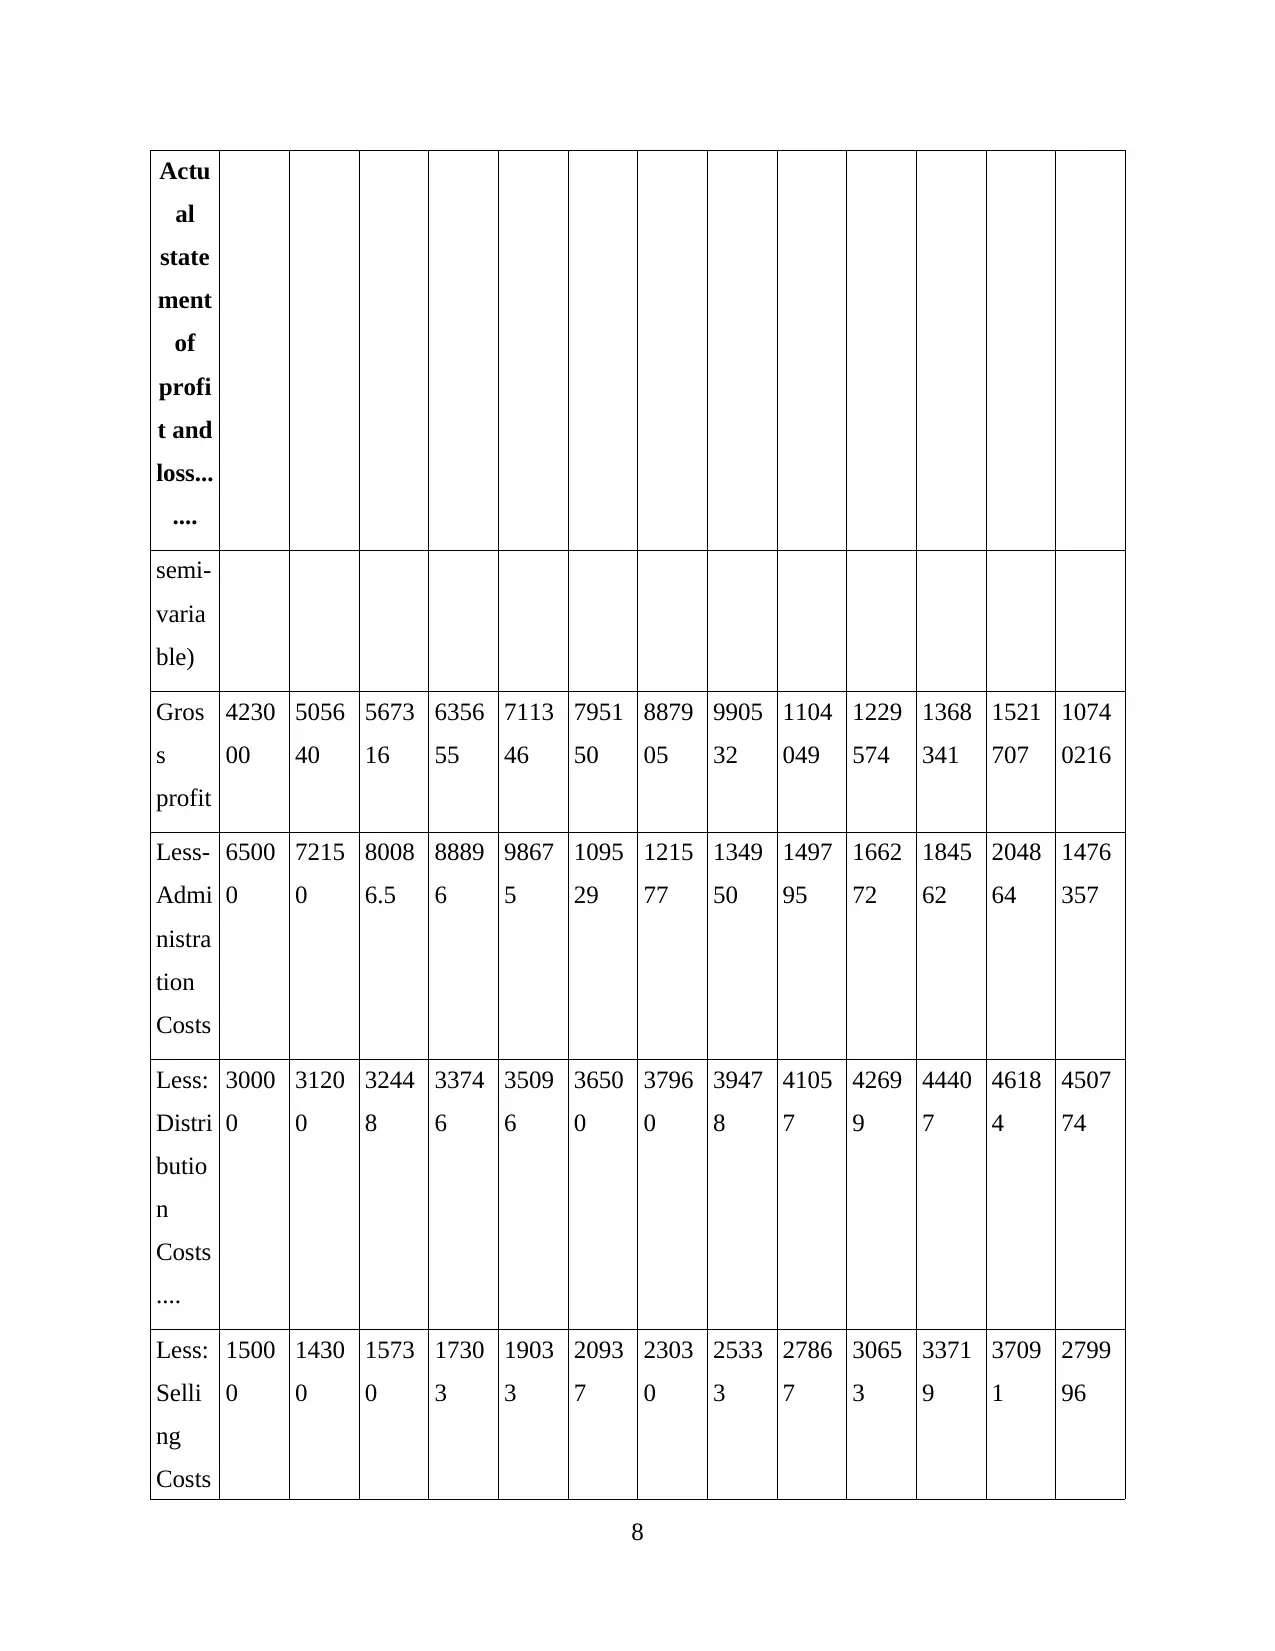
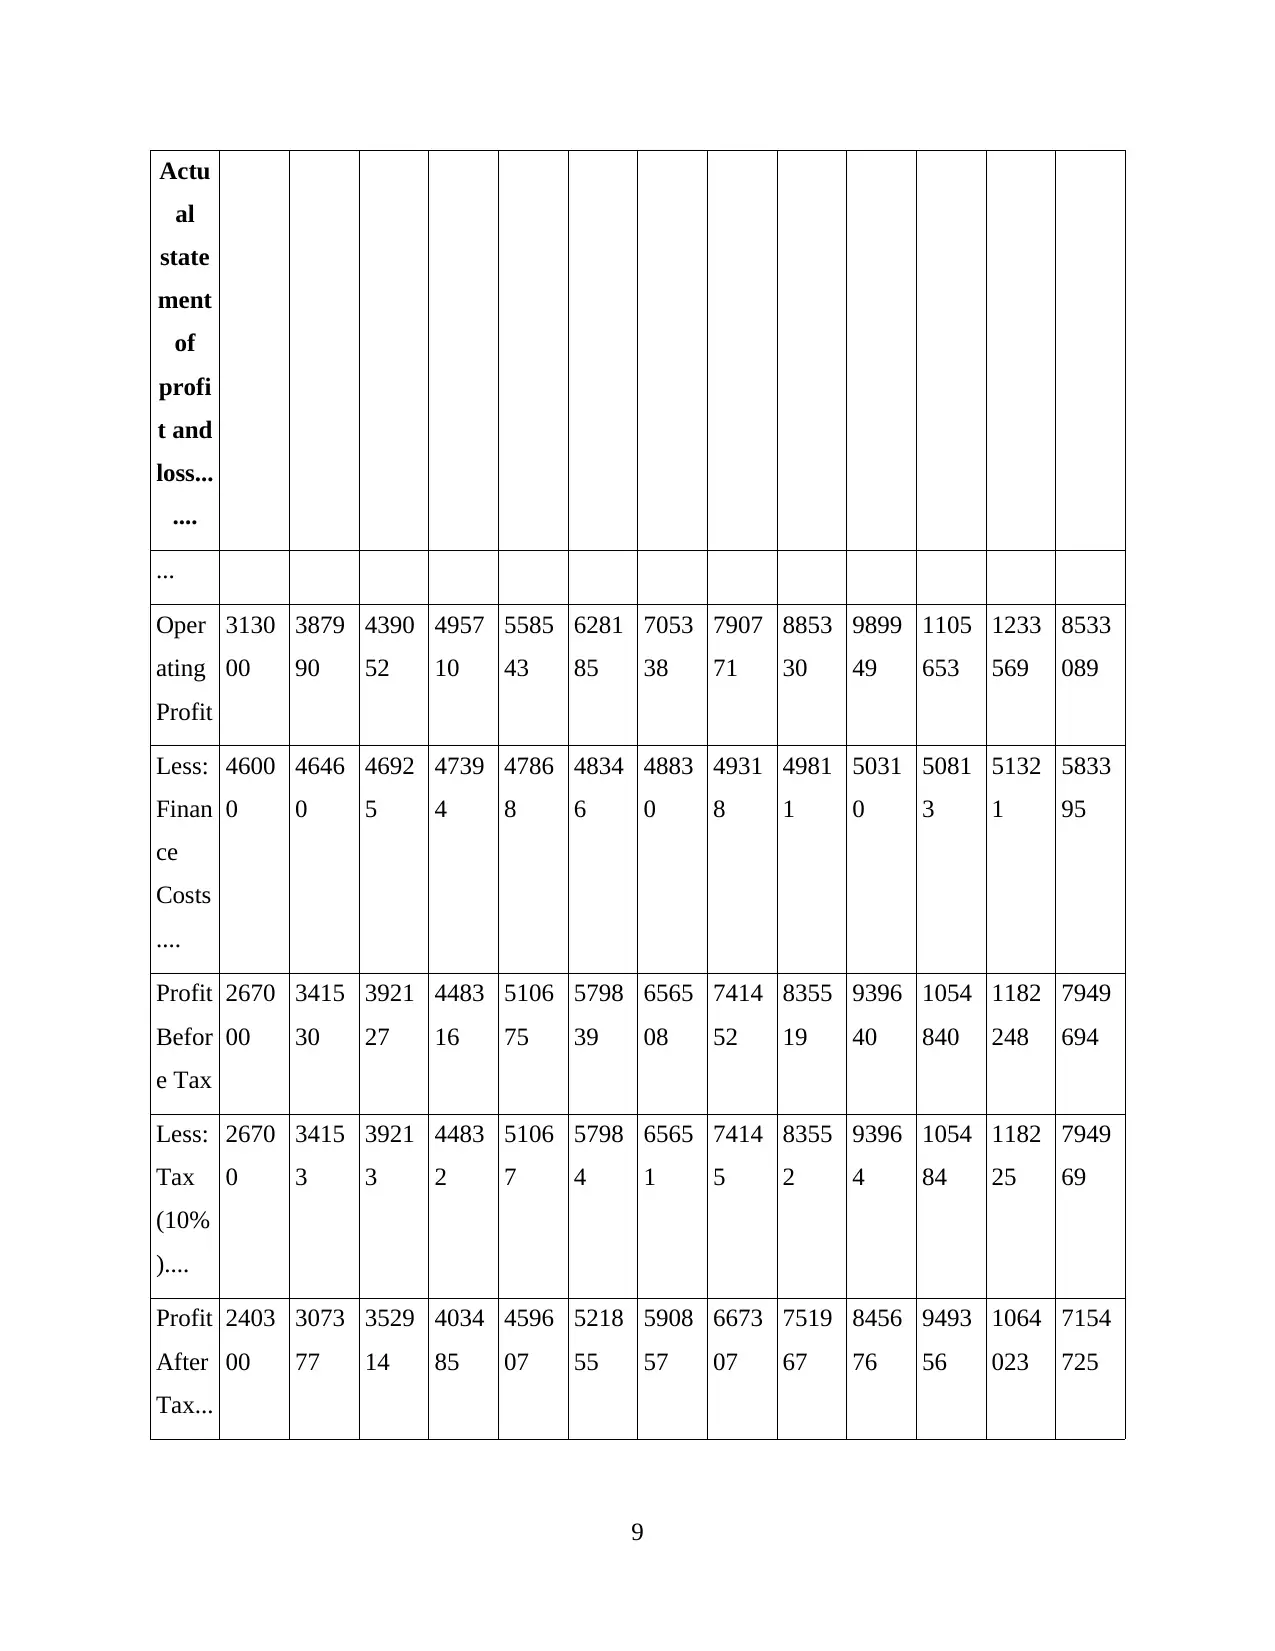
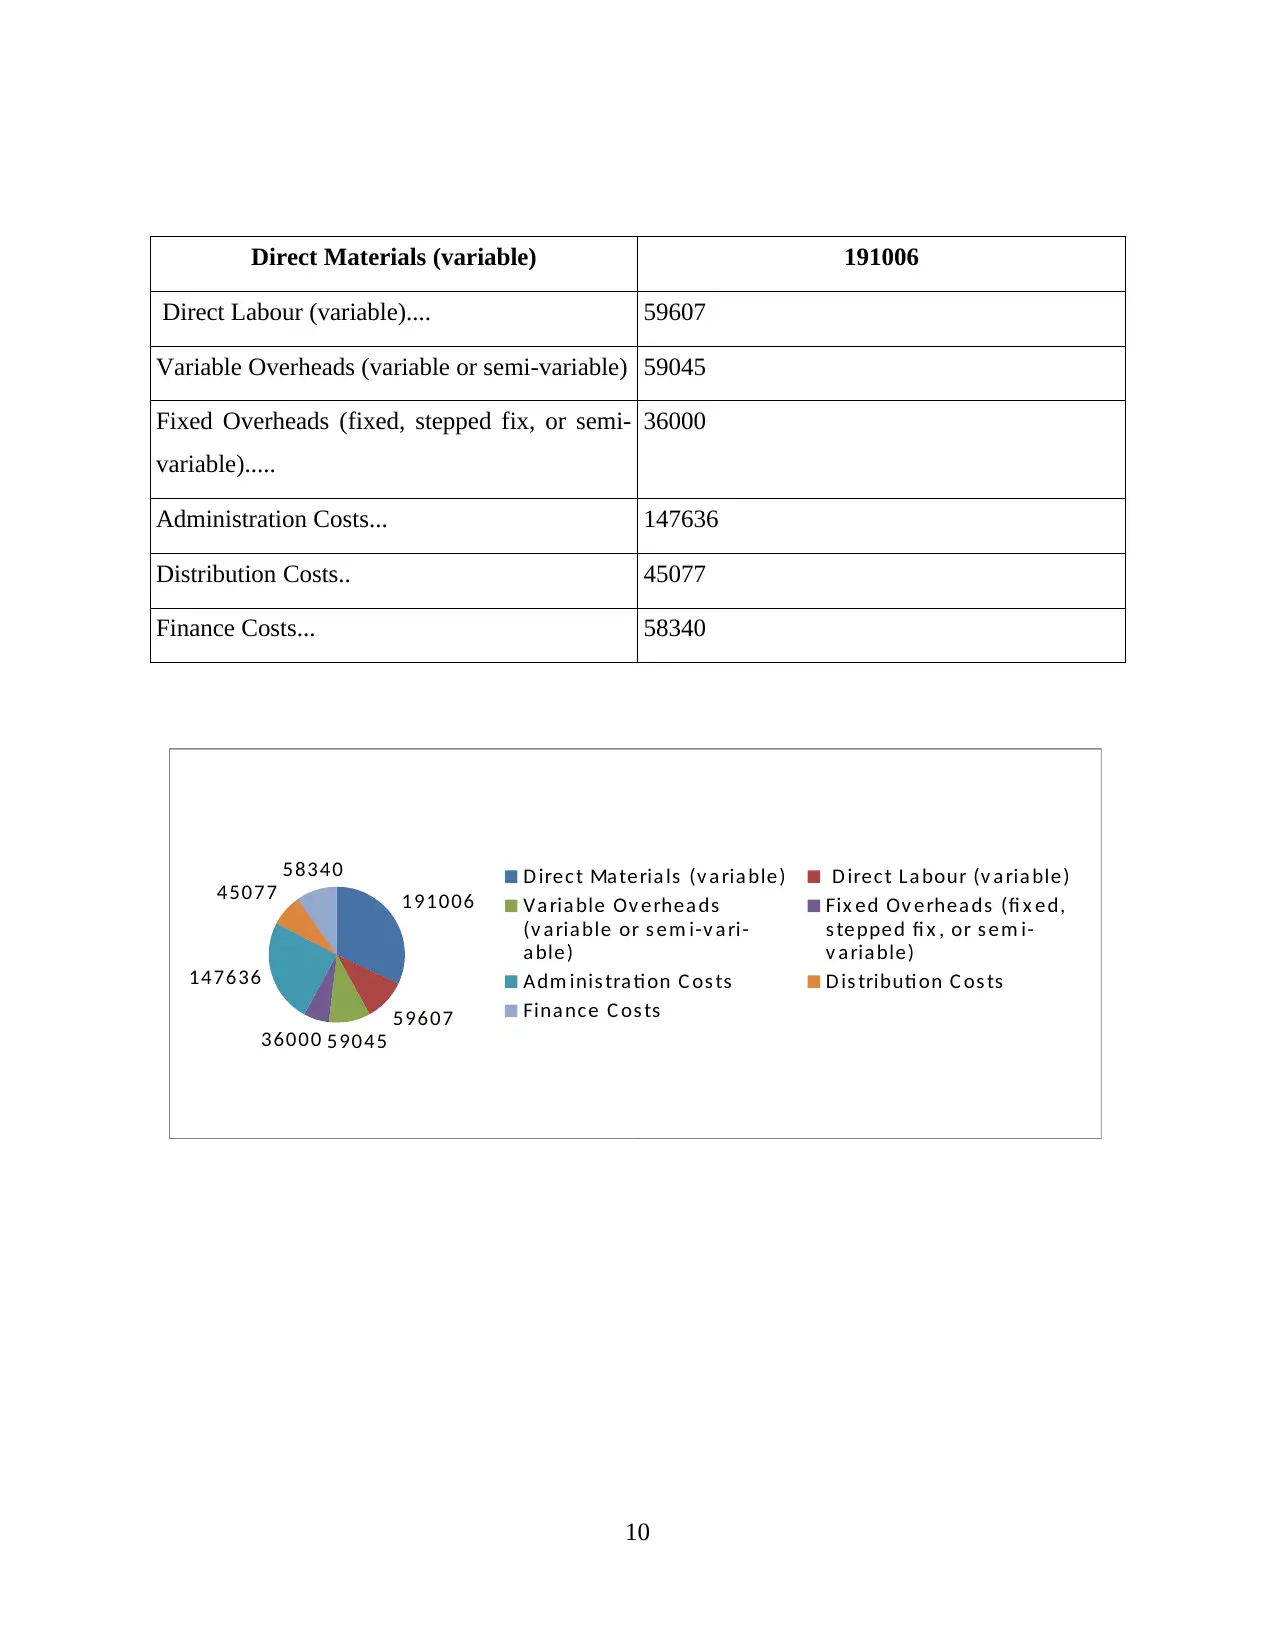
This report presents a comprehensive business planning document, including a detailed preparation of a Budgeted Profit & Loss Account, Balance Sheet, and Ratio Analysis. The analysis covers various financial aspects, such as sales, direct materials, direct labor, variable overheads, fixed overheads, administrative costs, distribution costs, selling costs, and finance costs. The report compares budgeted and actual financial statements to identify variances and assess performance. It also includes a comparison of budgeted and actual sales, direct material costs, direct labor costs, variable overhead costs, and fixed overhead costs. The report further provides a comparison of budgeted and actual operating costs and profit, along with a budgeted balance sheet. This report helps in effective financial assessment, setting financial goals, and improving the company's financial situation.
Contribute Materials
Your contribution can guide someone’s learning journey. Share your
documents today.

Business Planning
Secure Best Marks with AI Grader
Need help grading? Try our AI Grader for instant feedback on your assignments.


Report Summary
In this report, there has been a detailed preparation of a Budgeted Profit & Loss Account,
Balance Sheet and Ratio Analysis. Thus in this way the overall financial situation of the
company can be identified in a highly effective manner. Therefore this will be quite helpful in
ensuring that the financial situation of the company can be assessed in the right manner which
will be quite helpful in making sure that the financial goals and objectives can be attained
without facing problems and issues. This will be helpful in the assessment of the future steps
which can be taken to improve the financial situation.
Budg
eted
state
ment
of
profi
t and
loss...
.
Janua
ry
Febr
uary
Marc
h
April May June July Augu
st
Septe
mber
Octo
ber
Nove
mber
Dece
mber
Total
Sales 5000
00
5500
00
6050
00
6655
00
7320
50
8052
55
8857
81
9743
59
1071
794
1178
974
1296
871
1426
558
1069
2142
Less:
Direc
t
Mate
rials
(vari
able)
1000
00
1050
00
1102
50
1157
63
1215
51
1276
28
1340
10
1407
10
1477
46
1551
33
1628
89
1710
34
1591
713
Less: 4000 4120 4243 4370 4502 4637 4776 4919 5067 5219 5375 5536 5676
1

Budg
eted
state
ment
of
profi
t and
loss...
.
Direc
t...
Labo
ur
(vari
able)
0 0 6 9 0 1 2 5 1 1 7 9 81
Less:
Varia
ble
Over
heads
(vari
able
or
semi-
varia
ble)...
3000
0
3180
0
3370
8
3573
0
3787
4
4014
7
4255
6
4510
9
4781
5
5068
4
5372
5
5694
9
5060
98
Less:
Fixed
Over
heads
2500
0
2500 2500 2500 2500 2500 2500 2500 2500 2500 2500 2500 5250
0
2
Secure Best Marks with AI Grader
Need help grading? Try our AI Grader for instant feedback on your assignments.

Budg
eted
state
ment
of
profi
t and
loss...
.
(fixe
d,
stepp
ed
fix,
or
semi-
varia
ble)
Gros
s
profit
3050
00
3695
00
4161
06
4677
98
5251
05
5886
09
6589
53
7368
45
8230
63
9184
66
1024
000
1140
706
7974
150
Less-
Admi
nistra
tion
Costs
...
5000
0
5550
0
6160
5
6838
2
7590
4
8425
3
9352
1
1038
08
1152
27
1279
02
1419
71
1575
88
1135
659
Less:
Distri
butio
2600
0
2704
0
2812
2
2924
6
3041
6
3163
3
3289
8
3421
4
3558
3
3700
6
3848
6
4002
6
3906
71
3

Budg
eted
state
ment
of
profi
t and
loss...
.
n
Costs
....
Less:
Selli
ng
Costs
....
1000
0
1100
0
1210
0
1331
0
1464
1
1610
5
1771
6
1948
7
2143
6
2357
9
2593
7
2853
1
2138
43
Oper
ating
Profit
...
2190
00
2759
60
3142
79
3568
60
4041
44
4566
18
5148
19
5793
35
6508
17
7299
78
8176
05
9145
61
6233
977
Less:
Finan
ce
Costs
...
4000
0
4040
0
4080
4
4121
2
4162
4
4204
0
4246
1
4288
5
4331
4
4374
7
4418
5
4462
7
5073
00
Profit
Befor
e
1790
00
2355
60
2734
75
3156
48
3625
20
4145
78
4723
58
5364
50
6075
03
6862
31
7734
20
8699
35
5726
677
4

Budg
eted
state
ment
of
profi
t and
loss...
.
Tax...
Less:
Tax
(10%
)
1790
0
2355
6
2734
8
3156
5
3625
2
4145
8
4723
6
5364
5
6075
0
6862
3
7734
2
8699
3
5726
68
Profit
...
After
Tax...
1611
00
2120
04
2461
28
2840
83
3262
68
3731
20
4251
22
4828
05
5467
52
6176
08
6960
78
7829
41
5154
009
5
eted
state
ment
of
profi
t and
loss...
.
Tax...
Less:
Tax
(10%
)
1790
0
2355
6
2734
8
3156
5
3625
2
4145
8
4723
6
5364
5
6075
0
6862
3
7734
2
8699
3
5726
68
Profit
...
After
Tax...
1611
00
2120
04
2461
28
2840
83
3262
68
3731
20
4251
22
4828
05
5467
52
6176
08
6960
78
7829
41
5154
009
5
Paraphrase This Document
Need a fresh take? Get an instant paraphrase of this document with our AI Paraphraser

Actu
al
state
ment
of
profi
t and
loss...
....
Janua
ry
Febr
uary
Marc
h
April May June July Augu
st
Septe
mber
Octo
ber
Nove
mber
Dece
mber
Total
Sales 6500
00
7150
00
7865
00
8651
50
9516
65
1046
832
1151
515
1266
666
1393
333
1532
666
1685
933
1854
526
1389
9784
Less:
Direc
t
Mate
rials
(vari
able).
..
1200
00
1260
00
1323
00
1389
15
1458
61
1531
54
1608
11
1688
52
1772
95
1861
59
1954
67
2052
41
1910
055
Less:
Direc
t
Labo
ur
(vari
able).
..
4200
0
4326
0
4455
8
4589
5
4727
1
4869
0
5015
0
5165
5
5320
4
5480
0
5644
4
5813
8
5960
65
Less: 3500 3710 3932 4168 4418 4683 4964 5262 5578 5913 6268 6644 5904
6

Actu
al
state
ment
of
profi
t and
loss...
....
Varia
ble
Over
heads
(vari
able
or
semi-
varia
ble)...
.
0 0 6 6 7 8 8 7 5 2 0 0 48
Less:
Fixed
Over
heads
(fixe
d,
stepp
ed
fix,
or
3000
0
3000 3000 3000 3000 3000 3000 3000 3000 3000 3000 3000 6300
0
7
al
state
ment
of
profi
t and
loss...
....
Varia
ble
Over
heads
(vari
able
or
semi-
varia
ble)...
.
0 0 6 6 7 8 8 7 5 2 0 0 48
Less:
Fixed
Over
heads
(fixe
d,
stepp
ed
fix,
or
3000
0
3000 3000 3000 3000 3000 3000 3000 3000 3000 3000 3000 6300
0
7

Actu
al
state
ment
of
profi
t and
loss...
....
semi-
varia
ble)
Gros
s
profit
4230
00
5056
40
5673
16
6356
55
7113
46
7951
50
8879
05
9905
32
1104
049
1229
574
1368
341
1521
707
1074
0216
Less-
Admi
nistra
tion
Costs
6500
0
7215
0
8008
6.5
8889
6
9867
5
1095
29
1215
77
1349
50
1497
95
1662
72
1845
62
2048
64
1476
357
Less:
Distri
butio
n
Costs
....
3000
0
3120
0
3244
8
3374
6
3509
6
3650
0
3796
0
3947
8
4105
7
4269
9
4440
7
4618
4
4507
74
Less:
Selli
ng
Costs
1500
0
1430
0
1573
0
1730
3
1903
3
2093
7
2303
0
2533
3
2786
7
3065
3
3371
9
3709
1
2799
96
8
Secure Best Marks with AI Grader
Need help grading? Try our AI Grader for instant feedback on your assignments.

Actu
al
state
ment
of
profi
t and
loss...
....
...
Oper
ating
Profit
3130
00
3879
90
4390
52
4957
10
5585
43
6281
85
7053
38
7907
71
8853
30
9899
49
1105
653
1233
569
8533
089
Less:
Finan
ce
Costs
....
4600
0
4646
0
4692
5
4739
4
4786
8
4834
6
4883
0
4931
8
4981
1
5031
0
5081
3
5132
1
5833
95
Profit
Befor
e Tax
2670
00
3415
30
3921
27
4483
16
5106
75
5798
39
6565
08
7414
52
8355
19
9396
40
1054
840
1182
248
7949
694
Less:
Tax
(10%
)....
2670
0
3415
3
3921
3
4483
2
5106
7
5798
4
6565
1
7414
5
8355
2
9396
4
1054
84
1182
25
7949
69
Profit
After
Tax...
2403
00
3073
77
3529
14
4034
85
4596
07
5218
55
5908
57
6673
07
7519
67
8456
76
9493
56
1064
023
7154
725
9

Direct Materials (variable) 191006
Direct Labour (variable).... 59607
Variable Overheads (variable or semi-variable) 59045
Fixed Overheads (fixed, stepped fix, or semi-
variable).....
36000
Administration Costs... 147636
Distribution Costs.. 45077
Finance Costs... 58340
191006
59607
5904536000
147636
45077
58340 D irec t Ma teria ls (v a ria ble) D irec t La bour (v a ria ble)
Va ria ble Ov erhea ds
(v a ria ble or s em i-v a ri-
a ble)
Fix ed Ov erhea ds (fi x ed,
s tepped fi x , or s em i-
v a ria ble)
Adm inis tra ti on C os ts D is tributi on C os ts
Fina nce C os ts
10

Com
paris
on of
budg
eted
with
actua
l:
Janua
ry
Febru
ary
Marc
h
April May June July Augu
st
Septe
mber
Octob
er
Nove
mber
Dece
mber
Sales
(Poun
ds)
15000
0
16500
0
18150
0
19965
0
21961
5
24157
7
26573
4
29230
8
32153
8
35369
2
38906
1
42796
8
Ja nua ry JulyApril Octobe r
0
50000
100000
150000
200000
250000
300000
350000
400000
450000
150000165000181500199650219615
241576.5
265734.15
292307.57
321538.32
353692.15
389061.37
427967.51
S a le s ( P o u n d s )
S a le s (Pounds )
11
Paraphrase This Document
Need a fresh take? Get an instant paraphrase of this document with our AI Paraphraser

Janu
ary
Febr
uary
Marc
h
April May June July Augu
st
Septe
mber
Octo
ber
Nove
mber
Dece
mber
Gross
profit
(Poun
ds)
11800
0
13614
0
15121
0
16785
7
18624
1
20654
1
22895
2
25368
8
28098
6
31110
9
34434
1
38100
1
Ja nua ry JulyApril October
0
1000 00
2000 00
3000 00
4000 00
5000 00
1180 001361 401512 10.21678 56.971862 41.472065 41.192289 51.542536 87.66
2809 86.43
3111 08.65
3443 41.41
3810 00.76
G r o s s p r o fi t ( P o u n d s )
G ros s profi t (Pounds )
Actu
al
opera
ting
cost
11000
0
11765
0
12826
5
13994
5
15280
4
16696
5
18256
7
19976
2
21871
9
23962
5
26268
8
28813
8
Budg
eted
operat
ing
cost...
86000 93540 10182
7
11093
8
12096
1
13199
1
14413
5
15750
9
17224
6
18848
7
20639
5
22614
5
12

Actu
al
opera
ting
cost
11000
0
11765
0
12826
5
13994
5
15280
4
16696
5
18256
7
19976
2
21871
9
23962
5
26268
8
28813
8
Opera
ting
cost...
.
-
24000
-
24110
-
26437
.9
-
29006
.921
-
31842
.7903
9
-
34974
.0139
361
-
38432
.1773
56399
-
42252
.2807
10424
-
46473
.1091
77384
6
-
51137
.6441
88483
5
-
56293
.5193
11008
6
-
61993
.5257
61639
5
Janua
ry
Febru
ary
Marc
h
April May June July Augu
st
Septe
mber
Octob
er
Nove
mber
Dece
mber
Opera
ting
cost
-
24000
-
24110
-
26437
.9
-
29007
-
31843
-
73406
-
3843.
21773
56399
-
42250
-
46473
-
51138
44188
4835
-
5629.
35193
11009
-
6199.
35257
6164
Ja nua ry April July Octobe r
-60000000000000
-50000000000000
-40000000000000
-30000000000000
-20000000000000
-10000000000000
0 -24000-24110-26437.9-29007-31843-73406-3843.22-42250-46473
-51138441884835
-5629.35-6199.35
O p e r a ti n g c o s t
Ope ra ti ng cos t
13

Janu
ary
Febr
uary
Marc
h
April May June July Augu
st
Septe
mber
Octo
ber
Nove
mber
Dece
mber
Opera
ting
profit
94000 11203
0
12477
2
13885
0
15439
9
17156
7
19051
9
21143
5
23451
3
25997
1
28804
8
31900
7
Ja nua ry JulyApril October
0
50000
100000
150000
200000
250000
300000
350000
94000112030124772.3138850.05154398.68171567.18
190519.36
211435.38
234513.32
259971
288047.89
319007.23
O p e r a ti n g p r o fi t
Opera ti ng profi t
January February March
Actual sales... 650000 715000 786500
Budgeted sales... 500000 550000 605000
Sales variance.. #NAME? 165000 181500
January February March
Actual direct material
cost....
12000 12600 13230
Budgeted direct 10000 10500 11025
14
Secure Best Marks with AI Grader
Need help grading? Try our AI Grader for instant feedback on your assignments.

January February March
material cost...
Direct material
variance...
-2000 -2100 -2205
January February March
Actual direct labor
cost
4200 4326 4456
Budgeted direct labor
cost...
4000 4120 4244
Direct labor variance... -200 -206 -212.18
January February March
Actual variable
overhead cost...
3500 3710 3933
Budgeted variable
overhead cost...
3000 3180 3371
variable overhead cost
variance....
-500 -530 -561.8
January February March
Actual variable
overhead cost...
3500 3710 3933
Budgeted variable
overhead cost....
3000 3180 3371
15

January February March
variable overhead cost
variance...
-500 -530 -561.8
January February March
Actual variable
overhead cost...
3500 3710 3933
Budgeted variable
overhead cost...
3000 3180 3371
variable overhead cost
variance....
-500 -530 -561.8
January February March
Actual fixed overhead 3000 3000 3000
Budgeted fixed
overhead ….
2500 2500 2500
fixed overhead
variance...
-500 -500 -500
Budgted balance sheet
Actual Budgeted
ASSETS..
Non-Current Assets...
16
variable overhead cost
variance...
-500 -530 -561.8
January February March
Actual variable
overhead cost...
3500 3710 3933
Budgeted variable
overhead cost...
3000 3180 3371
variable overhead cost
variance....
-500 -530 -561.8
January February March
Actual fixed overhead 3000 3000 3000
Budgeted fixed
overhead ….
2500 2500 2500
fixed overhead
variance...
-500 -500 -500
Budgted balance sheet
Actual Budgeted
ASSETS..
Non-Current Assets...
16

Budgted balance sheet
Property, Plant & Equipment –
Cost...
3,44,000 3,09,400
Property, Plant & Equipment -
Accum Dep..
2,02,000 1,64,922
1,42,000 1,44,478
Current Assets...
Inventory... 4,60,000 4,41,581
Trade Debtors... 4,26,000 3,78,571
Cash On Hand... 2,000 4,000
8,88,000 8,24,152
Total Assets 10,30,000 9,68,630
EQUITY & LIABILITIES
Equity...
Shareholders' Capital... 3,50,000 3,80,000
Non-Current Liabilities....
Bank loan... 4,35,000 3,16,500
7,85,000 4,90,000
Current Liabilities...
Trade Creditors.... 2,45,000 4,78,630
Total equity and Liabilities.... 10,30,000 9,68,630
17
Paraphrase This Document
Need a fresh take? Get an instant paraphrase of this document with our AI Paraphraser

Profitability ratio
Actual Budgeted
Gross profit ratio (Gross
profit/sales*100)....
77.27 74.58
Net profit ratio (Net
profit/sales*100)....
51.47 48.20
Operating profit ratio
(Operating profit/sales*100)....
61.39 58.30
Return on capital employed
(Operating profit/Capital
employed).....
10.87 12.72
Liquidity ratio....
Actual Budgeted
Current ratio (Current
assets/current liabilities)....
3.62 1.72
Quick ratio (Quick
assets/current liabilities)...
1.75 0.80
Actual Budgeted
Total assets turnover ratio (Net
sales/total assets)....
13.49 11.04
Receivable turnover ratio
(Receivables/sales)...
0.03 0.04
18
Actual Budgeted
Gross profit ratio (Gross
profit/sales*100)....
77.27 74.58
Net profit ratio (Net
profit/sales*100)....
51.47 48.20
Operating profit ratio
(Operating profit/sales*100)....
61.39 58.30
Return on capital employed
(Operating profit/Capital
employed).....
10.87 12.72
Liquidity ratio....
Actual Budgeted
Current ratio (Current
assets/current liabilities)....
3.62 1.72
Quick ratio (Quick
assets/current liabilities)...
1.75 0.80
Actual Budgeted
Total assets turnover ratio (Net
sales/total assets)....
13.49 11.04
Receivable turnover ratio
(Receivables/sales)...
0.03 0.04
18

Profitability ratio
Fixed assets turnover ratio
(Net sales/fixed assets)...
97.89 74.01
Risk ratio.
Actual Budgeted
Debt to equity ratio (Total
liabilities/equity).
1.94 2.09
Interest coverage ratio
(EBIT/Interest expense)..
14.63 12.29
19
Fixed assets turnover ratio
(Net sales/fixed assets)...
97.89 74.01
Risk ratio.
Actual Budgeted
Debt to equity ratio (Total
liabilities/equity).
1.94 2.09
Interest coverage ratio
(EBIT/Interest expense)..
14.63 12.29
19
1 out of 21

Your All-in-One AI-Powered Toolkit for Academic Success.
+13062052269
info@desklib.com
Available 24*7 on WhatsApp / Email
Unlock your academic potential
© 2024 | Zucol Services PVT LTD | All rights reserved.