Financial Analysis and Planning for Melbourne Property Purchase

Verified

Added on  2021/05/27

|12
|2059
|33
Report
AI Summary
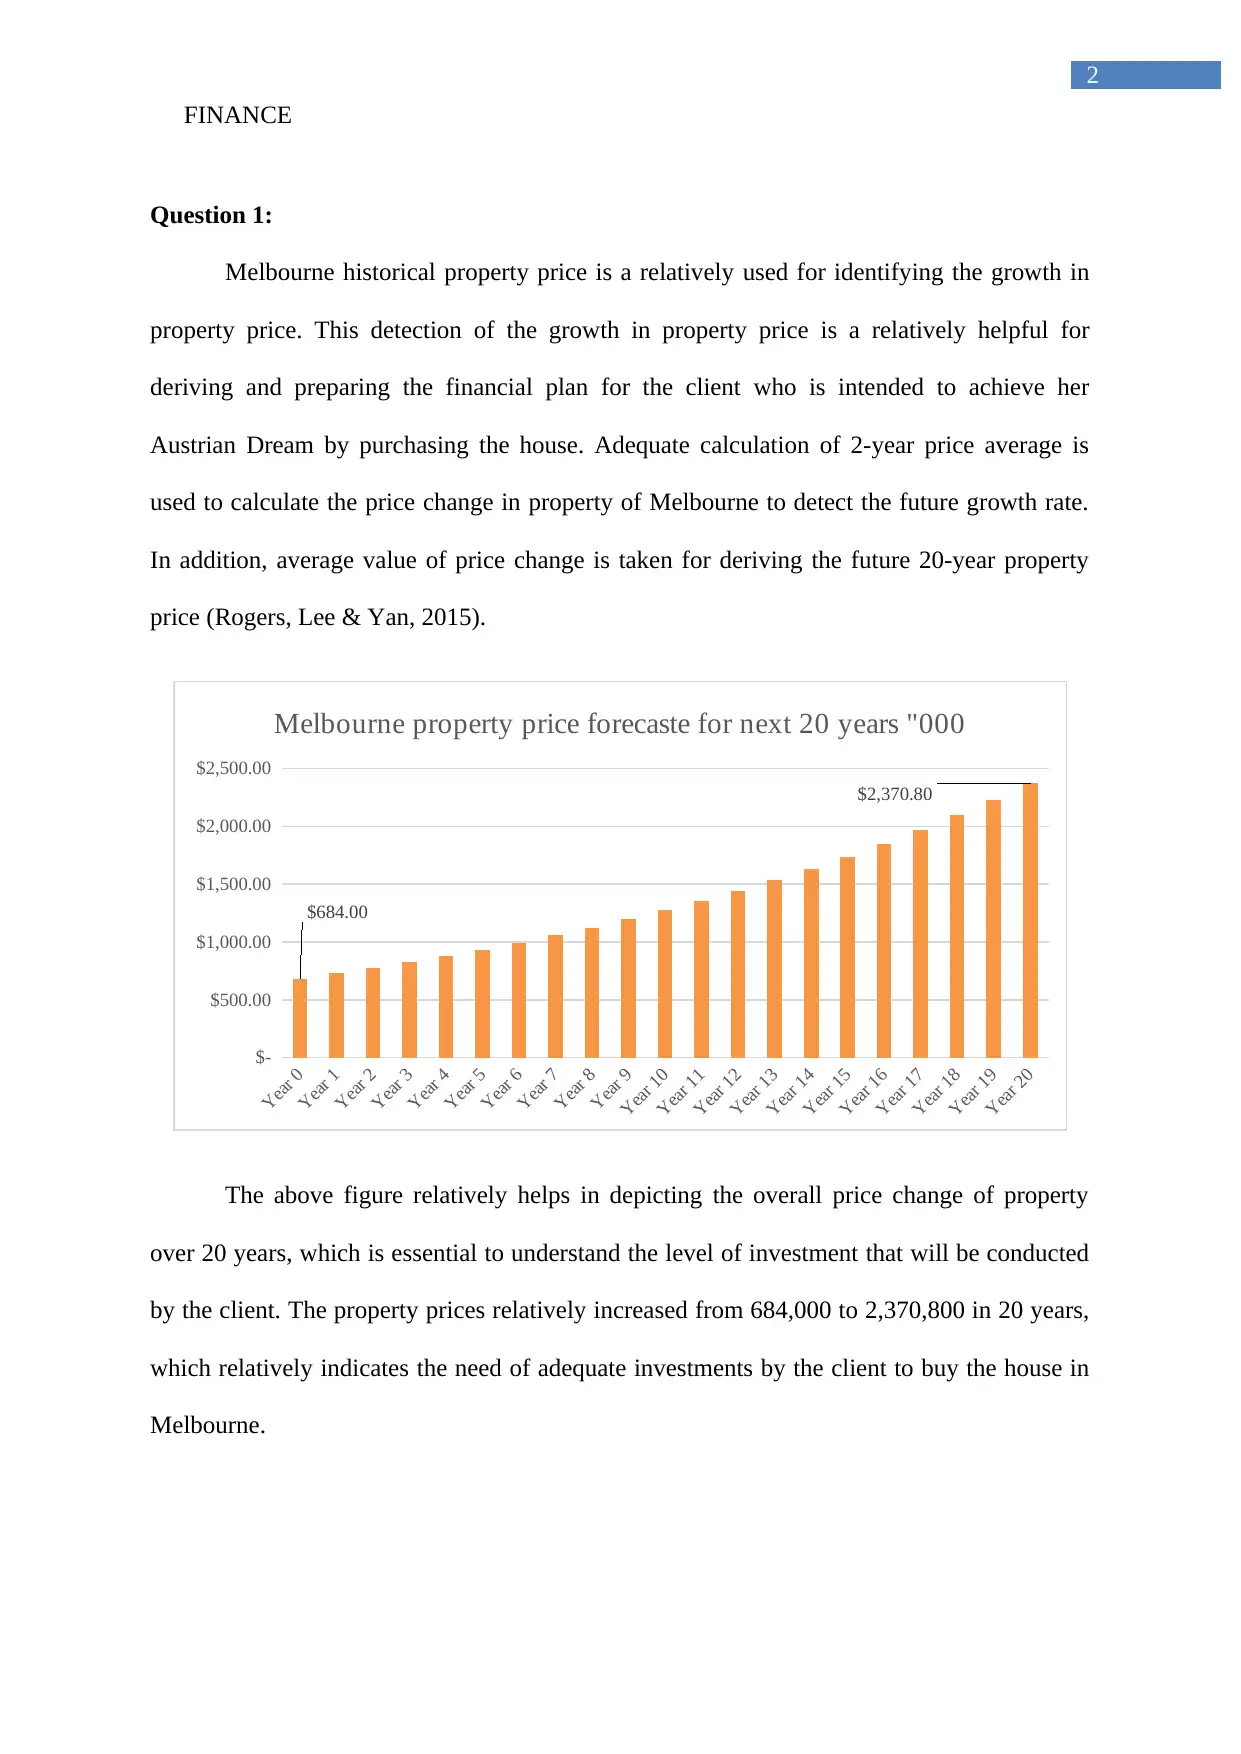
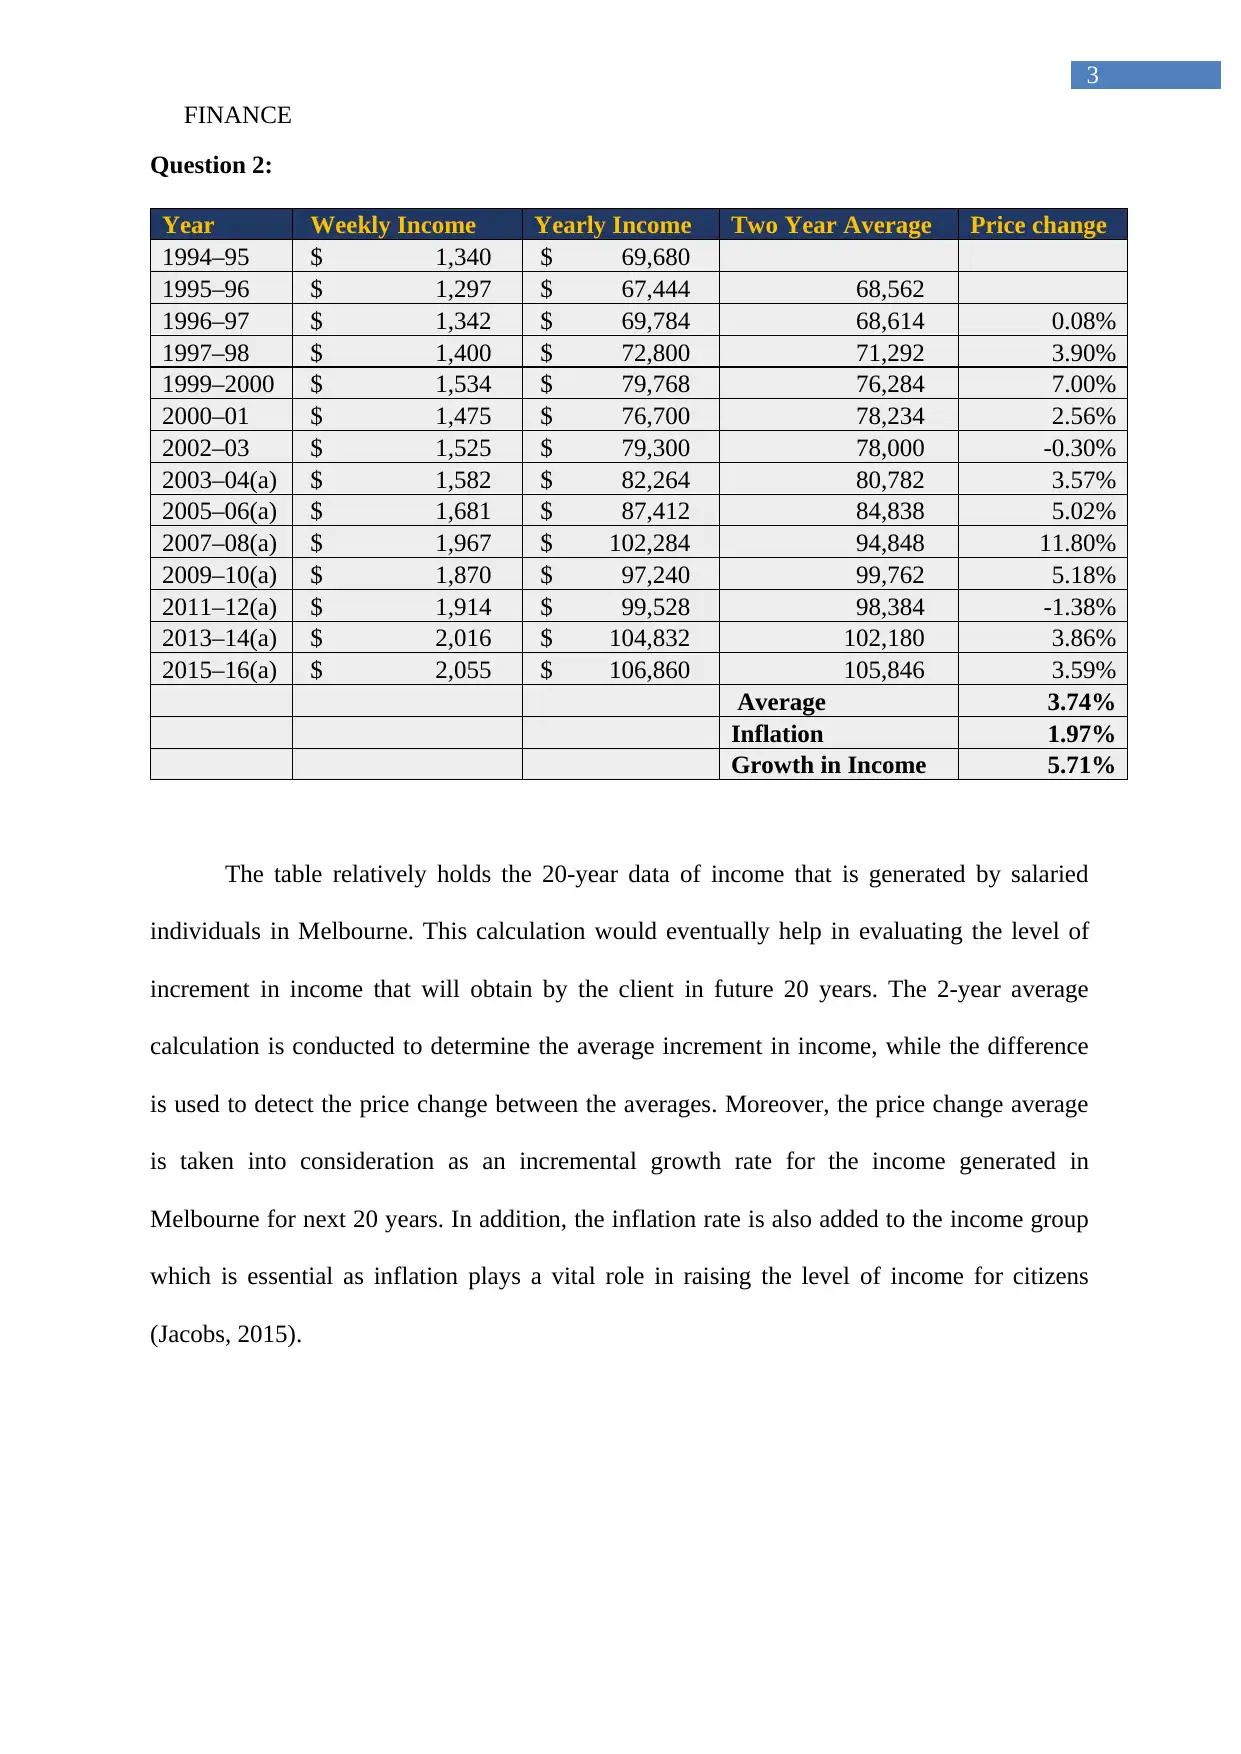
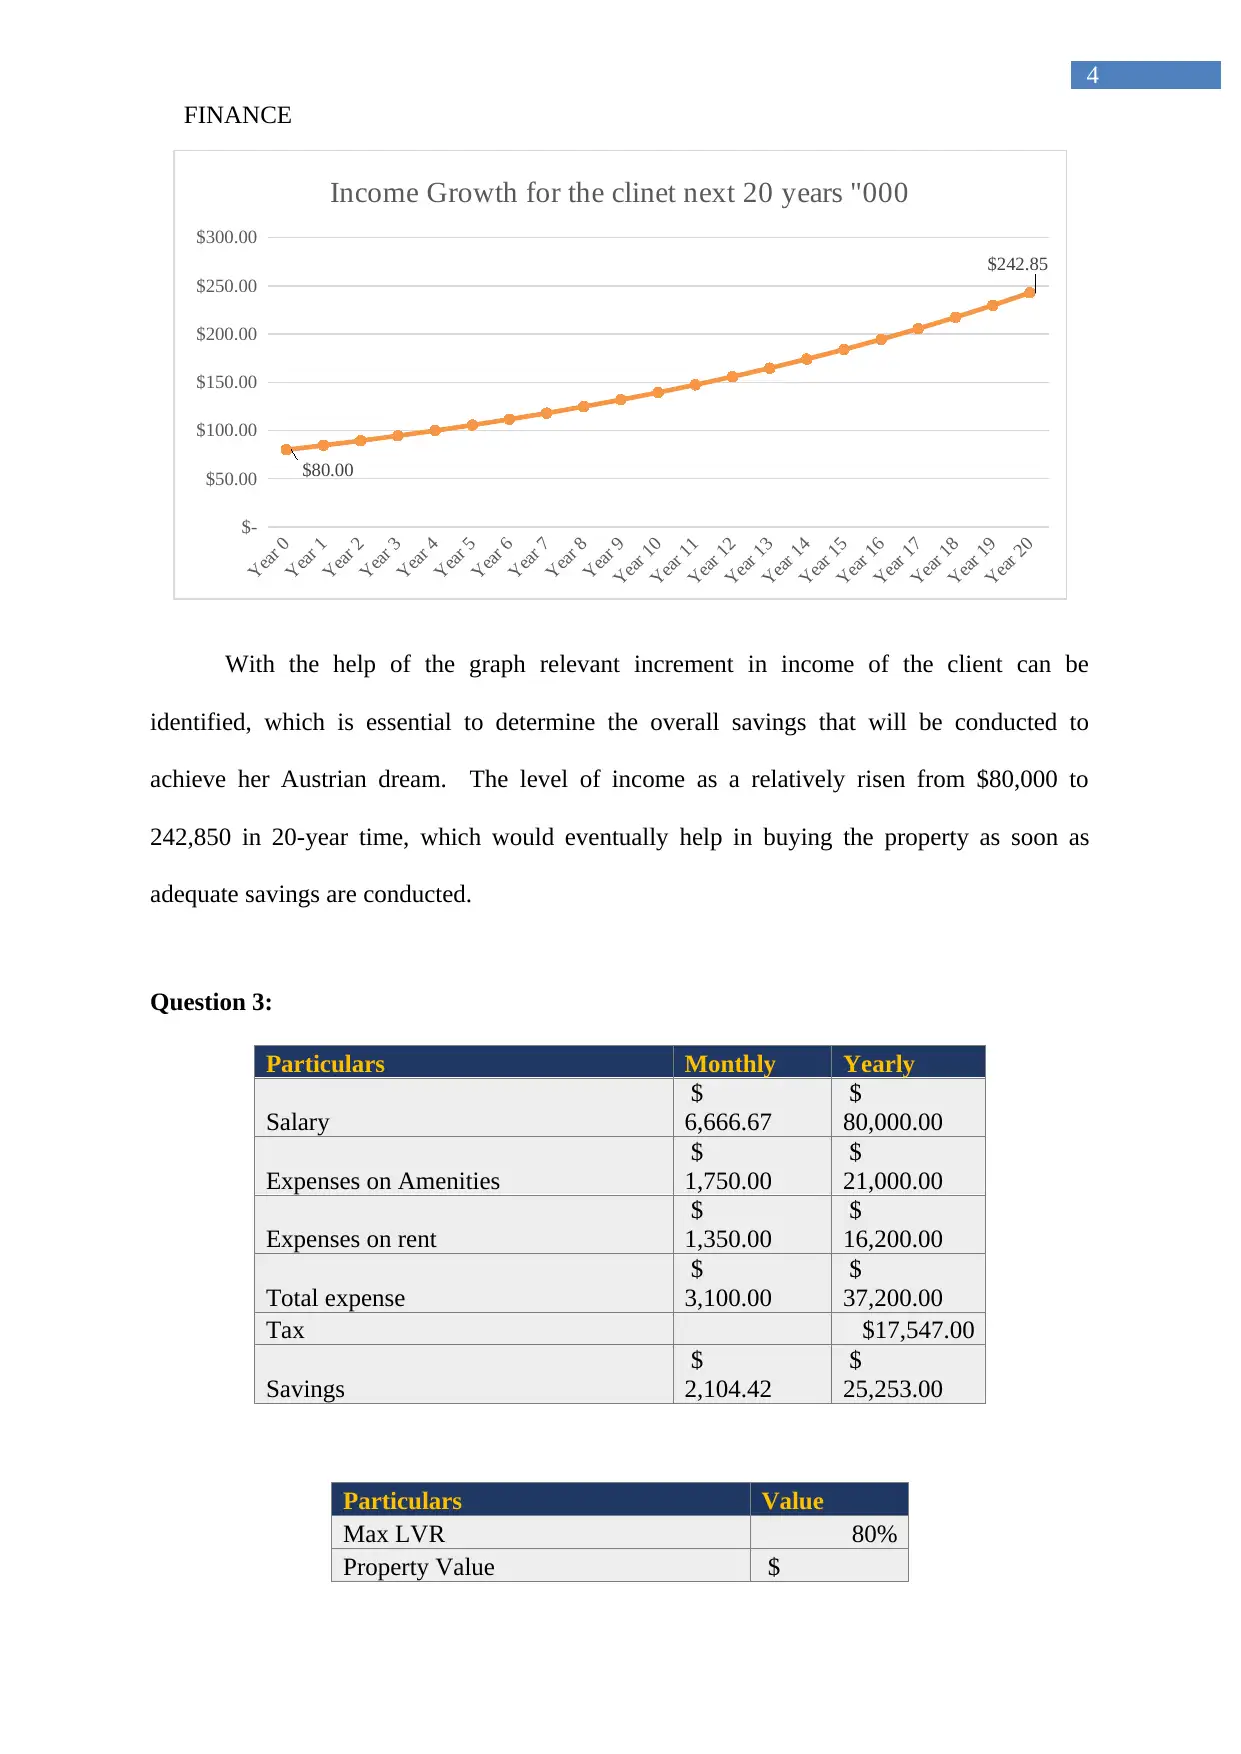
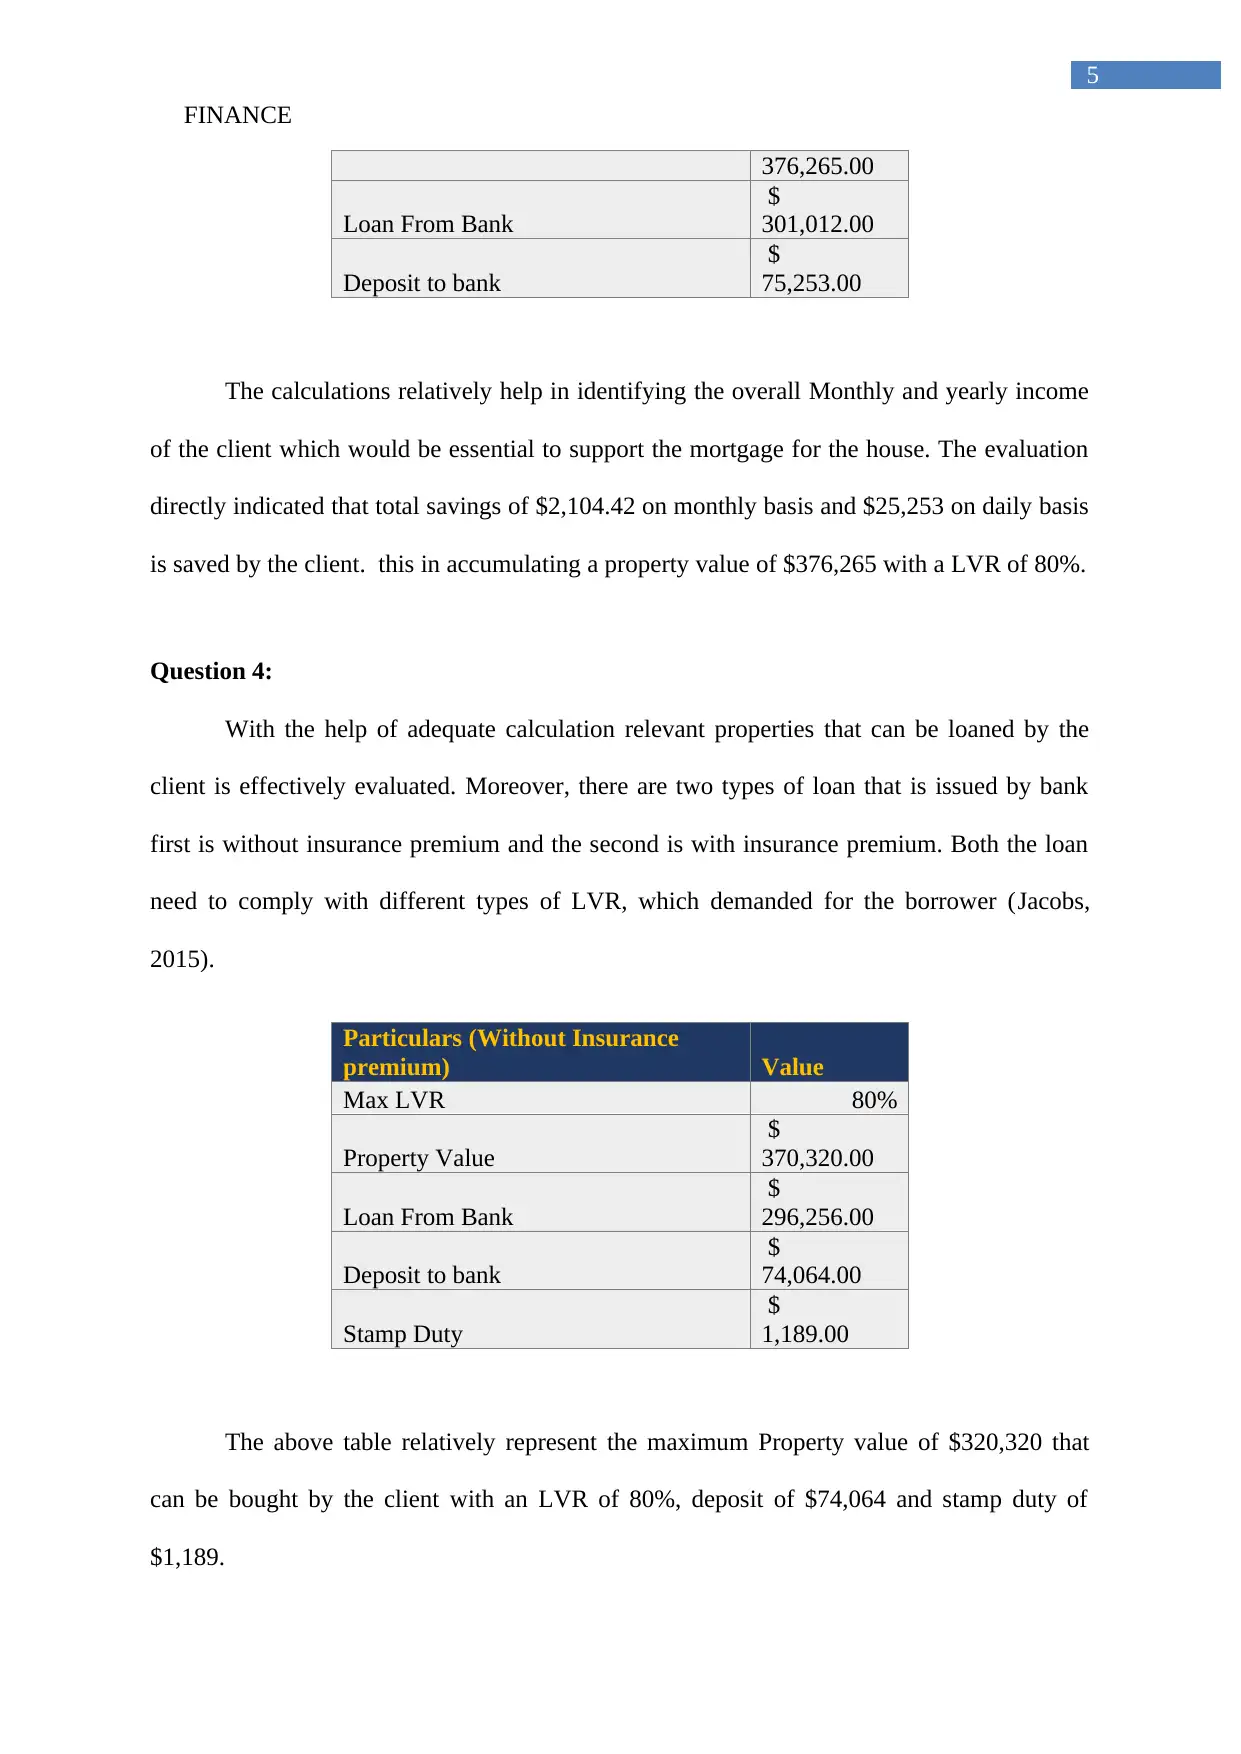
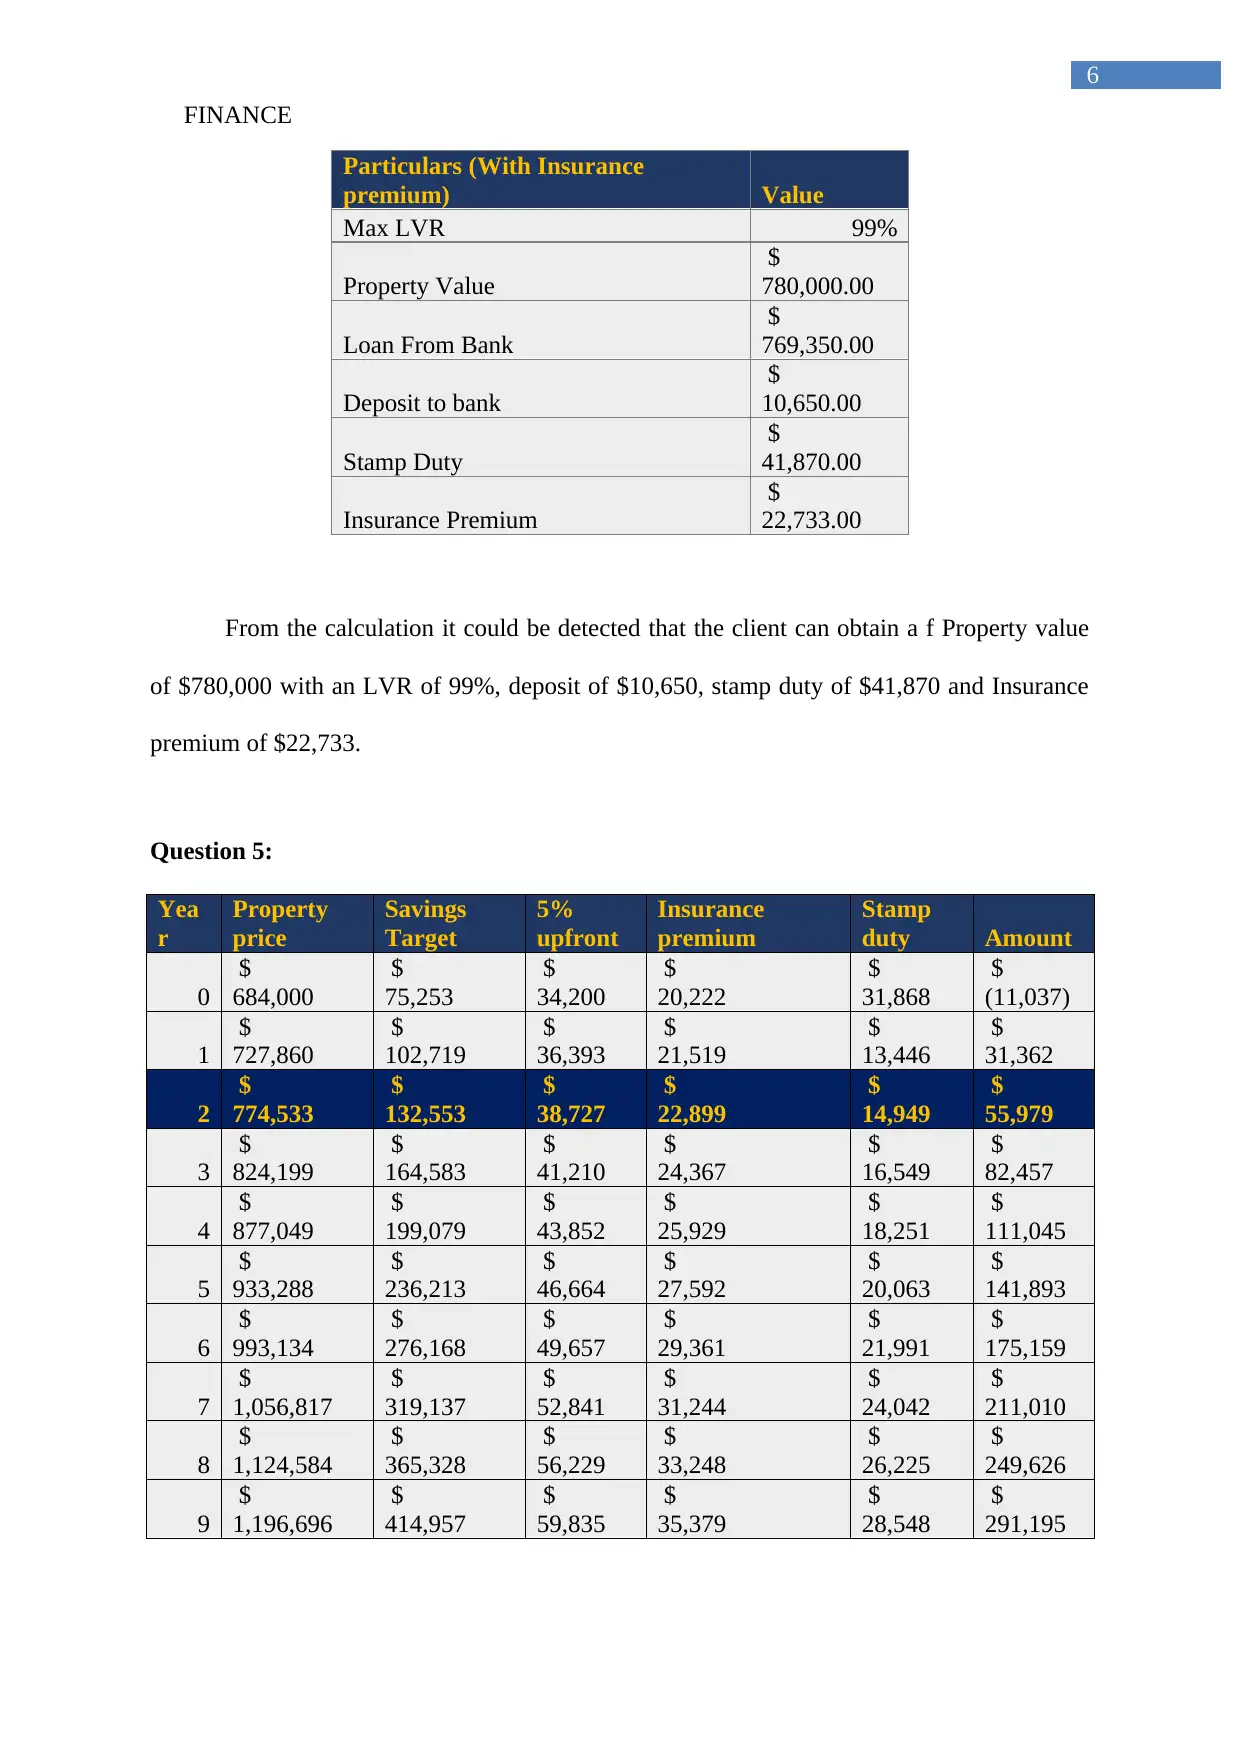
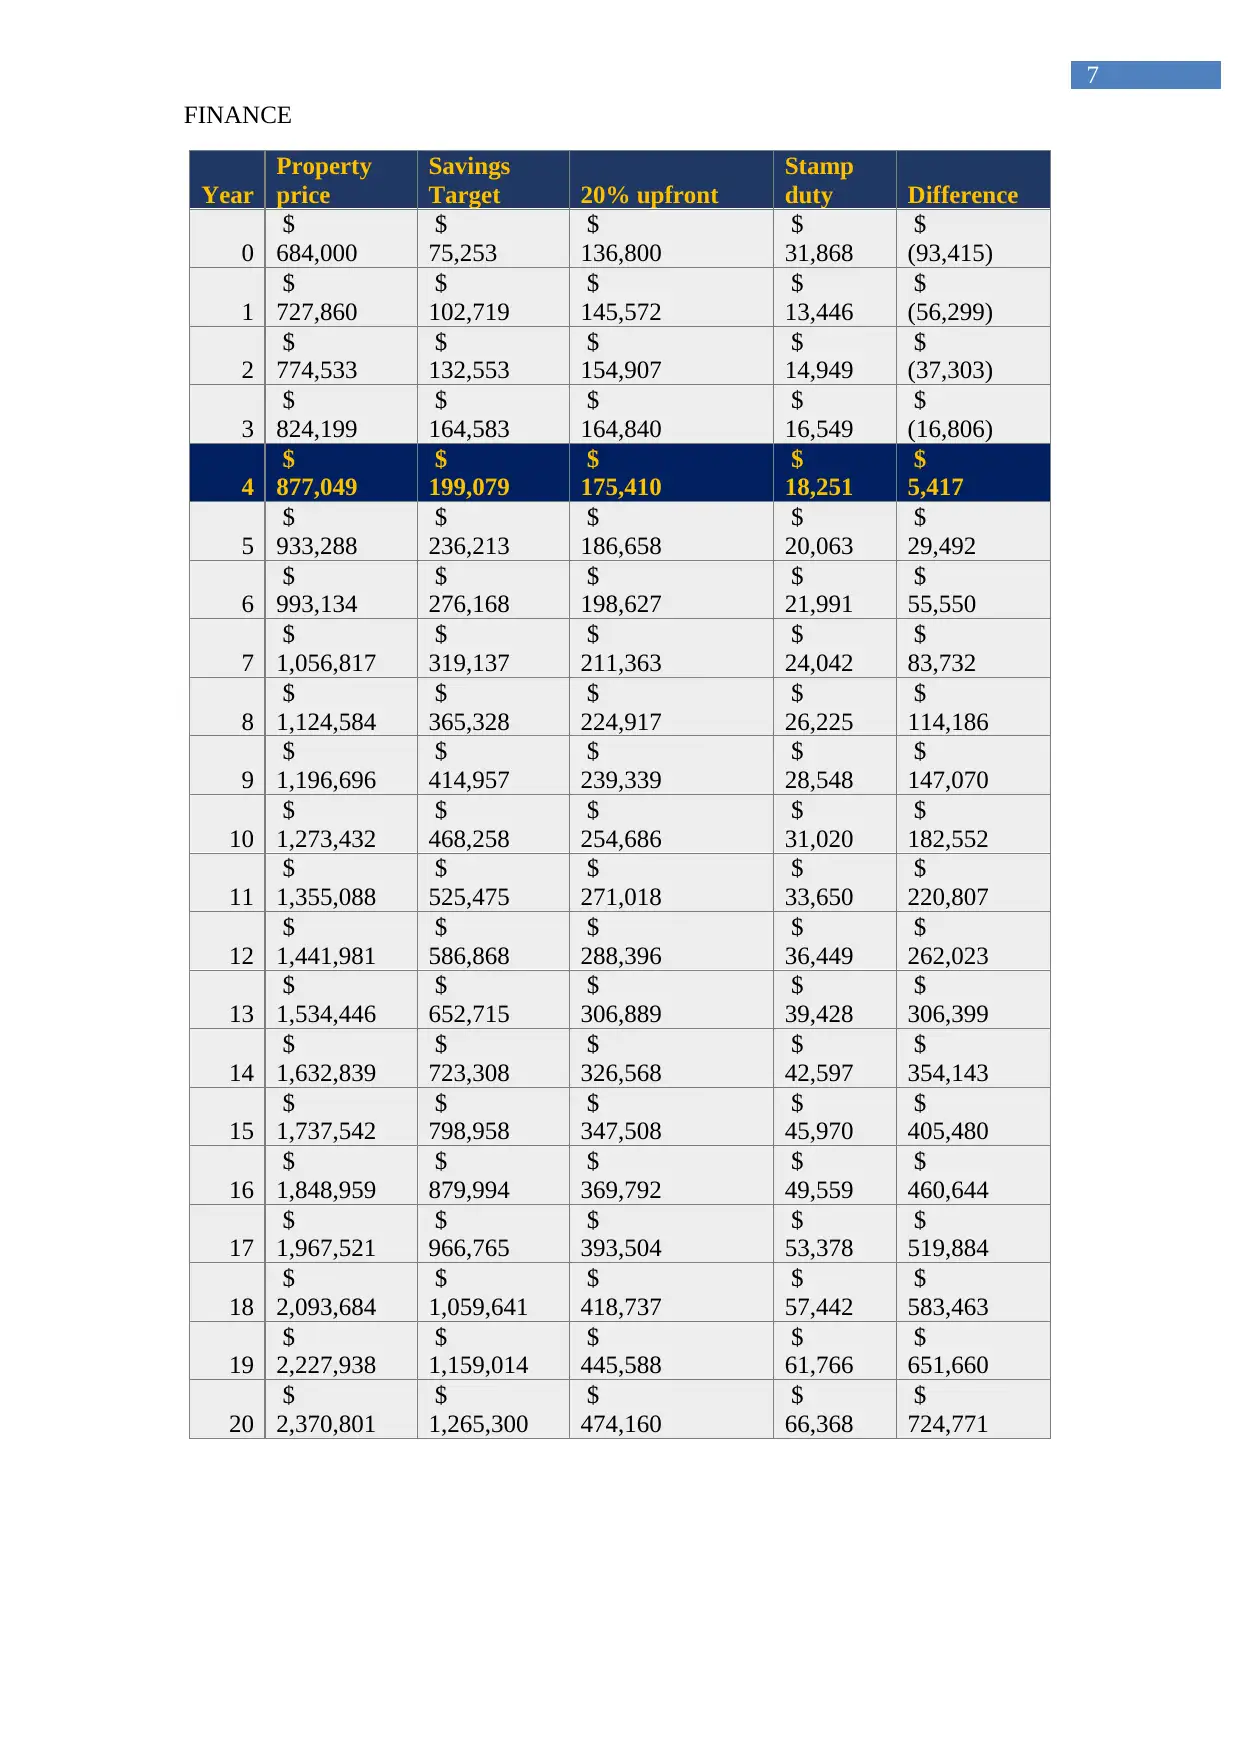
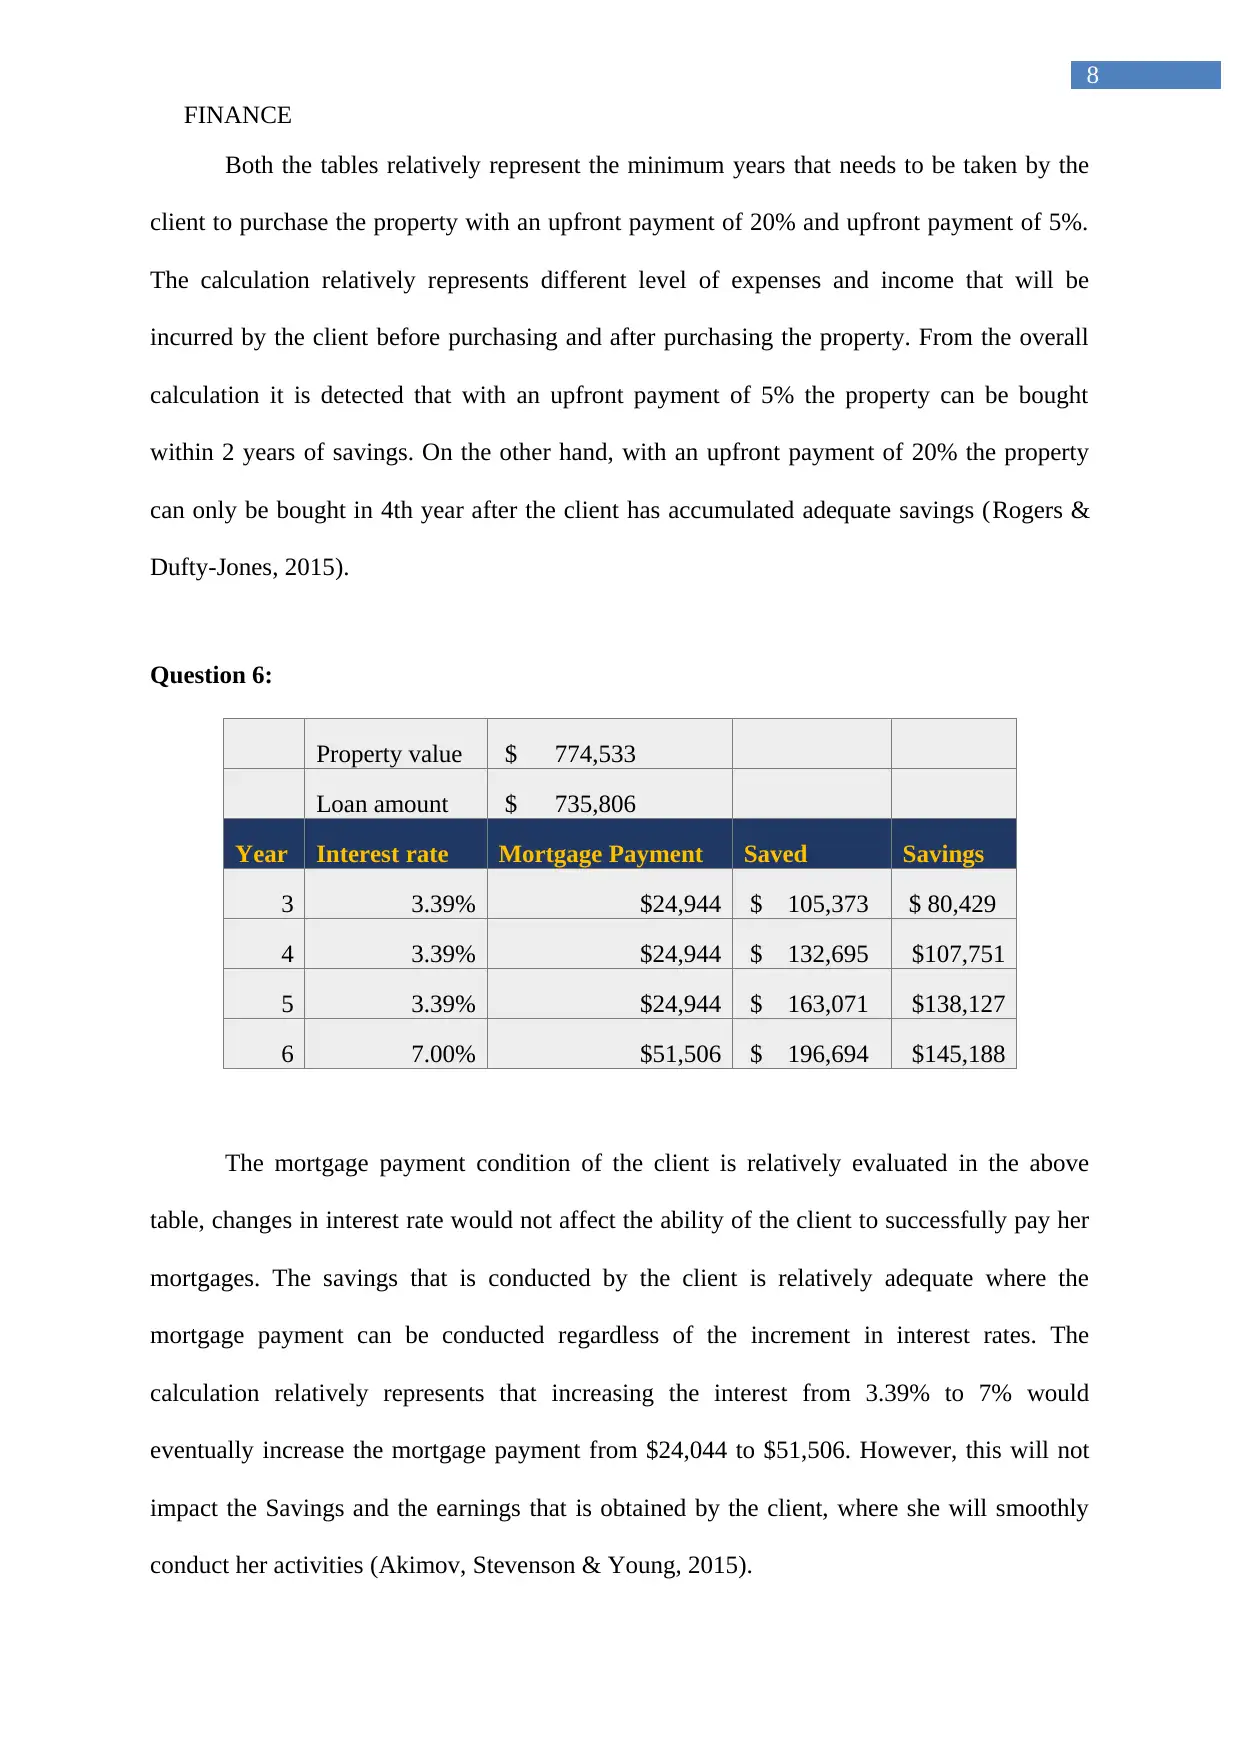
This finance report provides a comprehensive financial analysis for a client aiming to purchase property in Melbourne, Australia. It begins by examining historical property price trends to project future growth and investment needs, utilizing calculations to determine the potential increase in property value over 20 years. The report includes an analysis of income data, inflation rates, and average income increments to forecast the client's savings potential. Detailed calculations are presented to assess the client's monthly and yearly income, expenses, and savings, which are then used to evaluate mortgage options with and without insurance premiums. The report explores different loan scenarios, considering factors such as LVR, deposit amounts, stamp duty, and insurance costs. Furthermore, it analyzes the time required to accumulate sufficient funds for a property purchase under different upfront payment conditions (5% and 20%). Finally, the report assesses the impact of interest rate changes on mortgage payments and identifies potential risks that could affect the financial plan's success, such as job loss or economic downturns. The report concludes by referencing relevant financial and economic literature.
Document Page
Running head: FINANCE
Finance
Name of the Student:
Name of the University:
Authors Note:
tabler-icon-diamond-filled.svg

Secure Best Marks with AI Grader

Need help grading? Try our AI Grader for instant feedback on your assignments.
Document Page
FINANCE
1
Table of Contents
Question 1:.................................................................................................................................2
Question 2:.................................................................................................................................2
Question 3:.................................................................................................................................4
Question 4:.................................................................................................................................5
Question 5:.................................................................................................................................6
Question 6:.................................................................................................................................8
Question 7:.................................................................................................................................9
Reference and Bibliography:....................................................................................................10
Document Page
FINANCE
2
Question 1:
Melbourne historical property price is a relatively used for identifying the growth in
property price. This detection of the growth in property price is a relatively helpful for
deriving and preparing the financial plan for the client who is intended to achieve her
Austrian Dream by purchasing the house. Adequate calculation of 2-year price average is
used to calculate the price change in property of Melbourne to detect the future growth rate.
In addition, average value of price change is taken for deriving the future 20-year property
price (Rogers, Lee & Yan, 2015).
Year 0
Year 1
Year 2
Year 3
Year 4
Year 5
Year 6
Year 7
Year 8
Year 9
Year 10
Year 11
Year 12
Year 13
Year 14
Year 15
Year 16
Year 17
Year 18
Year 19
Year 20
$-
$500.00
$1,000.00
$1,500.00
$2,000.00
$2,500.00
$684.00
$2,370.80
Melbourne property price forecaste for next 20 years "000
The above figure relatively helps in depicting the overall price change of property
over 20 years, which is essential to understand the level of investment that will be conducted
by the client. The property prices relatively increased from 684,000 to 2,370,800 in 20 years,
which relatively indicates the need of adequate investments by the client to buy the house in
Melbourne.
Document Page
FINANCE
3
Question 2:
Year Weekly Income Yearly Income Two Year Average Price change
1994–95 $ 1,340 $ 69,680
1995–96 $ 1,297 $ 67,444 68,562
1996–97 $ 1,342 $ 69,784 68,614 0.08%
1997–98 $ 1,400 $ 72,800 71,292 3.90%
1999–2000 $ 1,534 $ 79,768 76,284 7.00%
2000–01 $ 1,475 $ 76,700 78,234 2.56%
2002–03 $ 1,525 $ 79,300 78,000 -0.30%
2003–04(a) $ 1,582 $ 82,264 80,782 3.57%
2005–06(a) $ 1,681 $ 87,412 84,838 5.02%
2007–08(a) $ 1,967 $ 102,284 94,848 11.80%
2009–10(a) $ 1,870 $ 97,240 99,762 5.18%
2011–12(a) $ 1,914 $ 99,528 98,384 -1.38%
2013–14(a) $ 2,016 $ 104,832 102,180 3.86%
2015–16(a) $ 2,055 $ 106,860 105,846 3.59%
Average 3.74%
Inflation 1.97%
Growth in Income 5.71%
The table relatively holds the 20-year data of income that is generated by salaried
individuals in Melbourne. This calculation would eventually help in evaluating the level of
increment in income that will obtain by the client in future 20 years. The 2-year average
calculation is conducted to determine the average increment in income, while the difference
is used to detect the price change between the averages. Moreover, the price change average
is taken into consideration as an incremental growth rate for the income generated in
Melbourne for next 20 years. In addition, the inflation rate is also added to the income group
which is essential as inflation plays a vital role in raising the level of income for citizens
(Jacobs, 2015).
tabler-icon-diamond-filled.svg

Secure Best Marks with AI Grader

Need help grading? Try our AI Grader for instant feedback on your assignments.
Document Page
FINANCE
4
Year 0
Year 1
Year 2
Year 3
Year 4
Year 5
Year 6
Year 7
Year 8
Year 9
Year 10
Year 11
Year 12
Year 13
Year 14
Year 15
Year 16
Year 17
Year 18
Year 19
Year 20
$-
$50.00
$100.00
$150.00
$200.00
$250.00
$300.00
$80.00
$242.85
Income Growth for the clinet next 20 years "000
With the help of the graph relevant increment in income of the client can be
identified, which is essential to determine the overall savings that will be conducted to
achieve her Austrian dream. The level of income as a relatively risen from $80,000 to
242,850 in 20-year time, which would eventually help in buying the property as soon as
adequate savings are conducted.
Question 3:
Particulars Monthly Yearly
Salary
$
6,666.67
$
80,000.00
Expenses on Amenities
$
1,750.00
$
21,000.00
Expenses on rent
$
1,350.00
$
16,200.00
Total expense
$
3,100.00
$
37,200.00
Tax $17,547.00
Savings
$
2,104.42
$
25,253.00
Particulars Value
Max LVR 80%
Property Value $
Document Page
FINANCE
5
376,265.00
Loan From Bank
$
301,012.00
Deposit to bank
$
75,253.00
The calculations relatively help in identifying the overall Monthly and yearly income
of the client which would be essential to support the mortgage for the house. The evaluation
directly indicated that total savings of $2,104.42 on monthly basis and $25,253 on daily basis
is saved by the client. this in accumulating a property value of $376,265 with a LVR of 80%.
Question 4:
With the help of adequate calculation relevant properties that can be loaned by the
client is effectively evaluated. Moreover, there are two types of loan that is issued by bank
first is without insurance premium and the second is with insurance premium. Both the loan
need to comply with different types of LVR, which demanded for the borrower (Jacobs,
2015).
Particulars (Without Insurance
premium) Value
Max LVR 80%
Property Value
$
370,320.00
Loan From Bank
$
296,256.00
Deposit to bank
$
74,064.00
Stamp Duty
$
1,189.00
The above table relatively represent the maximum Property value of $320,320 that
can be bought by the client with an LVR of 80%, deposit of $74,064 and stamp duty of
$1,189.
Document Page
FINANCE
6
Particulars (With Insurance
premium) Value
Max LVR 99%
Property Value
$
780,000.00
Loan From Bank
$
769,350.00
Deposit to bank
$
10,650.00
Stamp Duty
$
41,870.00
Insurance Premium
$
22,733.00
From the calculation it could be detected that the client can obtain a f Property value
of $780,000 with an LVR of 99%, deposit of $10,650, stamp duty of $41,870 and Insurance
premium of $22,733.
Question 5:
Yea
r
Property
price
Savings
Target
5%
upfront
Insurance
premium
Stamp
duty Amount
0
$
684,000
$
75,253
$
34,200
$
20,222
$
31,868
$
(11,037)
1
$
727,860
$
102,719
$
36,393
$
21,519
$
13,446
$
31,362
2
$
774,533
$
132,553
$
38,727
$
22,899
$
14,949
$
55,979
3
$
824,199
$
164,583
$
41,210
$
24,367
$
16,549
$
82,457
4
$
877,049
$
199,079
$
43,852
$
25,929
$
18,251
$
111,045
5
$
933,288
$
236,213
$
46,664
$
27,592
$
20,063
$
141,893
6
$
993,134
$
276,168
$
49,657
$
29,361
$
21,991
$
175,159
7
$
1,056,817
$
319,137
$
52,841
$
31,244
$
24,042
$
211,010
8
$
1,124,584
$
365,328
$
56,229
$
33,248
$
26,225
$
249,626
9
$
1,196,696
$
414,957
$
59,835
$
35,379
$
28,548
$
291,195
tabler-icon-diamond-filled.svg

Paraphrase This Document

Need a fresh take? Get an instant paraphrase of this document with our AI Paraphraser
Document Page
FINANCE
7
Year
Property
price
Savings
Target 20% upfront
Stamp
duty Difference
0
$
684,000
$
75,253
$
136,800
$
31,868
$
(93,415)
1
$
727,860
$
102,719
$
145,572
$
13,446
$
(56,299)
2
$
774,533
$
132,553
$
154,907
$
14,949
$
(37,303)
3
$
824,199
$
164,583
$
164,840
$
16,549
$
(16,806)
4
$
877,049
$
199,079
$
175,410
$
18,251
$
5,417
5
$
933,288
$
236,213
$
186,658
$
20,063
$
29,492
6
$
993,134
$
276,168
$
198,627
$
21,991
$
55,550
7
$
1,056,817
$
319,137
$
211,363
$
24,042
$
83,732
8
$
1,124,584
$
365,328
$
224,917
$
26,225
$
114,186
9
$
1,196,696
$
414,957
$
239,339
$
28,548
$
147,070
10
$
1,273,432
$
468,258
$
254,686
$
31,020
$
182,552
11
$
1,355,088
$
525,475
$
271,018
$
33,650
$
220,807
12
$
1,441,981
$
586,868
$
288,396
$
36,449
$
262,023
13
$
1,534,446
$
652,715
$
306,889
$
39,428
$
306,399
14
$
1,632,839
$
723,308
$
326,568
$
42,597
$
354,143
15
$
1,737,542
$
798,958
$
347,508
$
45,970
$
405,480
16
$
1,848,959
$
879,994
$
369,792
$
49,559
$
460,644
17
$
1,967,521
$
966,765
$
393,504
$
53,378
$
519,884
18
$
2,093,684
$
1,059,641
$
418,737
$
57,442
$
583,463
19
$
2,227,938
$
1,159,014
$
445,588
$
61,766
$
651,660
20
$
2,370,801
$
1,265,300
$
474,160
$
66,368
$
724,771
Document Page
FINANCE
8
Both the tables relatively represent the minimum years that needs to be taken by the
client to purchase the property with an upfront payment of 20% and upfront payment of 5%.
The calculation relatively represents different level of expenses and income that will be
incurred by the client before purchasing and after purchasing the property. From the overall
calculation it is detected that with an upfront payment of 5% the property can be bought
within 2 years of savings. On the other hand, with an upfront payment of 20% the property
can only be bought in 4th year after the client has accumulated adequate savings (Rogers &
Dufty-Jones, 2015).
Question 6:
Property value $ 774,533
Loan amount $ 735,806
Year Interest rate Mortgage Payment Saved Savings
3 3.39% $24,944 $ 105,373 $ 80,429
4 3.39% $24,944 $ 132,695 $107,751
5 3.39% $24,944 $ 163,071 $138,127
6 7.00% $51,506 $ 196,694 $145,188
The mortgage payment condition of the client is relatively evaluated in the above
table, changes in interest rate would not affect the ability of the client to successfully pay her
mortgages. The savings that is conducted by the client is relatively adequate where the
mortgage payment can be conducted regardless of the increment in interest rates. The
calculation relatively represents that increasing the interest from 3.39% to 7% would
eventually increase the mortgage payment from $24,044 to $51,506. However, this will not
impact the Savings and the earnings that is obtained by the client, where she will smoothly
conduct her activities (Akimov, Stevenson & Young, 2015).
Document Page
FINANCE
9
Question 7:
The negative impact of job loss, increment in interest rate more than 8%, economic
crisis and income loss would relevantly result in the failure of the drafted financial plan for
the client. The above measures would directly hinder the progress of the client in maintaining
adequate income to support her Austrian dream of owning a house in Melbourne. However,
on other circumstances the financial plan would eventually allow the client to effectively
support her operations and maintain the property (Kohler & Van, 2015). The financial plan
address for the client comprises of all the relevant expenses, income, mortgage payments, and
savings that will be conducted over the period of her life.
tabler-icon-diamond-filled.svg

Secure Best Marks with AI Grader

Need help grading? Try our AI Grader for instant feedback on your assignments.
Document Page
FINANCE
10
Reference and Bibliography:
Abs.gov.au. (2018). Ato.gov.au. Retrieved 27 May 2018, from
https://www.ato.gov.au/calculators-and-tools/simple-tax-calculator/
Akimov, A., Stevenson, S., & Young, J. (2015). Synchronisation and commonalities in
metropolitan housing market cycles. Urban Studies, 52(9), 1665-1682.
Colic-Peisker, V., Ong, R., & Wood, G. (2015). Asset poverty, precarious housing and
ontological security in older age: an Australian case study. International Journal of
Housing Policy, 15(2), 167-186.
Jacobs, K. (2015). A reverse form of welfarism: some reflections on Australian housing
policy. Australian journal of social issues, 50(1), 53-68.
Jacobs, K. (2015). The ‘politics’ of Australian housing: the role of lobbyists and their
influence in shaping policy. Housing studies, 30(5), 694-710.
Kohler, M., & Van Der Merwe, M. (2015). Long-run trends in housing price growth. Reserve
Bank Bulletin, 21-30.
Rogers, D., & Dufty-Jones, R. (2015). 21st-century Australian housing: New frontiers in the
Asia-Pacific. Housing in twenty-first century Australia: People, practices and
policies, 221-236.
Rogers, D., Lee, C. L., & Yan, D. (2015). The politics of foreign investment in Australian
housing: Chinese investors, translocal sales agents and local resistance. Housing
Studies, 30(5), 730-748.
Senate Economics References Committee. (2015). Out of reach? The Australian housing
affordability challenge.
Document Page
FINANCE
11
Stampduty.calculatorsaustralia.com.au. (2014). Stamp Duty Calculator. Retrieved 27 May
2018, from https://stampduty.calculatorsaustralia.com.au/
chevron_up_icon
1 out of 12
circle_padding
hide_on_mobile
zoom_out_icon
logo.png

Your All-in-One AI-Powered Toolkit for Academic Success.

Available 24*7 on WhatsApp / Email

[object Object]