Financial Modeling Assignment: Portfolio Analysis and Option Pricing
VerifiedAdded on 2020/04/13
|10
|1832
|364
Practical Assignment
AI Summary
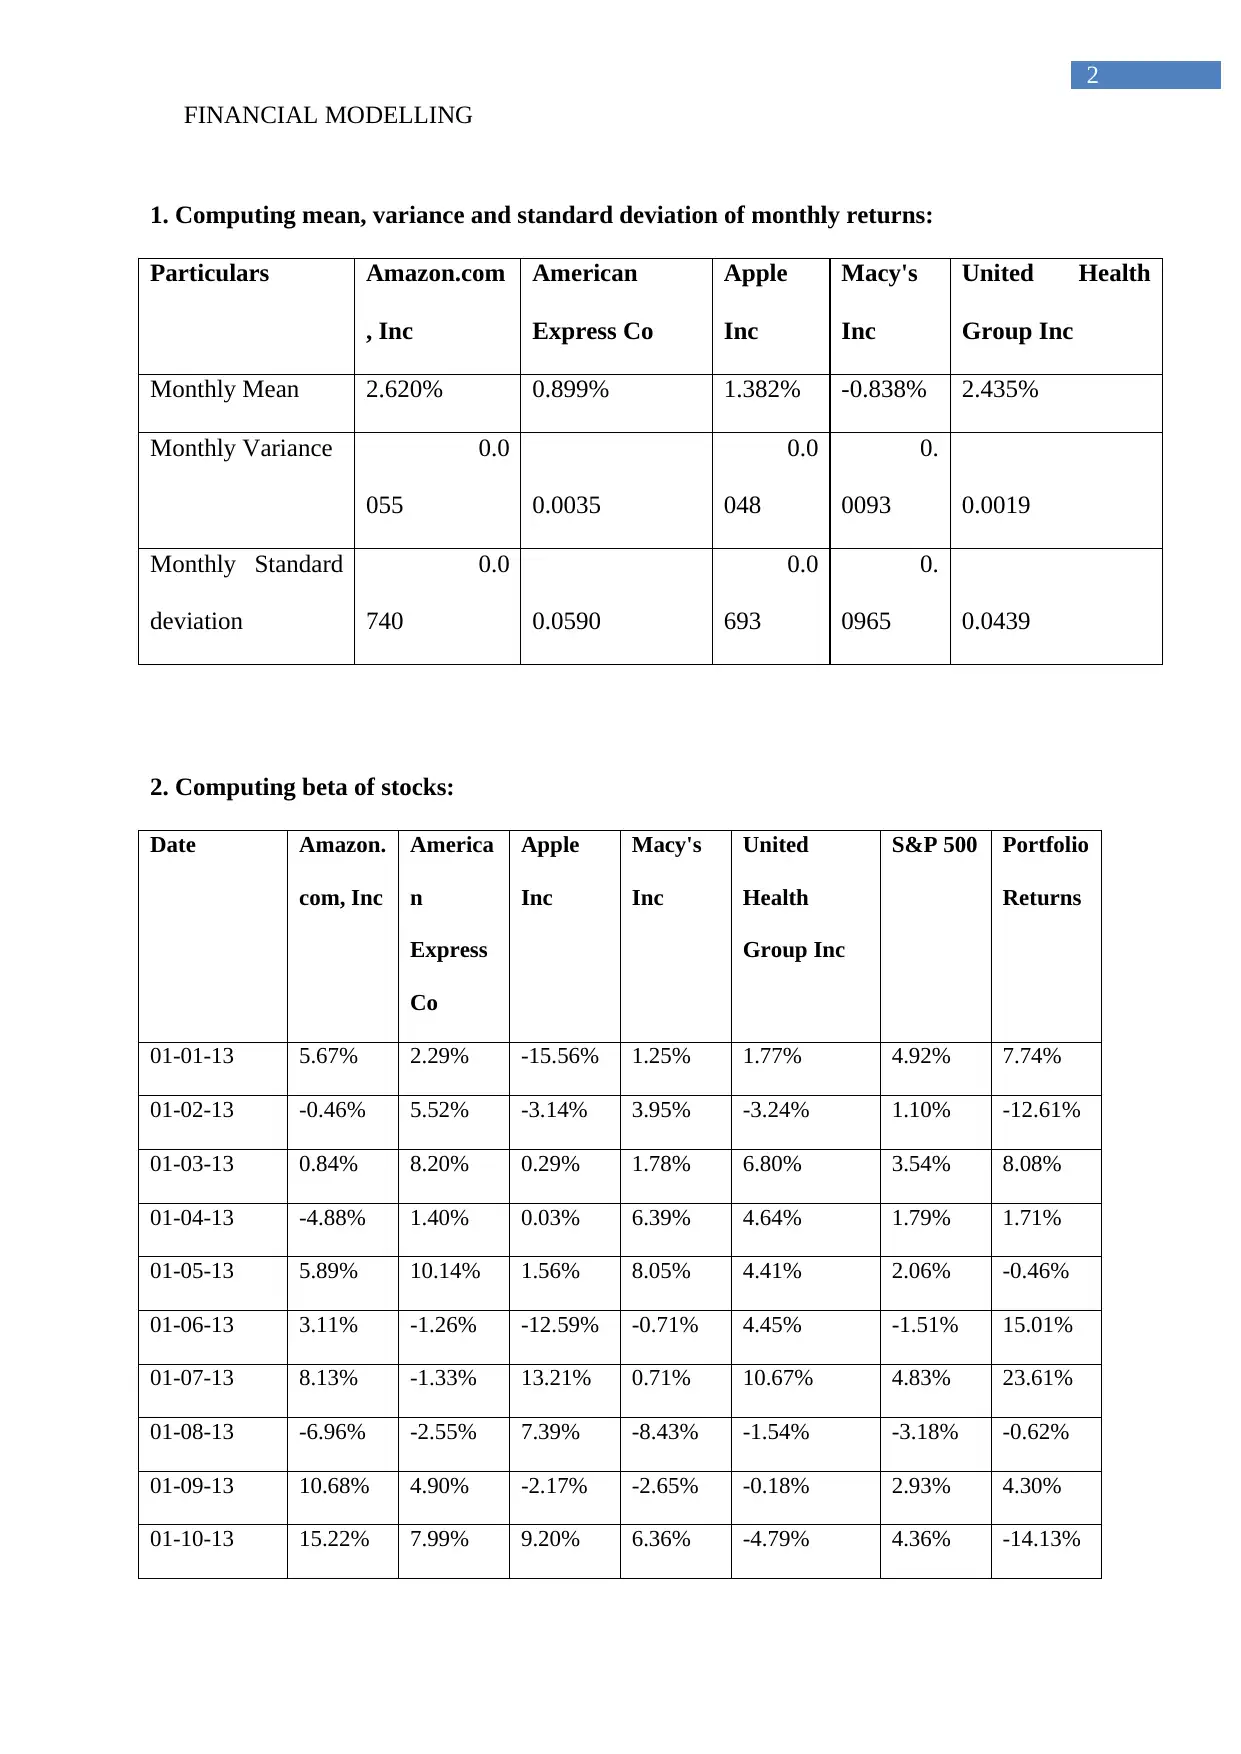
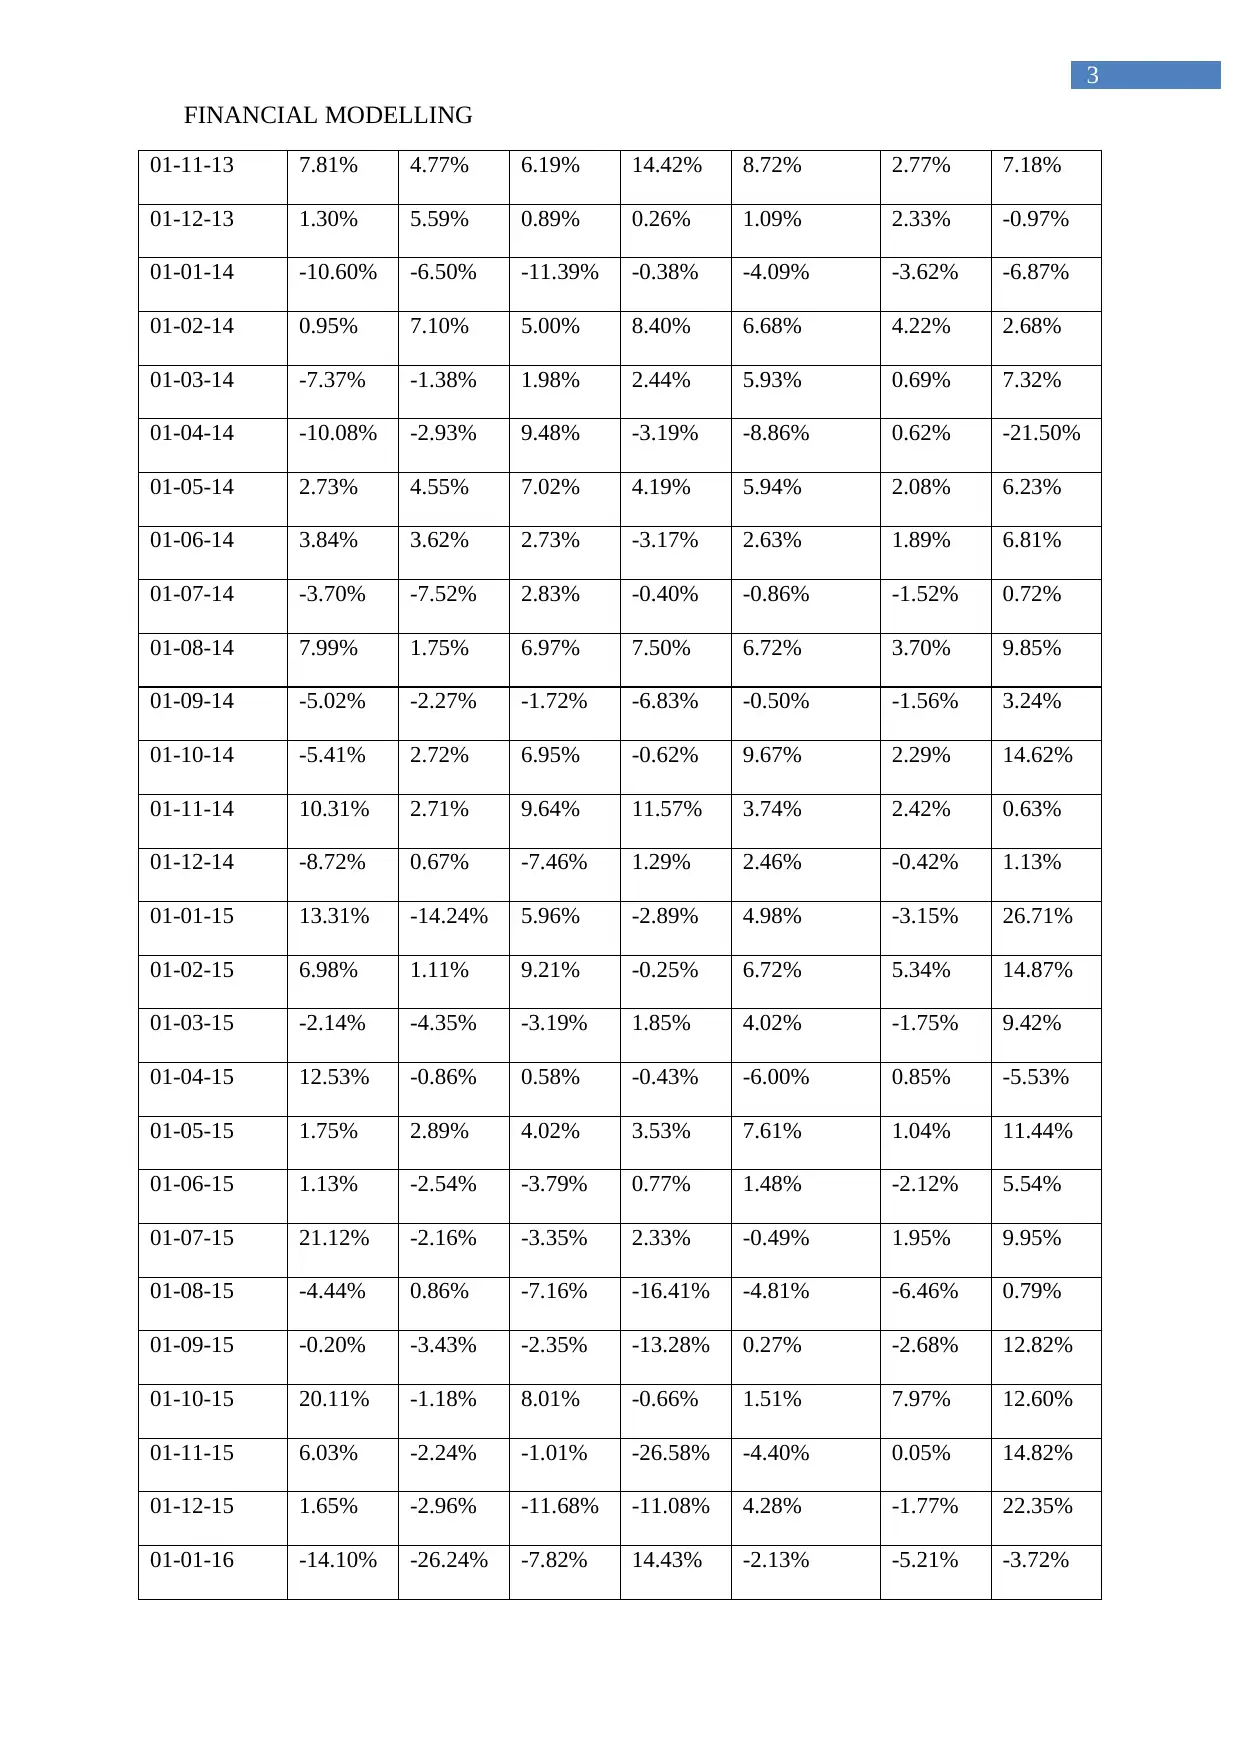
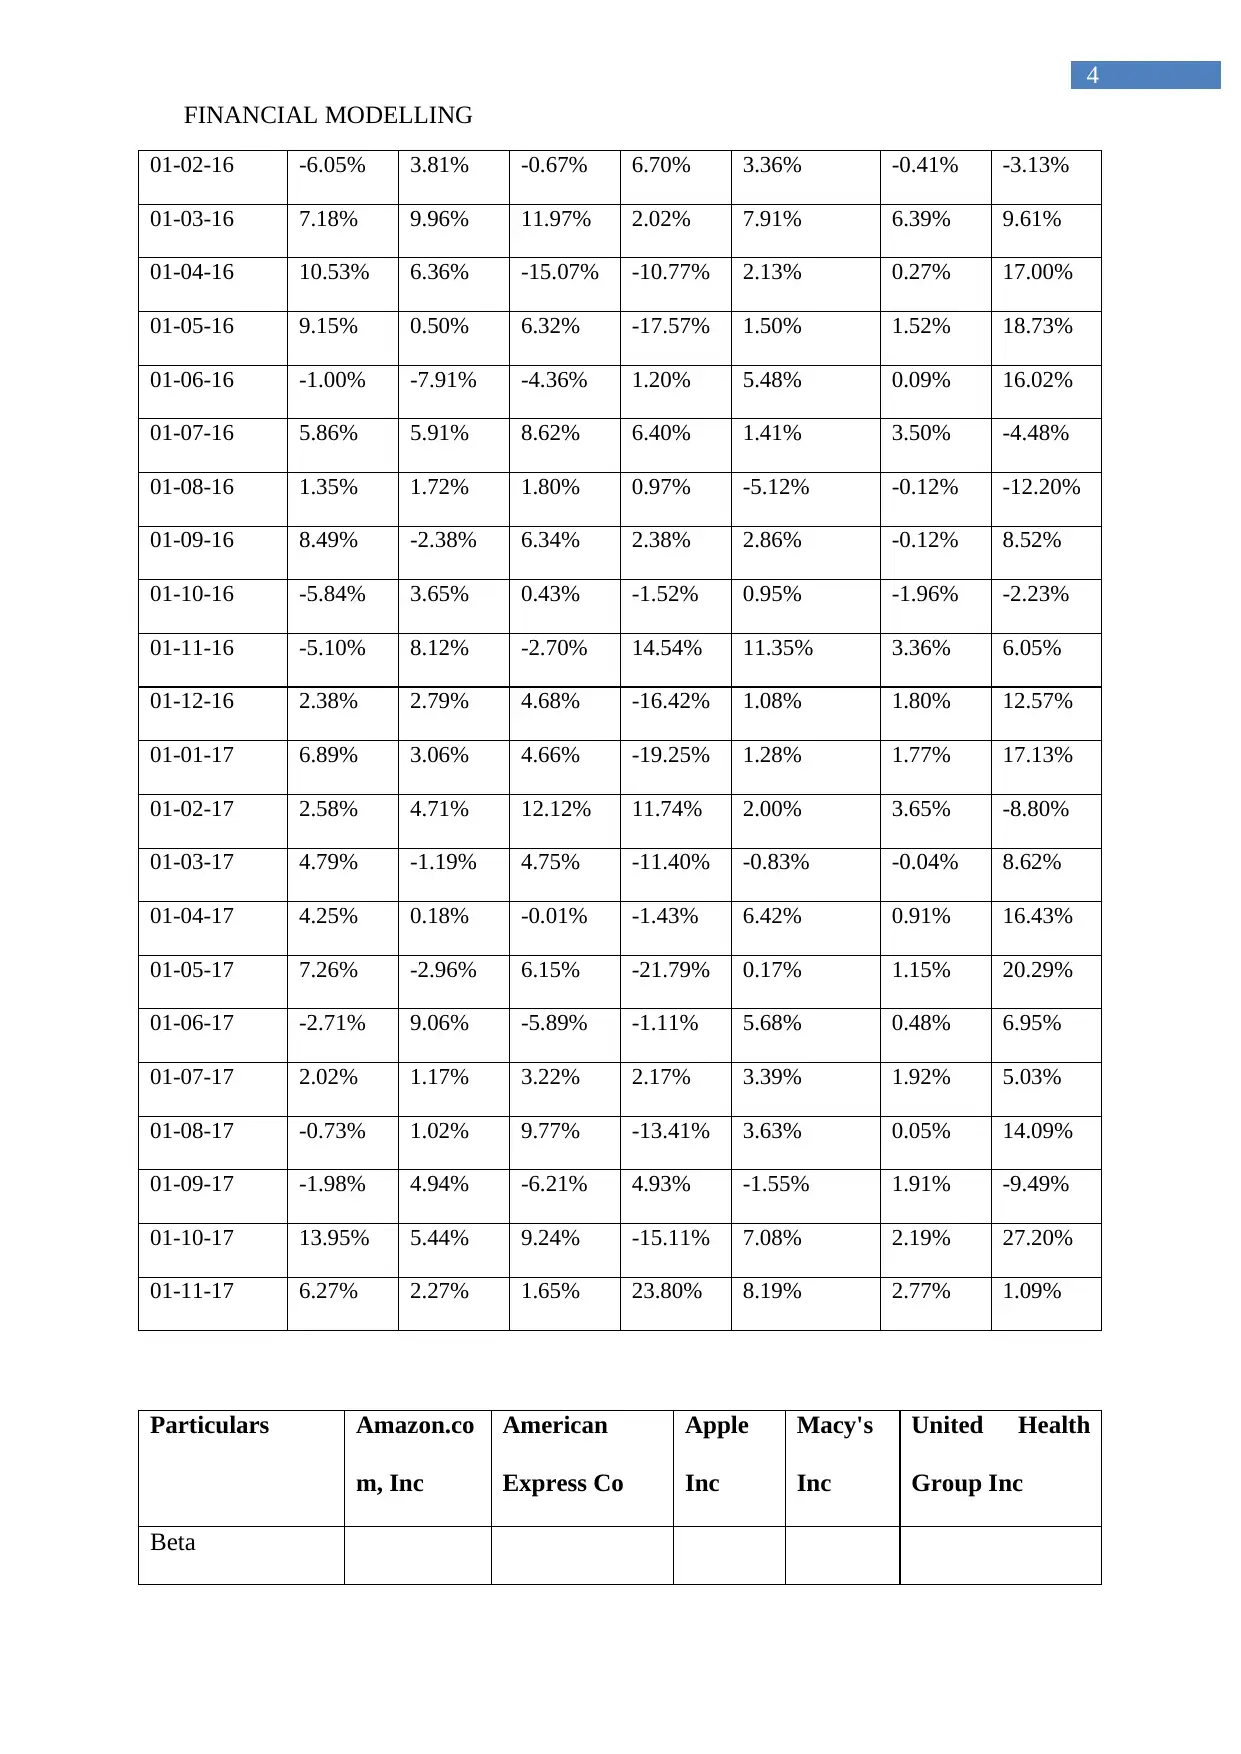
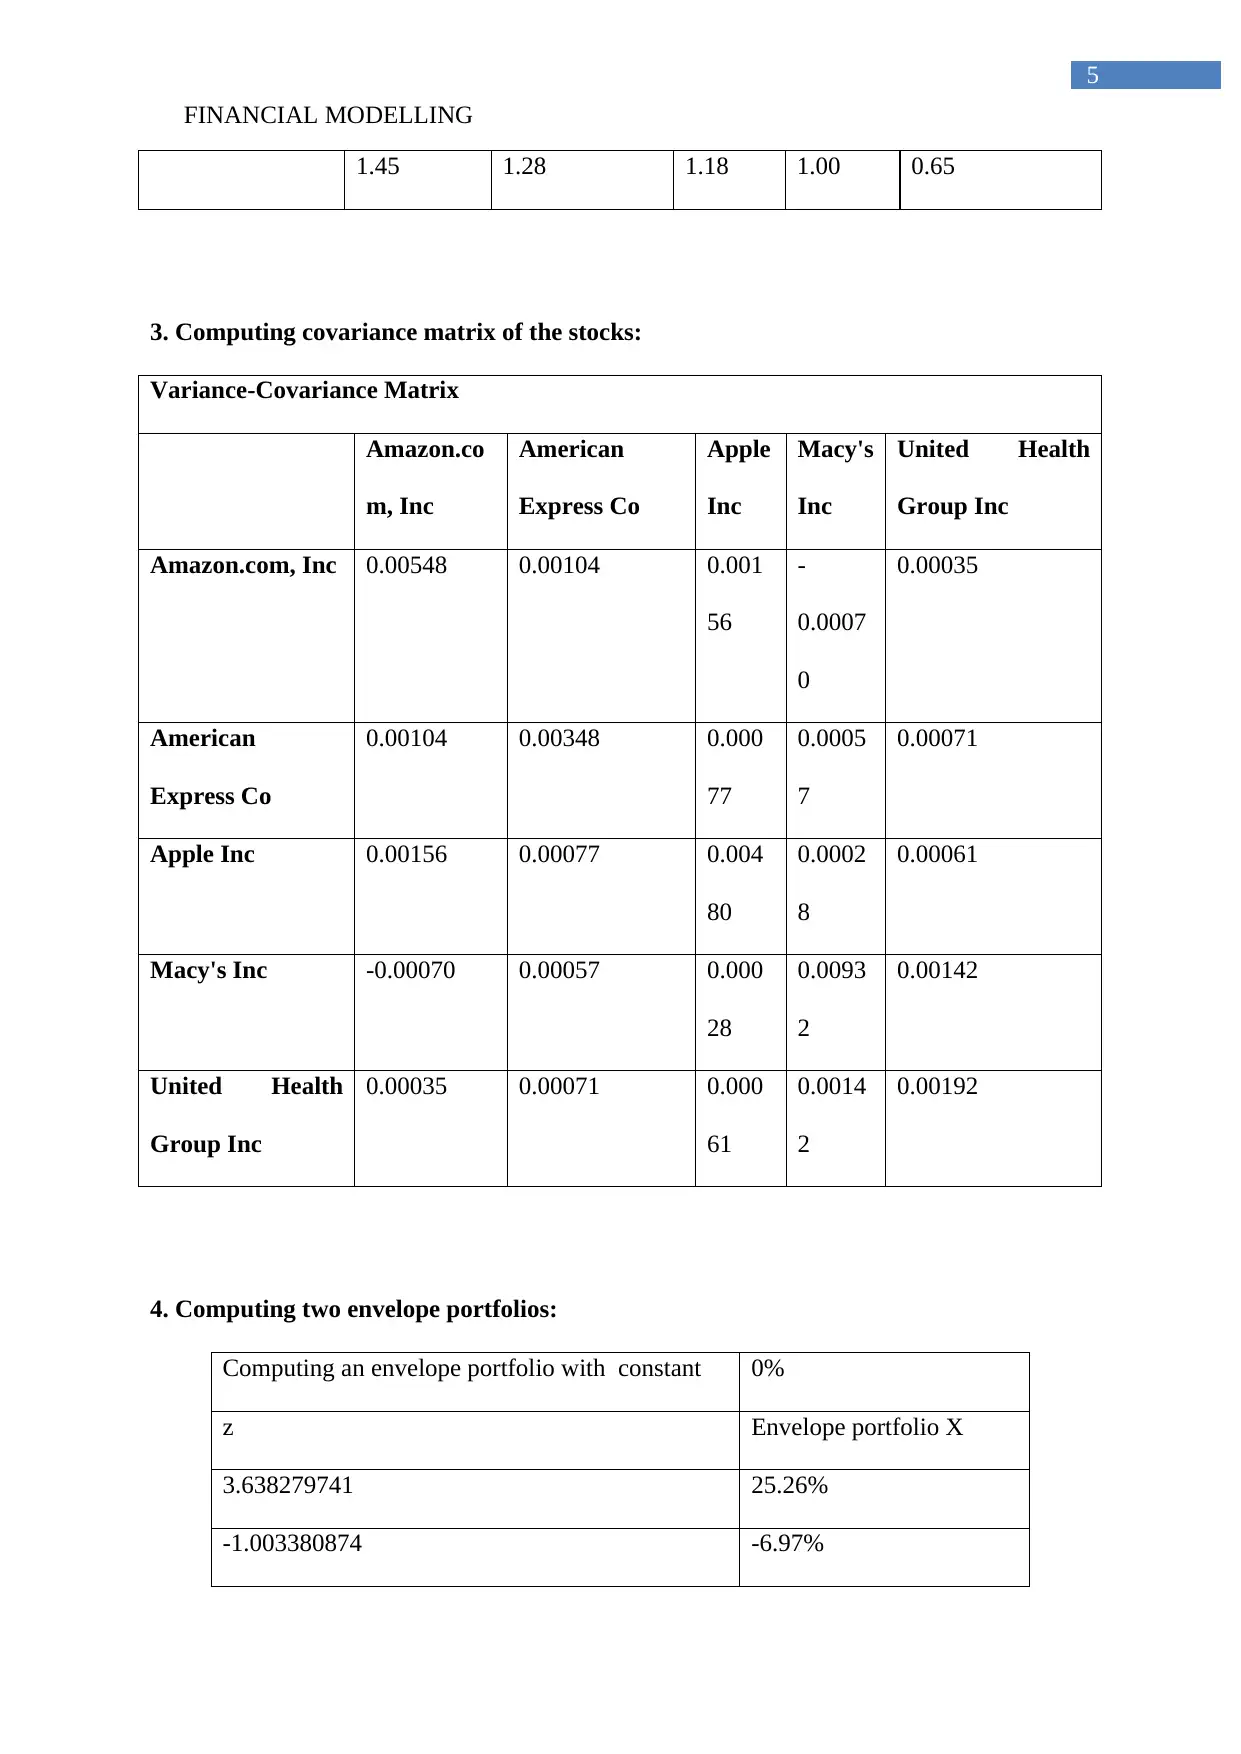
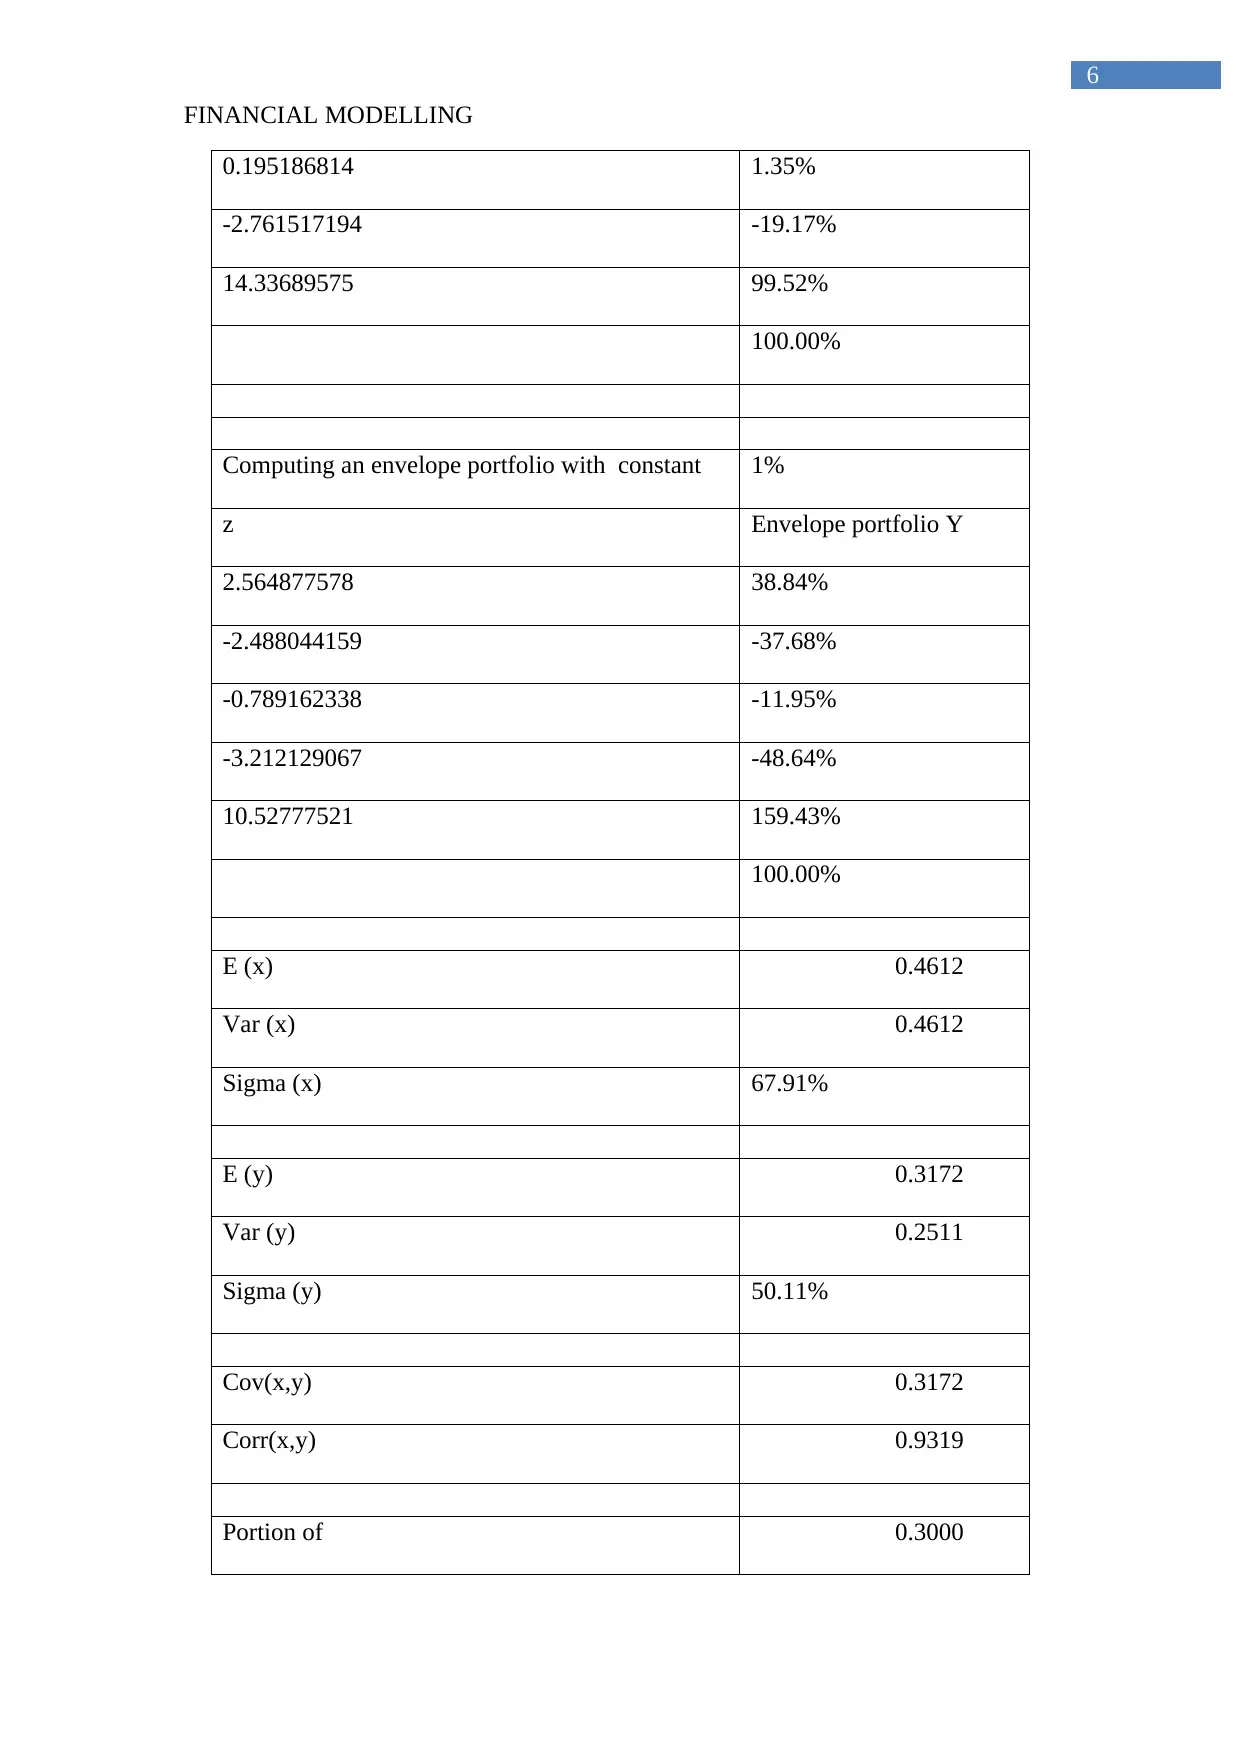
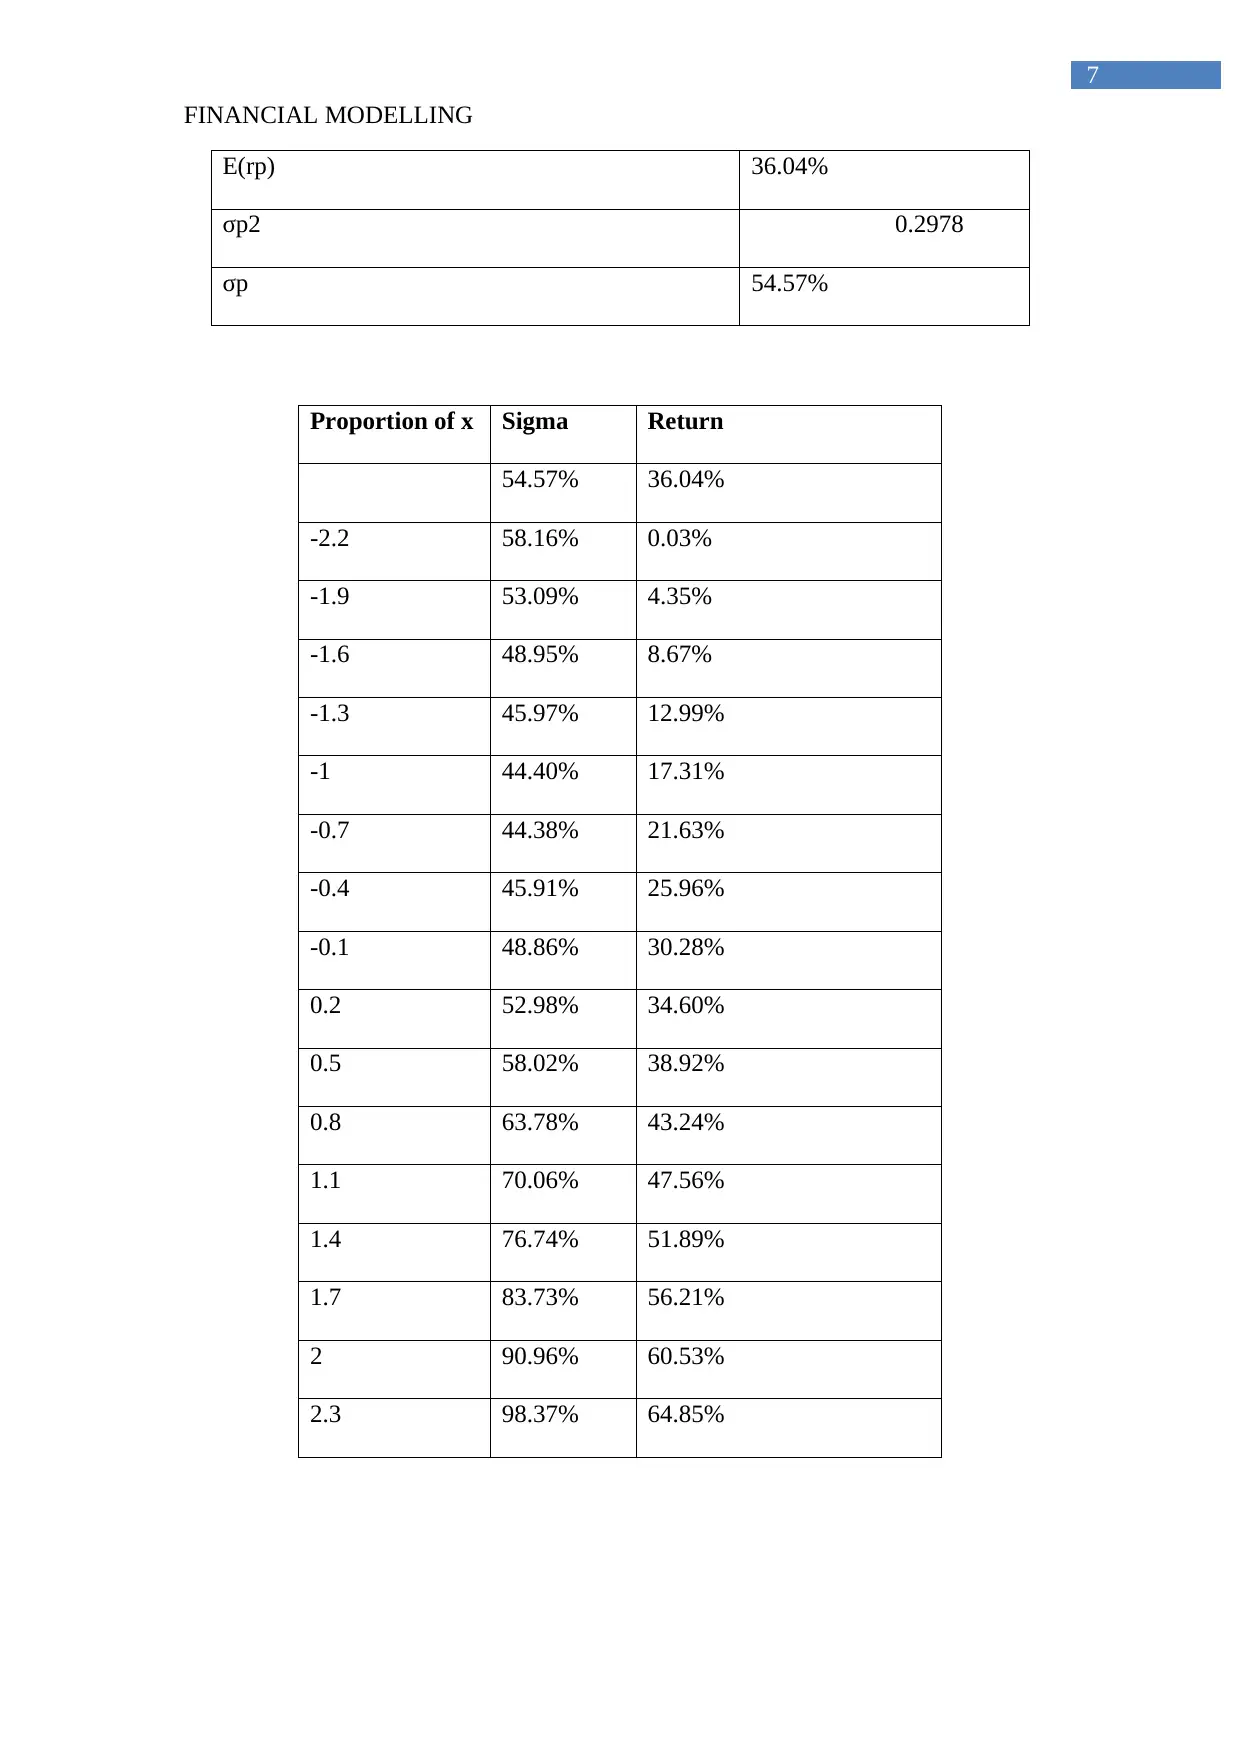
This financial modeling assignment delves into various aspects of investment analysis and portfolio management. It begins with calculating the mean, variance, and standard deviation of monthly returns for several stocks, followed by computing their betas relative to the S&P 500. The assignment then proceeds to construct a covariance matrix and two envelope portfolios. Furthermore, it involves plotting the optimal portfolio on a graph and calculating its mean, variance, and beta. The solution also includes the computation of an optimum portfolio under short-sale constraints. The assignment extends to option pricing using both the binomial model and the Black-Scholes model, with a comparison of the results and a percentage error calculation. Finally, it presents a graph illustrating a put strategy, providing a comprehensive overview of financial modeling techniques.
1 out of 10


Your All-in-One AI-Powered Toolkit for Academic Success.
+13062052269
info@desklib.com
Available 24*7 on WhatsApp / Email
![[object Object]](/_next/static/media/star-bottom.7253800d.svg)
Copyright © 2020–2026 A2Z Services. All Rights Reserved. Developed and managed by ZUCOL.