FIN200: Financial Accounting Report - Portfolio Analysis & CAPM
VerifiedAdded on 2022/08/23
|13
|2882
|31
Report
AI Summary
This financial accounting report delves into portfolio theory, exploring concepts such as the Security Market Line (SML) and Capital Market Line (CML), and their graphical depictions. It identifies and discusses the importance of minimum variance portfolios in risk management and diversification. The report then examines the Capital Asset Pricing Model (CAPM), justifying its relevance in calculating the required rate of return compared to other methods. It covers how CAPM helps in estimating expected returns and managing systematic risks, making it a vital tool in investment management. The report also emphasizes the importance of diversification and efficient portfolios, providing a comprehensive understanding of financial accounting and investment strategies, as well as the importance of beta values and the assumptions underlying the CAPM model, and its limitations.
Running head: FINANCIAL ACCOUNTING
Financial Accounting
Name of the Student
Name of the University
Author Note
Financial Accounting
Name of the Student
Name of the University
Author Note
Paraphrase This Document
Need a fresh take? Get an instant paraphrase of this document with our AI Paraphraser
1FINANCIAL ACCOUNTING
Table of Contents
Introduction................................................................................................................................2
Discussion..................................................................................................................................2
Security Market Line versus Capital Market Line.................................................................2
Importance of Minimum Variance Portfolios........................................................................5
CAPM Relevance for Required Rate of Return.....................................................................7
Conclusion..................................................................................................................................9
References................................................................................................................................10
2FINANCIAL ACCOUNTING
Introduction
Company uses several management techniques in financial management. Financial
management is not complete without the reference of modern portfolio theory that efficiently
constructs the investor’s portfolio (Elterich 2014). The report aims to underline portfolio
theories through the theory of CAPM and its related concepts. The theory manages the risk
and returns factors related to the portfolio as per the scenario of the market. Capital Asset
Pricing Model (CAPM) is a model that is highly used in the field of investment management.
The report has discussed regarding the efficient portfolios in which Minimum Variance
Portfolios determines to provide with an expected level of return through minimum risk that
is positioned through the diversified portfolio (Rutterford and Sotiropoulos 2016). Markowitz
suggests the investor that they can reduce the risk of loss by diversifying and allocating their
assets of investment with a proper quantitative technique (Chen 2016). The discussion cannot
be completed without the reference of the Security market line, which represents CAPM
graphically, and Capital market line that reflects a proficient portfolio and Minimum variance
portfolios graphically. All of these form a pillar of financial and investment management in
which it embraces major importance in making decisions related to the investment.
Discussion
Security Market Line versus Capital Market Line
SML or Security Market Line is the graphical demonstration of CAPM that seeks to
present the level of market risk based on an assumption of a perfect market. SML estimates
the expected return by assuming that risk and return are proceeding in the same direction
(Jylha 2014). Thus, the investors who prefer a risk-averse condition used to choose the
investment nearby to the start of the line where the risk seems to be zero. On the other hand,
the investors who are risk-takers used to choose the investment to the uppermost point of the
⊘ This is a preview!⊘
Do you want full access?
Subscribe today to unlock all pages.
Trusted by 1+ million students worldwide
3FINANCIAL ACCOUNTING
line, which represents a higher risk. The securities plotted above the SML are undervalued,
that means the risk-free rate undervalued because the expected return as compare to their risk
is low (De Giorgi, Post and Yalcin 2019). However, the securities below the SML are
overvalued due to their expected return, as compared to their risk is high.
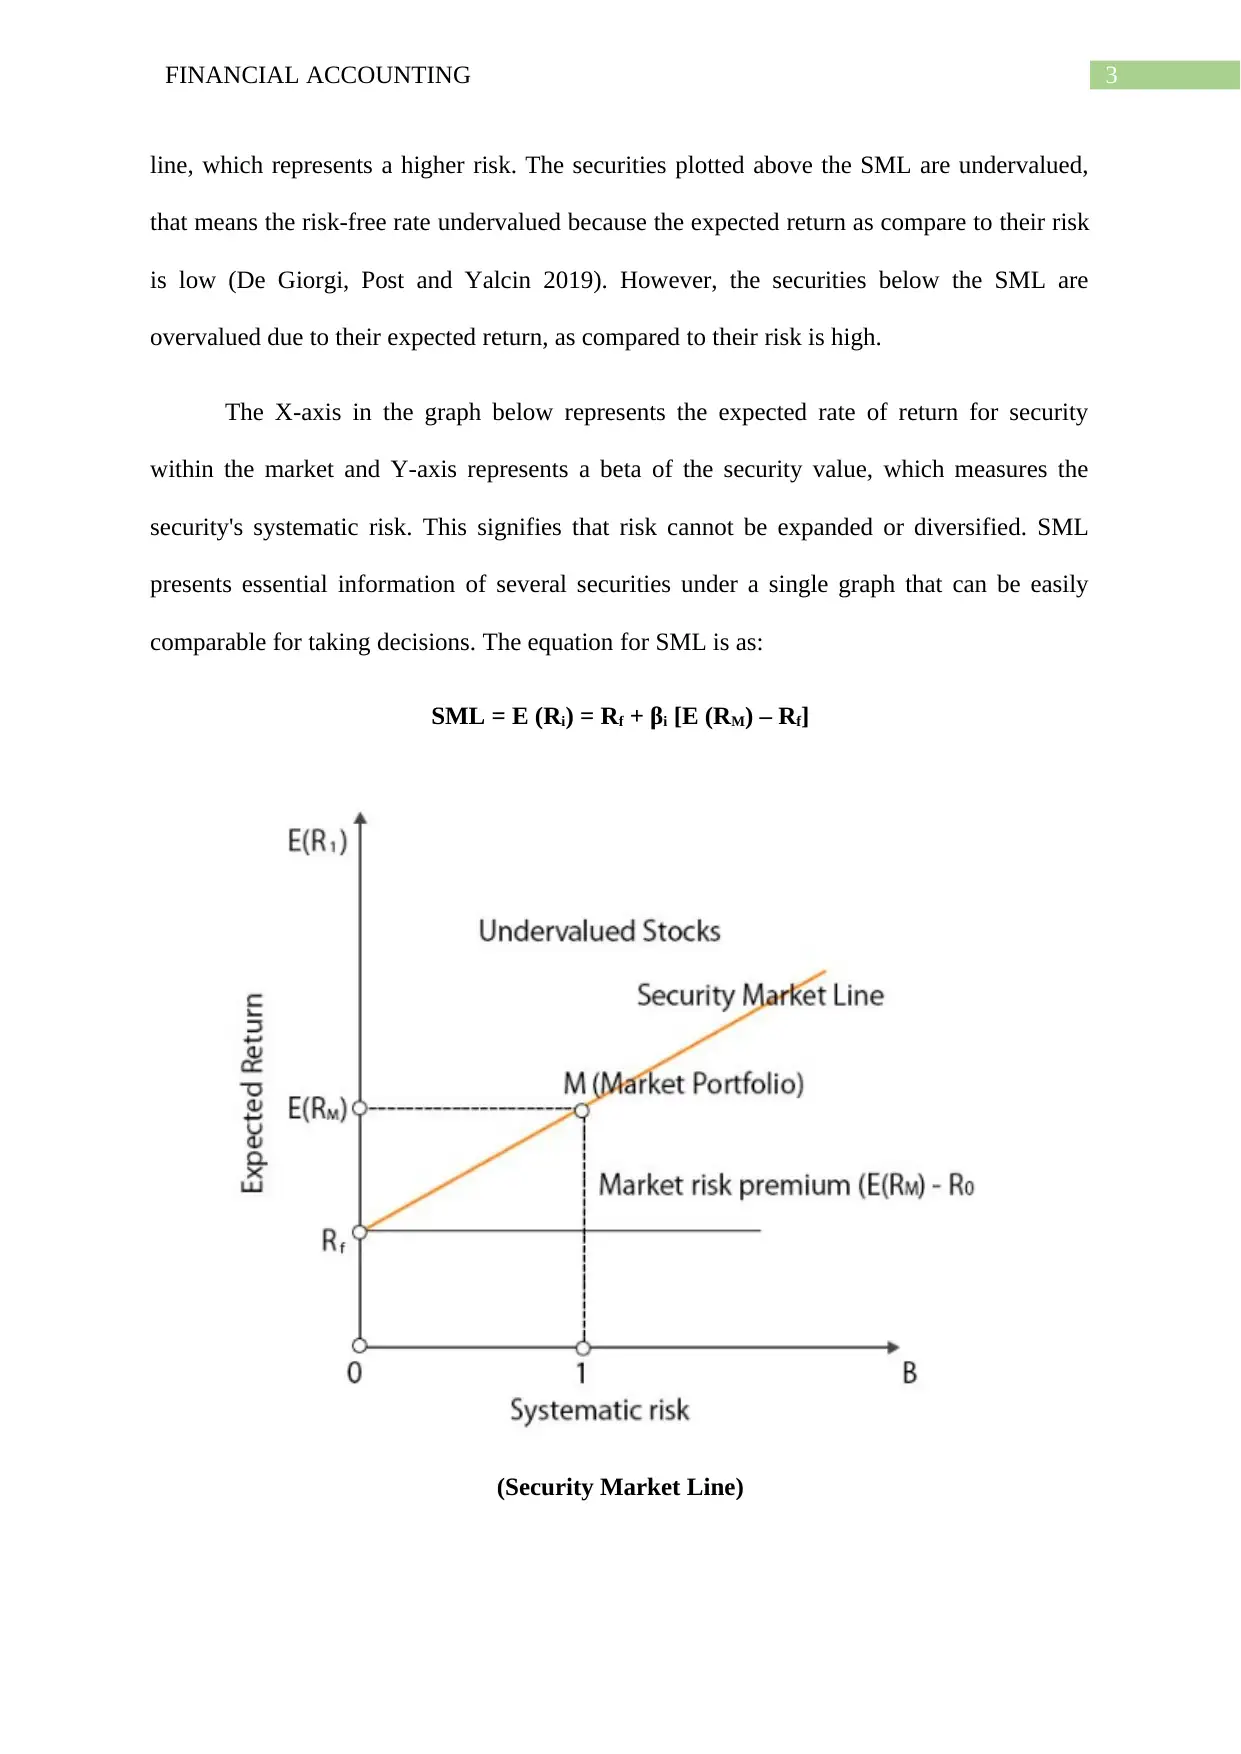
The X-axis in the graph below represents the expected rate of return for security
within the market and Y-axis represents a beta of the security value, which measures the
security's systematic risk. This signifies that risk cannot be expanded or diversified. SML
presents essential information of several securities under a single graph that can be easily
comparable for taking decisions. The equation for SML is as:
SML = E (Ri) = Rf + βi [E (RM) – Rf]
(Security Market Line)
line, which represents a higher risk. The securities plotted above the SML are undervalued,
that means the risk-free rate undervalued because the expected return as compare to their risk
is low (De Giorgi, Post and Yalcin 2019). However, the securities below the SML are
overvalued due to their expected return, as compared to their risk is high.
The X-axis in the graph below represents the expected rate of return for security
within the market and Y-axis represents a beta of the security value, which measures the
security's systematic risk. This signifies that risk cannot be expanded or diversified. SML
presents essential information of several securities under a single graph that can be easily
comparable for taking decisions. The equation for SML is as:
SML = E (Ri) = Rf + βi [E (RM) – Rf]
(Security Market Line)
Paraphrase This Document
Need a fresh take? Get an instant paraphrase of this document with our AI Paraphraser
4FINANCIAL ACCOUNTING
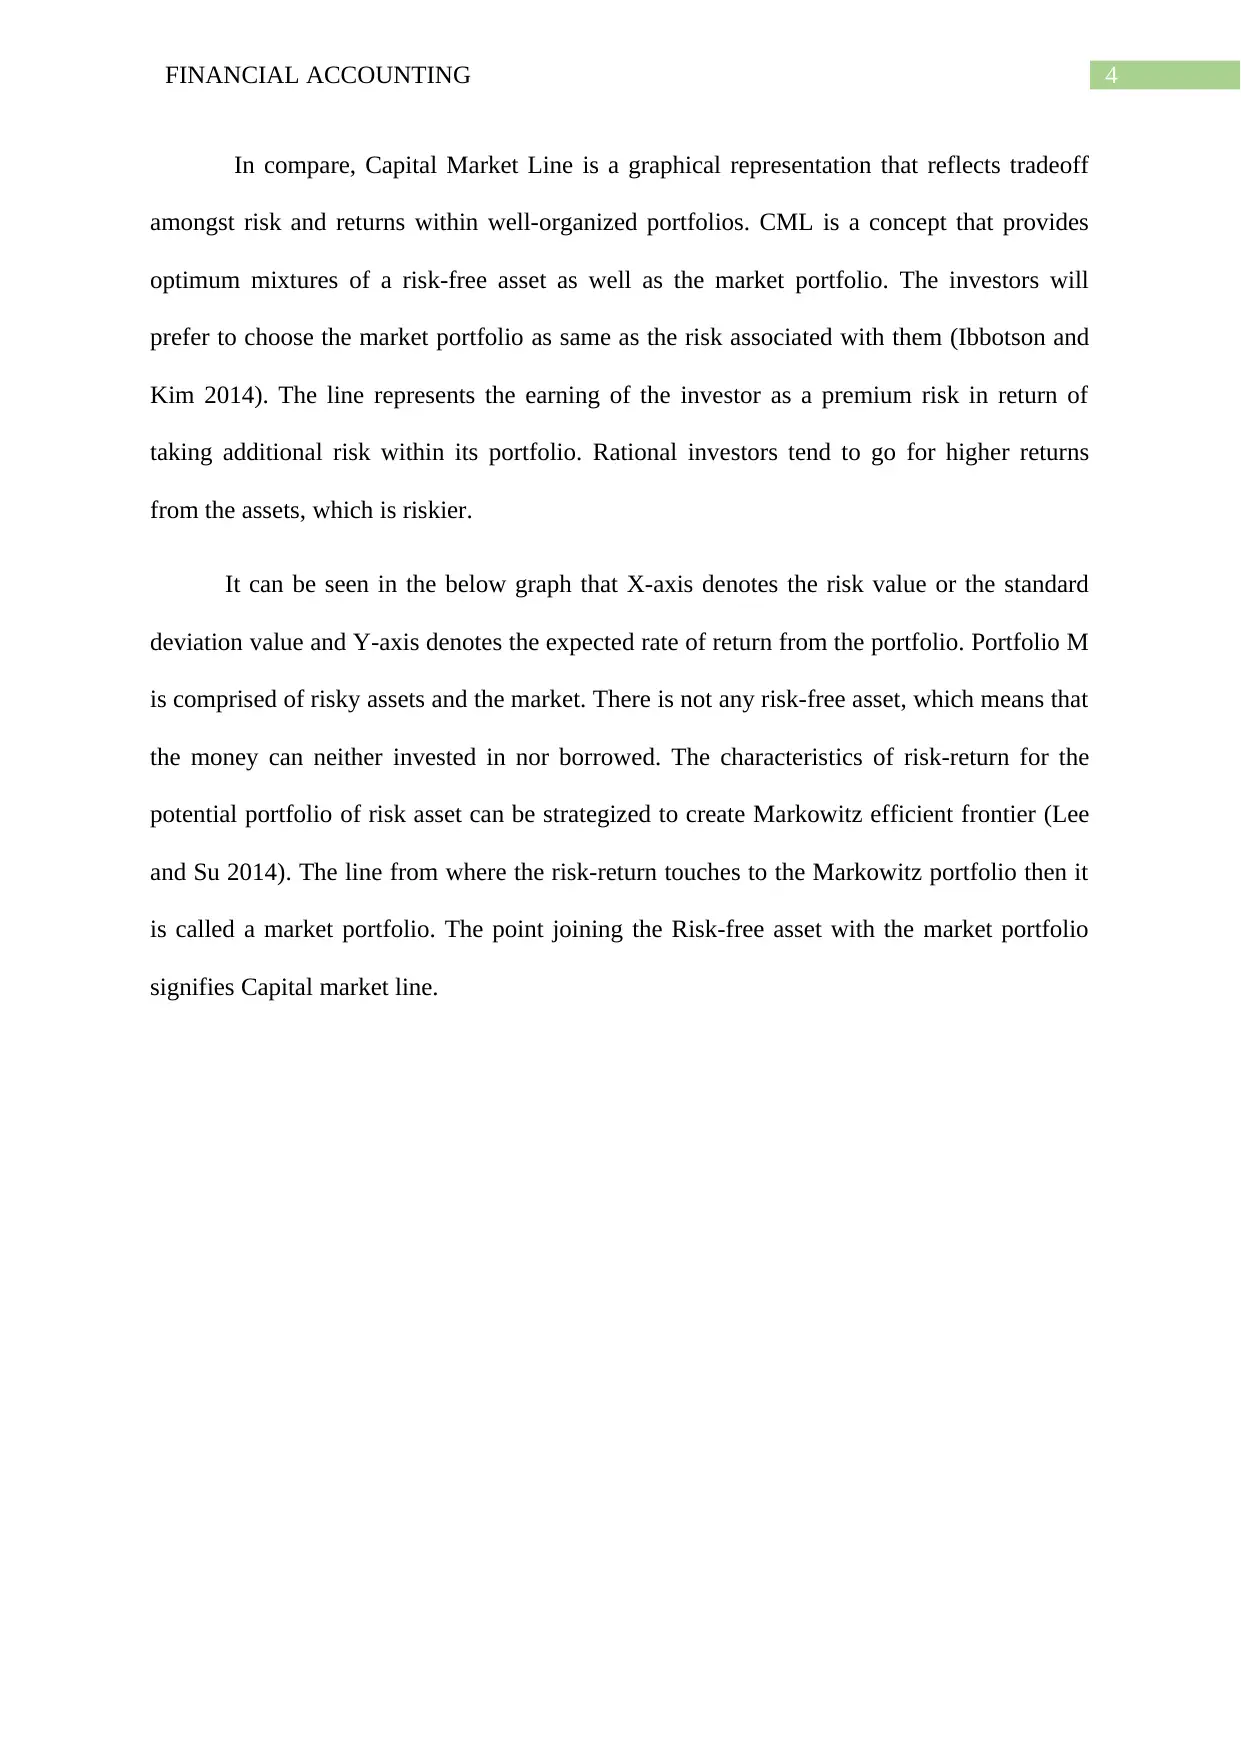
In compare, Capital Market Line is a graphical representation that reflects tradeoff
amongst risk and returns within well-organized portfolios. CML is a concept that provides
optimum mixtures of a risk-free asset as well as the market portfolio. The investors will
prefer to choose the market portfolio as same as the risk associated with them (Ibbotson and
Kim 2014). The line represents the earning of the investor as a premium risk in return of
taking additional risk within its portfolio. Rational investors tend to go for higher returns
from the assets, which is riskier.
It can be seen in the below graph that X-axis denotes the risk value or the standard
deviation value and Y-axis denotes the expected rate of return from the portfolio. Portfolio M
is comprised of risky assets and the market. There is not any risk-free asset, which means that
the money can neither invested in nor borrowed. The characteristics of risk-return for the
potential portfolio of risk asset can be strategized to create Markowitz efficient frontier (Lee
and Su 2014). The line from where the risk-return touches to the Markowitz portfolio then it
is called a market portfolio. The point joining the Risk-free asset with the market portfolio
signifies Capital market line.
5FINANCIAL ACCOUNTING
(Capital Market Line)
The equation for CML is as:
The major difference between SML and CML
i. Both have different risk measure value as SML uses Beta value while CML uses
Standard Deviation value.
ii. SML represents a view of overall portfolios, whereas CML reflects only efficient
portfolios.
iii. The Y-axis values are different as SML represents the expected return of single
securities, whereas CML is for overall portfolios.
⊘ This is a preview!⊘
Do you want full access?
Subscribe today to unlock all pages.
Trusted by 1+ million students worldwide
6FINANCIAL ACCOUNTING
Importance of Minimum Variance Portfolios
A minimum Variance Portfolio reflects a well-diversified securities portfolio that
comes together to reduce the volatility in the price for the entire portfolio. The impulsiveness
in the investments is substitutable in terms with the market risk. Hence, the higher the
investment’s volatility, the higher will be the market risk. (Levy and Levy 2014) The
investor's willingness to minimize the risk also affect the minimizations of volatility.
Diversification
The modern portfolio theory supposed to minimize the risk that is related to the
portfolio of an asset, although maintaining the same returns. Investments that have relatively
low correlation can be stated as those that are not too similar or performing differently within
the similar market and economic environment. The focus is about ‘not to put all the eggs in
the single basket’. The diversification can result in a lower risk (Fragkiskos 2014). When an
stakeholder diversifies its portfolio, then they are basically looking for for less volatility, and
this is the base of minimum variance portfolio, which is a diversified portfolio of assets or
securities. Addition to this, the risk can be increased or decreased by adjusting the amount
that is allocated to individual security. It can be done through make certain that the securities
that have been selected have a lesser correlation (Dewandaru et al. 2017). This can be
explained as if the price of one security increases, then it is not possible to increase of other
security is within the same degree. This is the safe and secure effect of diversification.
Mean-Variance Efficient Frontier
The efficient frontier is the group of an investment portfolio that offers the maximum
expected return for a lowest risk for a well-defined level of expected return. In theoretical
terms, a portfolio of securities can be attained to the risk at lowest level for a stated level of
expected returns. As no other grouping of the securities, yield a minimum level of risk for the
Paraphrase This Document
Need a fresh take? Get an instant paraphrase of this document with our AI Paraphraser
7FINANCIAL ACCOUNTING
stated level of expected returns. This is a unique nature of the portfolio, which is also known
as mean-variance efficient. Portfolio existing below the efficient frontier is considered as sub-
optimal as it does not deliver sufficient return for the level of risk (Bodnar, Parolya and
Schmid 2018). Portfolios to the right of the efficient frontier have a high level of risk for a
specified rate of return.
A graphical representation of mean-variance efficient portfolios forms a curve. A
rational investor tends to invest that falls on the efficient frontier as it entails lower risk with
an expected rate of return (Simaan, Simaan and Tang 2018). Above the frontier will pride the
same level of return with higher risk. The frontier technique is essential for creating strategies
for investment, which is also known as the Minimum Variance Portfolio (MVP).
The formation of Minimum Variance Portfolio includes allocation of weightage of
several securities within portfolio so that to attain a lower level of risk. The optimization of
MVP technique helps to achieve an expected rate of return with an appropriate standard
deviation (Yao, Li and Chen 2014). The use of MVP is very useful in the creation of
investment fund and equity strategies and many other similar uses.
CAPM Relevance for Required Rate of Return
The above discussion of the theory of modern portfolio is somehow depended on a pillar of
expected return. Thus, it becomes essential to guess the expected returns acceptably and
accurately to an extent which is more challenging. There are several techniques which is
available to assess an expected rate of return. However, all give a result that is not accurate
and reliable. CAPM is one of the traditional method to estimate the expected rate of return.
The economists have formed this theory as an extension of Markowitz diversification theory.
Capital Asset Pricing Model (CAPM) is an important theory of financial management
that defines the connection amongst the expected return for stocks and systematic risk
8FINANCIAL ACCOUNTING
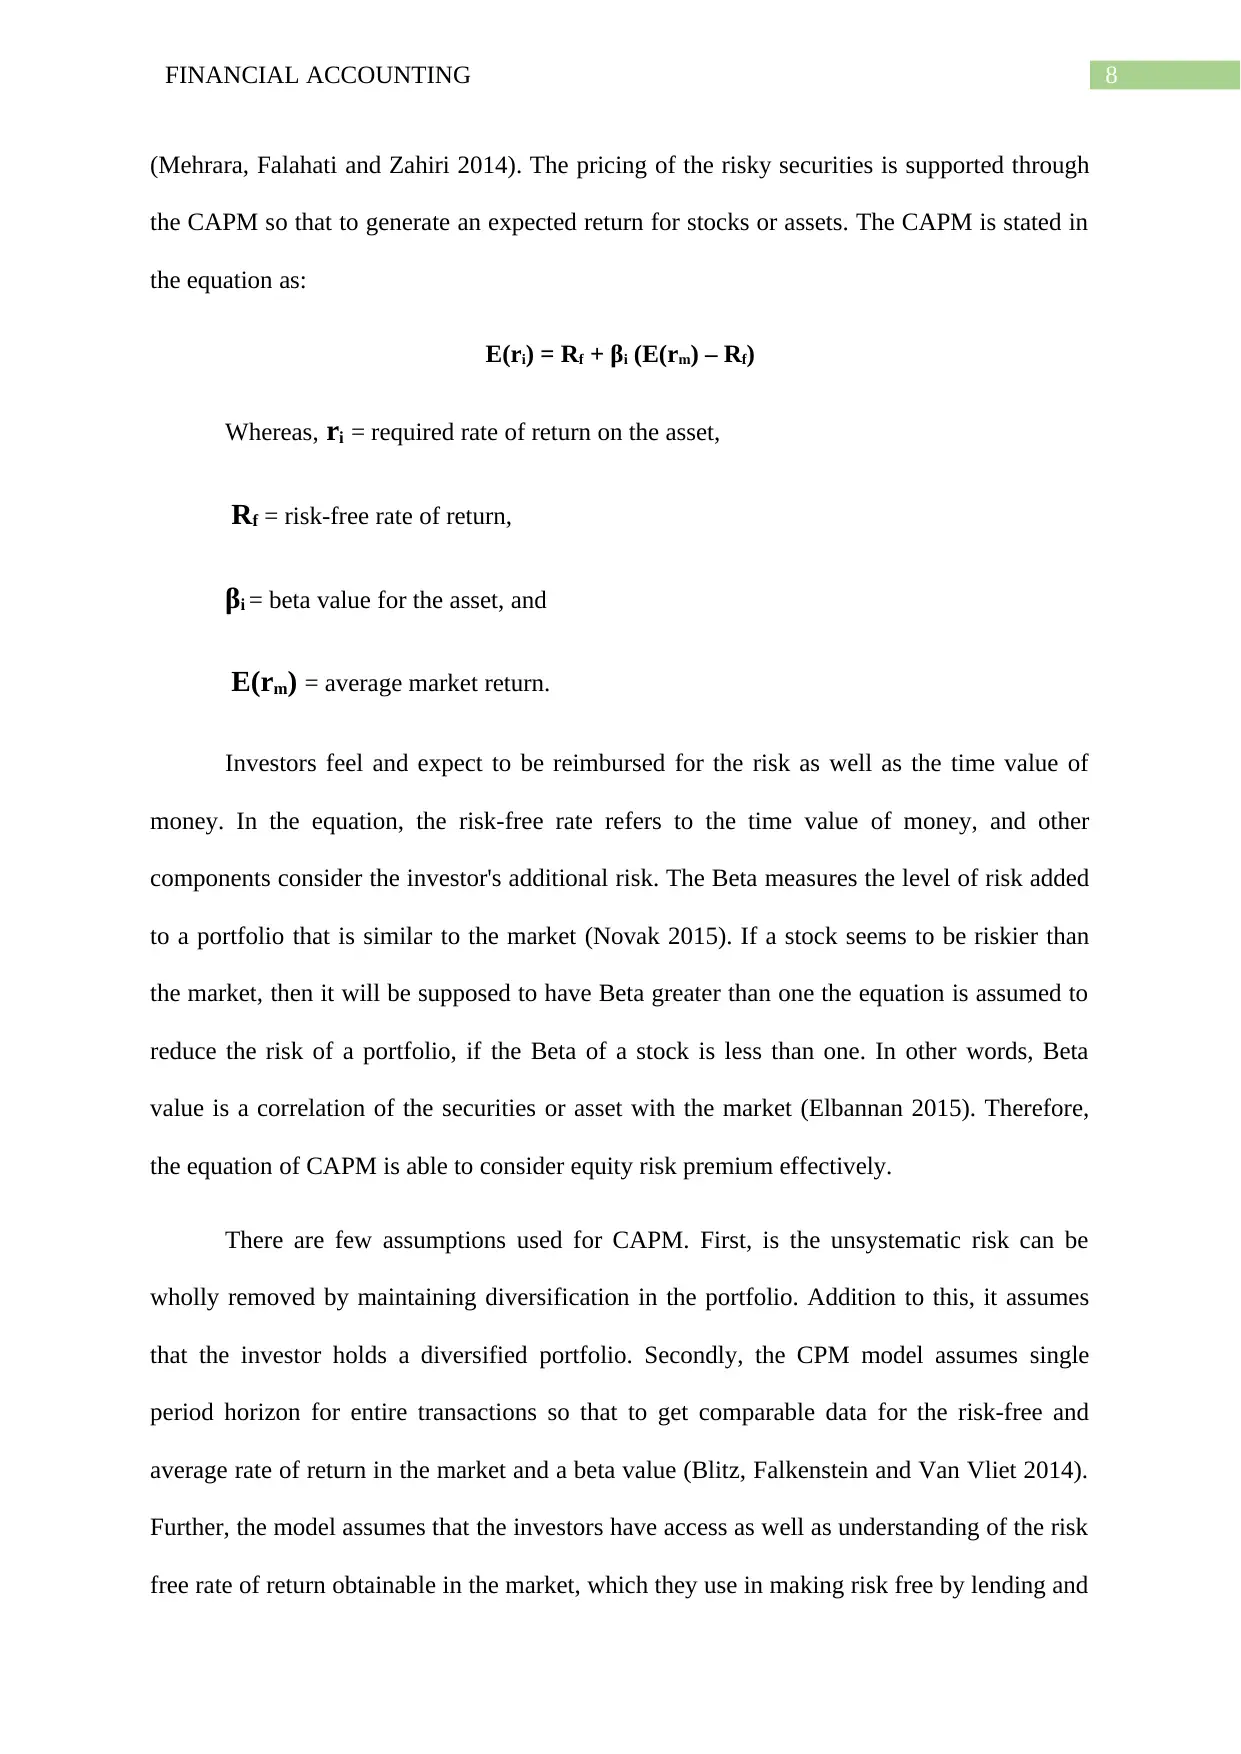
(Mehrara, Falahati and Zahiri 2014). The pricing of the risky securities is supported through
the CAPM so that to generate an expected return for stocks or assets. The CAPM is stated in
the equation as:
E(ri) = Rf + βi (E(rm) – Rf)
Whereas, ri = required rate of return on the asset,
Rf = risk-free rate of return,
βi = beta value for the asset, and
E(rm) = average market return.
Investors feel and expect to be reimbursed for the risk as well as the time value of
money. In the equation, the risk-free rate refers to the time value of money, and other
components consider the investor's additional risk. The Beta measures the level of risk added
to a portfolio that is similar to the market (Novak 2015). If a stock seems to be riskier than
the market, then it will be supposed to have Beta greater than one the equation is assumed to
reduce the risk of a portfolio, if the Beta of a stock is less than one. In other words, Beta
value is a correlation of the securities or asset with the market (Elbannan 2015). Therefore,
the equation of CAPM is able to consider equity risk premium effectively.
There are few assumptions used for CAPM. First, is the unsystematic risk can be
wholly removed by maintaining diversification in the portfolio. Addition to this, it assumes
that the investor holds a diversified portfolio. Secondly, the CPM model assumes single
period horizon for entire transactions so that to get comparable data for the risk-free and
average rate of return in the market and a beta value (Blitz, Falkenstein and Van Vliet 2014).
Further, the model assumes that the investors have access as well as understanding of the risk
free rate of return obtainable in the market, which they use in making risk free by lending and
⊘ This is a preview!⊘
Do you want full access?
Subscribe today to unlock all pages.
Trusted by 1+ million students worldwide
9FINANCIAL ACCOUNTING
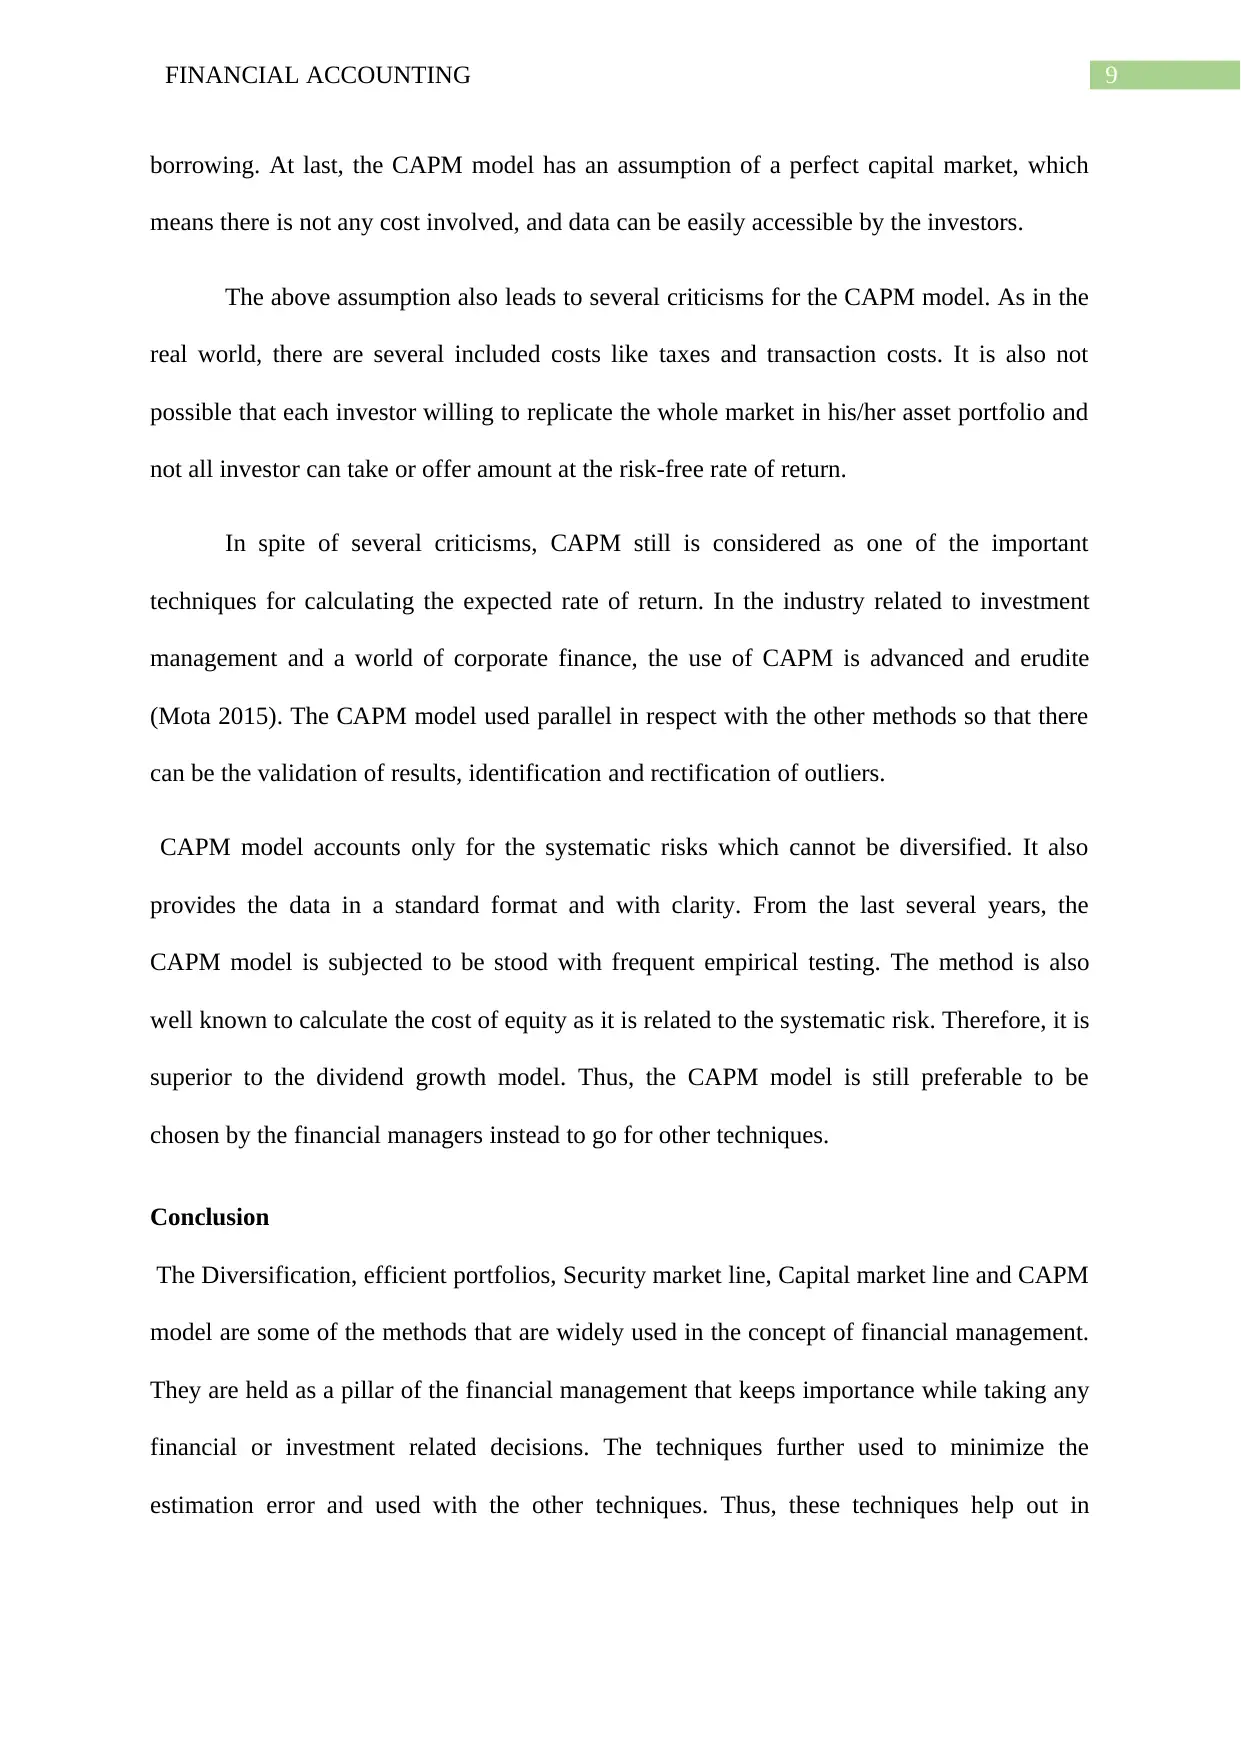
borrowing. At last, the CAPM model has an assumption of a perfect capital market, which
means there is not any cost involved, and data can be easily accessible by the investors.
The above assumption also leads to several criticisms for the CAPM model. As in the
real world, there are several included costs like taxes and transaction costs. It is also not
possible that each investor willing to replicate the whole market in his/her asset portfolio and
not all investor can take or offer amount at the risk-free rate of return.
In spite of several criticisms, CAPM still is considered as one of the important
techniques for calculating the expected rate of return. In the industry related to investment
management and a world of corporate finance, the use of CAPM is advanced and erudite
(Mota 2015). The CAPM model used parallel in respect with the other methods so that there
can be the validation of results, identification and rectification of outliers.
CAPM model accounts only for the systematic risks which cannot be diversified. It also
provides the data in a standard format and with clarity. From the last several years, the
CAPM model is subjected to be stood with frequent empirical testing. The method is also
well known to calculate the cost of equity as it is related to the systematic risk. Therefore, it is
superior to the dividend growth model. Thus, the CAPM model is still preferable to be
chosen by the financial managers instead to go for other techniques.
Conclusion
The Diversification, efficient portfolios, Security market line, Capital market line and CAPM
model are some of the methods that are widely used in the concept of financial management.
They are held as a pillar of the financial management that keeps importance while taking any
financial or investment related decisions. The techniques further used to minimize the
estimation error and used with the other techniques. Thus, these techniques help out in
Paraphrase This Document
Need a fresh take? Get an instant paraphrase of this document with our AI Paraphraser

10FINANCIAL ACCOUNTING
several situations such as difficulty regarding the investment-related decision and while
maintaining an efficient portfolio.
several situations such as difficulty regarding the investment-related decision and while
maintaining an efficient portfolio.
11FINANCIAL ACCOUNTING
References
Blitz, D., Falkenstein, E. and Van Vliet, P., 2014. Explanations for the volatility effect: An
overview based on the CAPM assumptions. The Journal of Portfolio Management, 40(3),
pp.61-76.
Bodnar, T., Parolya, N. and Schmid, W., 2018. Estimation of the global minimum variance
portfolio in high dimensions. European Journal of Operational Research, 266(1), pp.371-
390.
Chen, J.M., 2016. Modern portfolio theory. In Postmodern Portfolio Theory (pp. 5-25).
Palgrave Macmillan, New York.
De Giorgi, E.G., Post, T. and Yalçın, A., 2019. A concave security market line. Journal of
Banking & Finance, 106, pp.65-81.
Dewandaru, G., Masih, R., Bacha, O.I. and Masih, A.M.M., 2017. The role of Islamic asset
classes in the diversified portfolios: Mean variance spanning test. Emerging Markets
Review, 30, pp.66-95.
Elbannan, M.A., 2015. The capital asset pricing model: an overview of the
theory. International Journal of Economics and Finance, 7(1), pp.216-228.
Elterich, S., FMR LLC, 2014. Financial Account Management. U.S. Patent Application
14/164,558.
Fragkiskos, A., 2014. What is Portfolio Diversification?. Available at SSRN 2331475.
Ibbotson, R.G. and Kim, D.Y., 2014. Risk and return within the stock market: what works
best?. Working Paper, Zebra Capital.
⊘ This is a preview!⊘
Do you want full access?
Subscribe today to unlock all pages.
Trusted by 1+ million students worldwide
1 out of 13
Related Documents


Your All-in-One AI-Powered Toolkit for Academic Success.
+13062052269
info@desklib.com
Available 24*7 on WhatsApp / Email
![[object Object]](/_next/static/media/star-bottom.7253800d.svg)
Unlock your academic potential
Copyright © 2020–2026 A2Z Services. All Rights Reserved. Developed and managed by ZUCOL.