Financial Management Project: Portfolio Construction and Analysis
VerifiedAdded on 2022/12/22
|16
|3927
|1
Project
AI Summary
This financial management project focuses on constructing and analyzing a stock portfolio using three publicly traded stocks: General Mills, Johnson & Johnson, and Consolidated Edison. The analysis uses monthly data from June 2009 to June 2019 to calculate monthly rates of return, standard deviation, and variance for each stock. The selection criteria emphasized large-cap stocks with substantial market share and the potential to outperform their respective industries. The portfolio weights are assigned based on a risk-return basis, with 20% allocated to General Mills and 40% each to Johnson & Johnson and Consolidated Edison. The project includes calculations for portfolio mean monthly return, variance, and standard deviation, along with a correlation matrix. A normal distribution scenario is used to assess potential losses. The project also examines the impact of changing the stock weights on the portfolio's performance, providing a comprehensive overview of portfolio construction and risk management.

Running head: FINANCIAL MANAGEMENT
Financial Management
Name of the Student:
Name of the University:
Author’s Note:
Financial Management
Name of the Student:
Name of the University:
Author’s Note:
Paraphrase This Document
Need a fresh take? Get an instant paraphrase of this document with our AI Paraphraser

1FINANCIAL MANAGEMENT
Financial Management
Portfolio construction will be done with the help of the various stocks that are considered
best for the purpose of investment. The three publically traded stocks that were considered for
the purpose of investment will be the General Mills, Johnson & Johnson and Consolidated
Edison. The monthly data for the stocks from the period of 30th of June 2009 to 30th of June
2019. The monthly rate of return including the standard deviation and variance would be
calculated with the help of the excel functions. The above three stocks selected operates in a
different sector whereby the operations of the company is diversified and belongs to different
industry. The criteria for selecting the security was based on large cap stocks which had a
substantial market share and the industry in which the company operates is expected to
outperform the others.
Stocks Selected
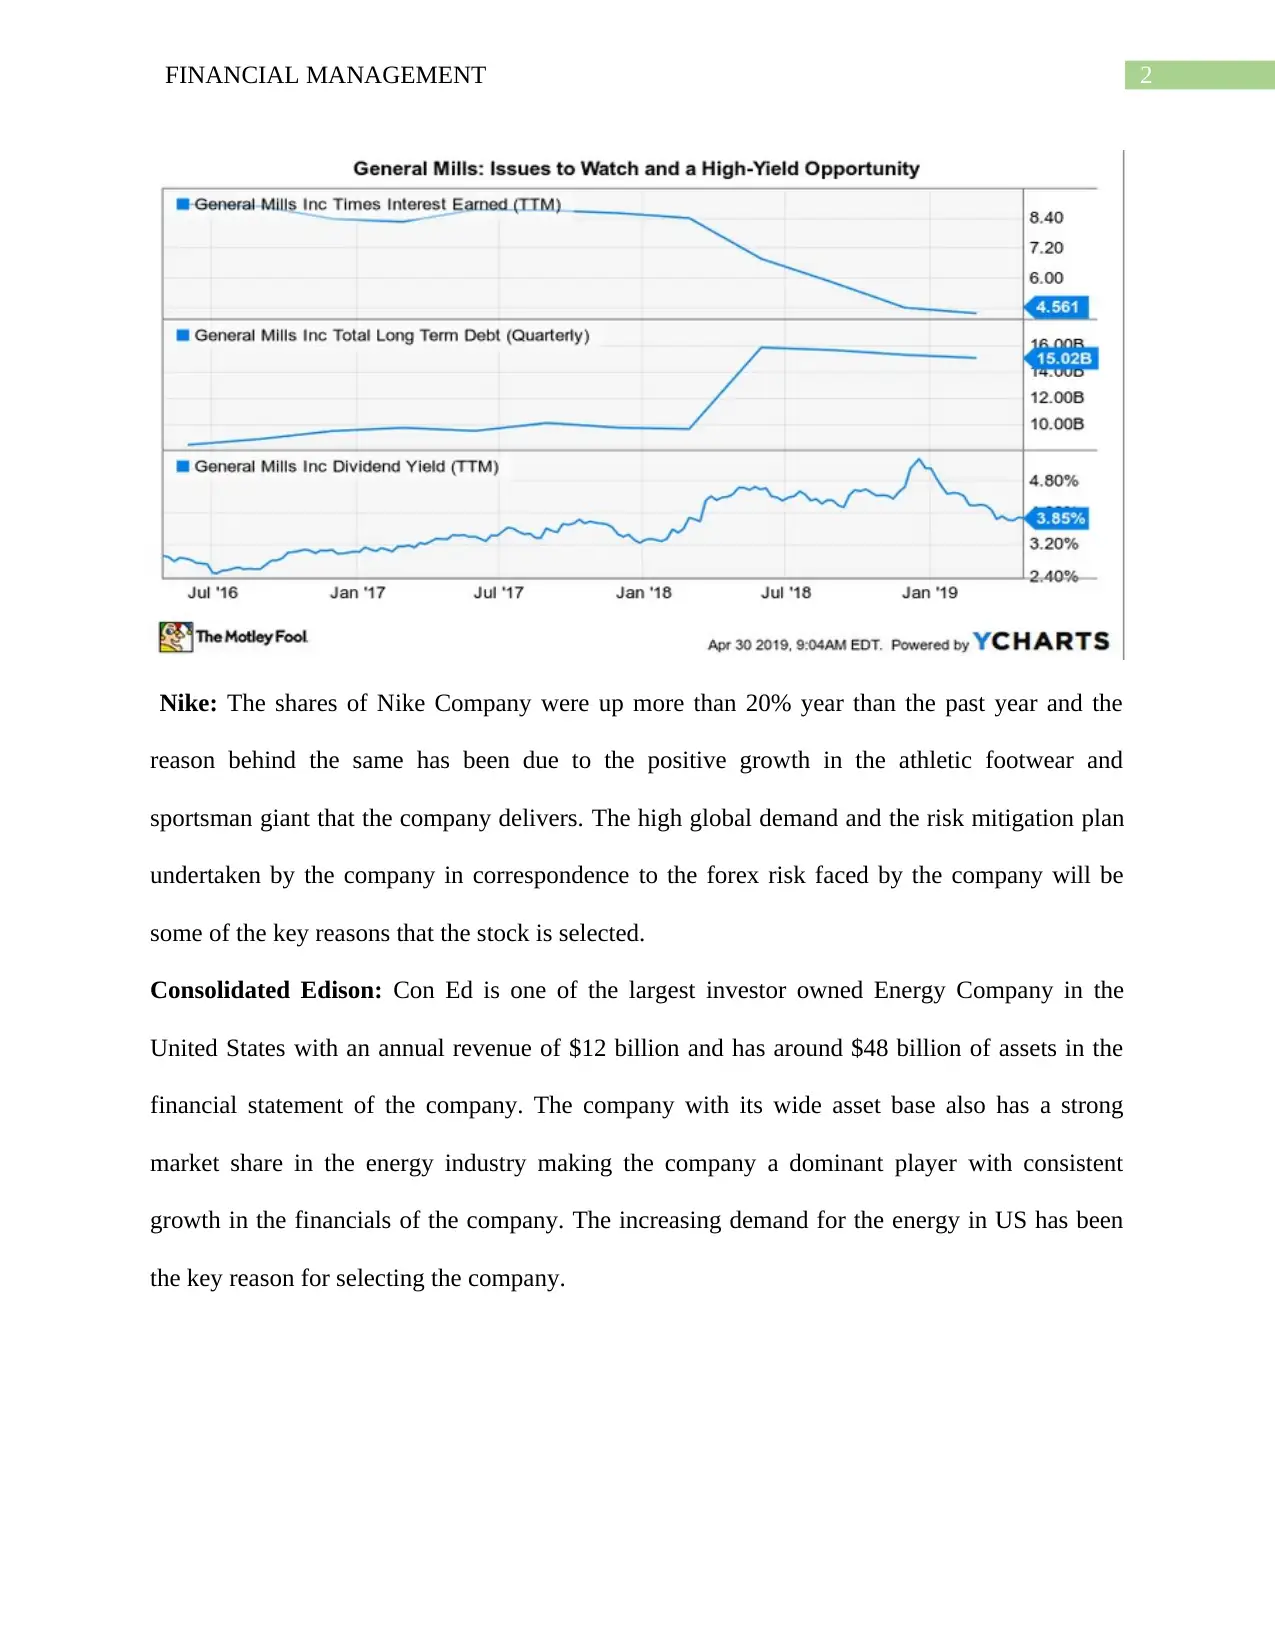
General Mills: The stock has around $30 billion of market cap where the company sells
packaged foods. The company has been a founder in the same industry with a long-track record
of the company in rewarding the investors or the stakeholders of the company.
Financial Management
Portfolio construction will be done with the help of the various stocks that are considered
best for the purpose of investment. The three publically traded stocks that were considered for
the purpose of investment will be the General Mills, Johnson & Johnson and Consolidated
Edison. The monthly data for the stocks from the period of 30th of June 2009 to 30th of June
2019. The monthly rate of return including the standard deviation and variance would be
calculated with the help of the excel functions. The above three stocks selected operates in a
different sector whereby the operations of the company is diversified and belongs to different
industry. The criteria for selecting the security was based on large cap stocks which had a
substantial market share and the industry in which the company operates is expected to
outperform the others.
Stocks Selected
General Mills: The stock has around $30 billion of market cap where the company sells
packaged foods. The company has been a founder in the same industry with a long-track record
of the company in rewarding the investors or the stakeholders of the company.
2FINANCIAL MANAGEMENT
Nike: The shares of Nike Company were up more than 20% year than the past year and the
reason behind the same has been due to the positive growth in the athletic footwear and
sportsman giant that the company delivers. The high global demand and the risk mitigation plan
undertaken by the company in correspondence to the forex risk faced by the company will be
some of the key reasons that the stock is selected.
Consolidated Edison: Con Ed is one of the largest investor owned Energy Company in the
United States with an annual revenue of $12 billion and has around $48 billion of assets in the
financial statement of the company. The company with its wide asset base also has a strong
market share in the energy industry making the company a dominant player with consistent
growth in the financials of the company. The increasing demand for the energy in US has been
the key reason for selecting the company.
⊘ This is a preview!⊘
Do you want full access?
Subscribe today to unlock all pages.
Trusted by 1+ million students worldwide
3FINANCIAL MANAGEMENT
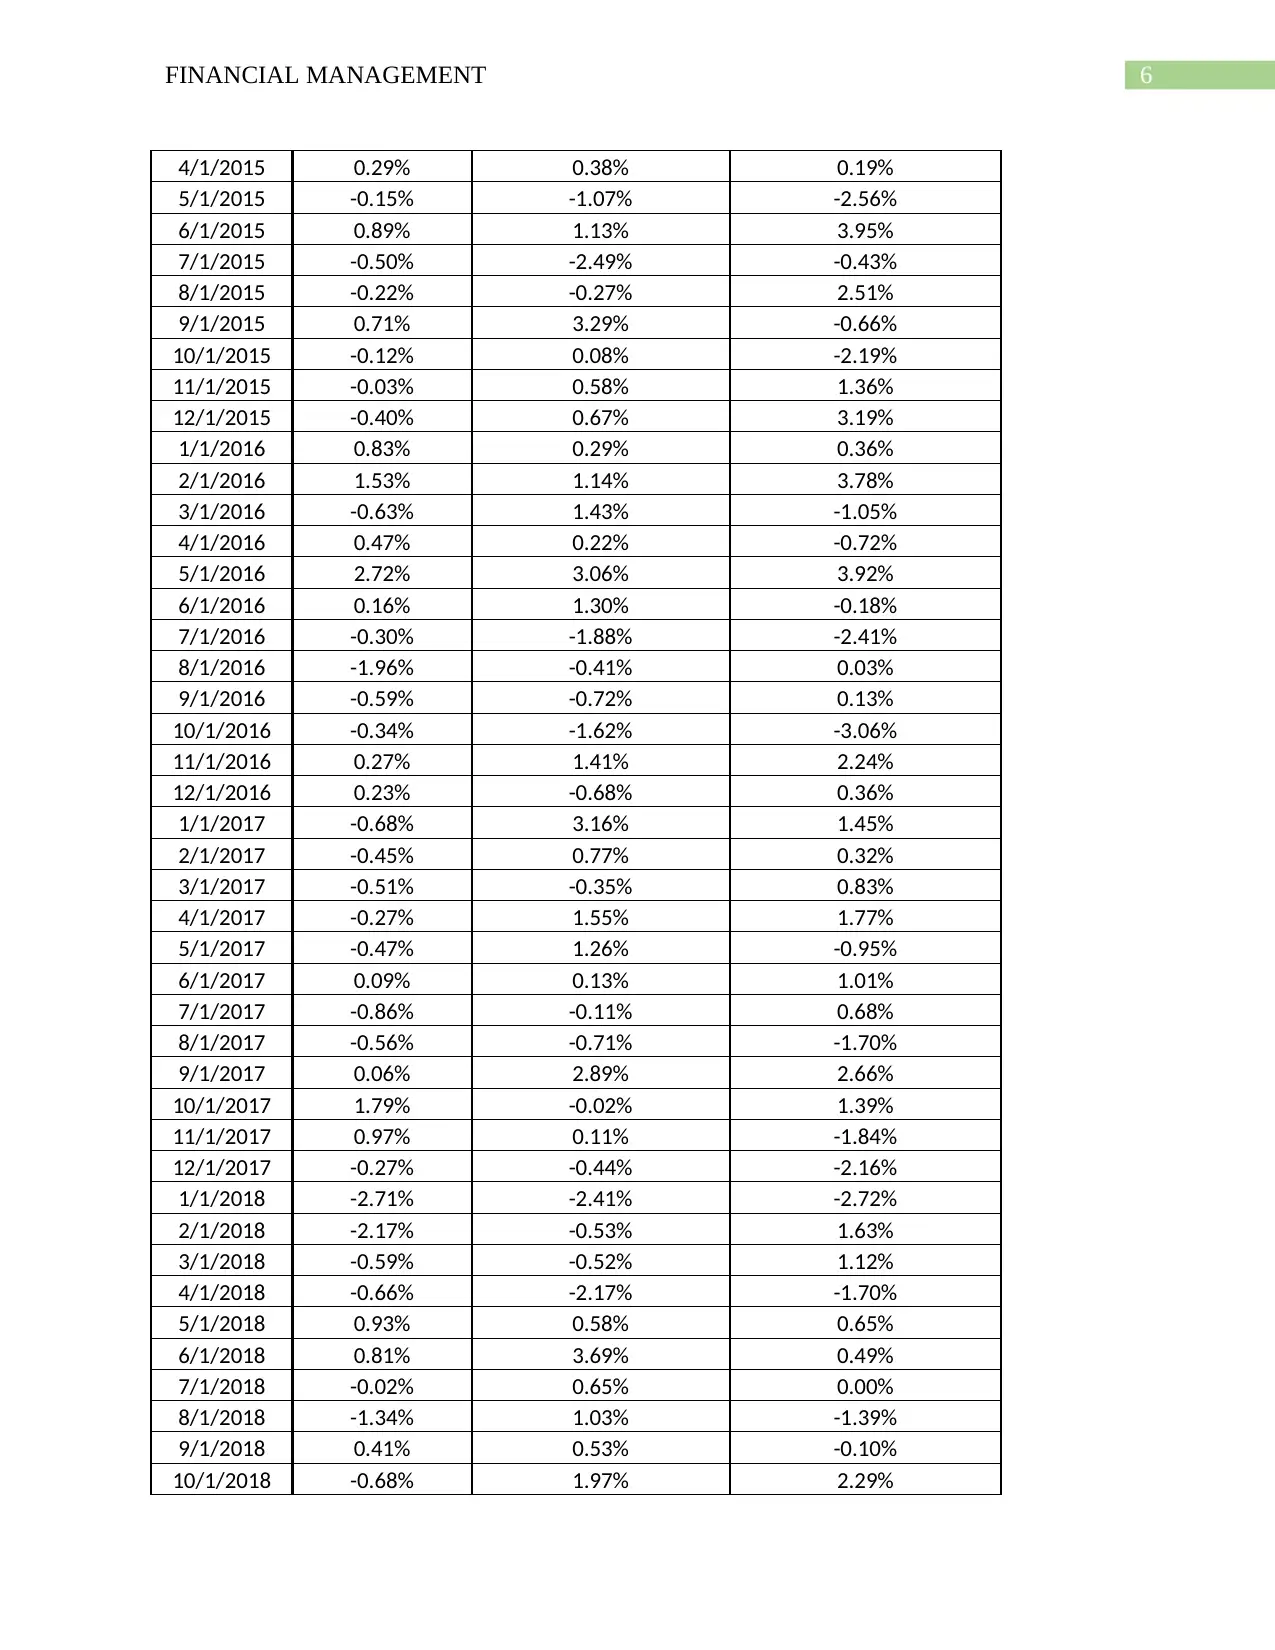
Monthly Data
The monthly data for the stocks from the period of 30th of June 2009 to 30th of June 2019.
The monthly rate of return including the standard deviation and variance would be calculated
with the help of the excel functions.
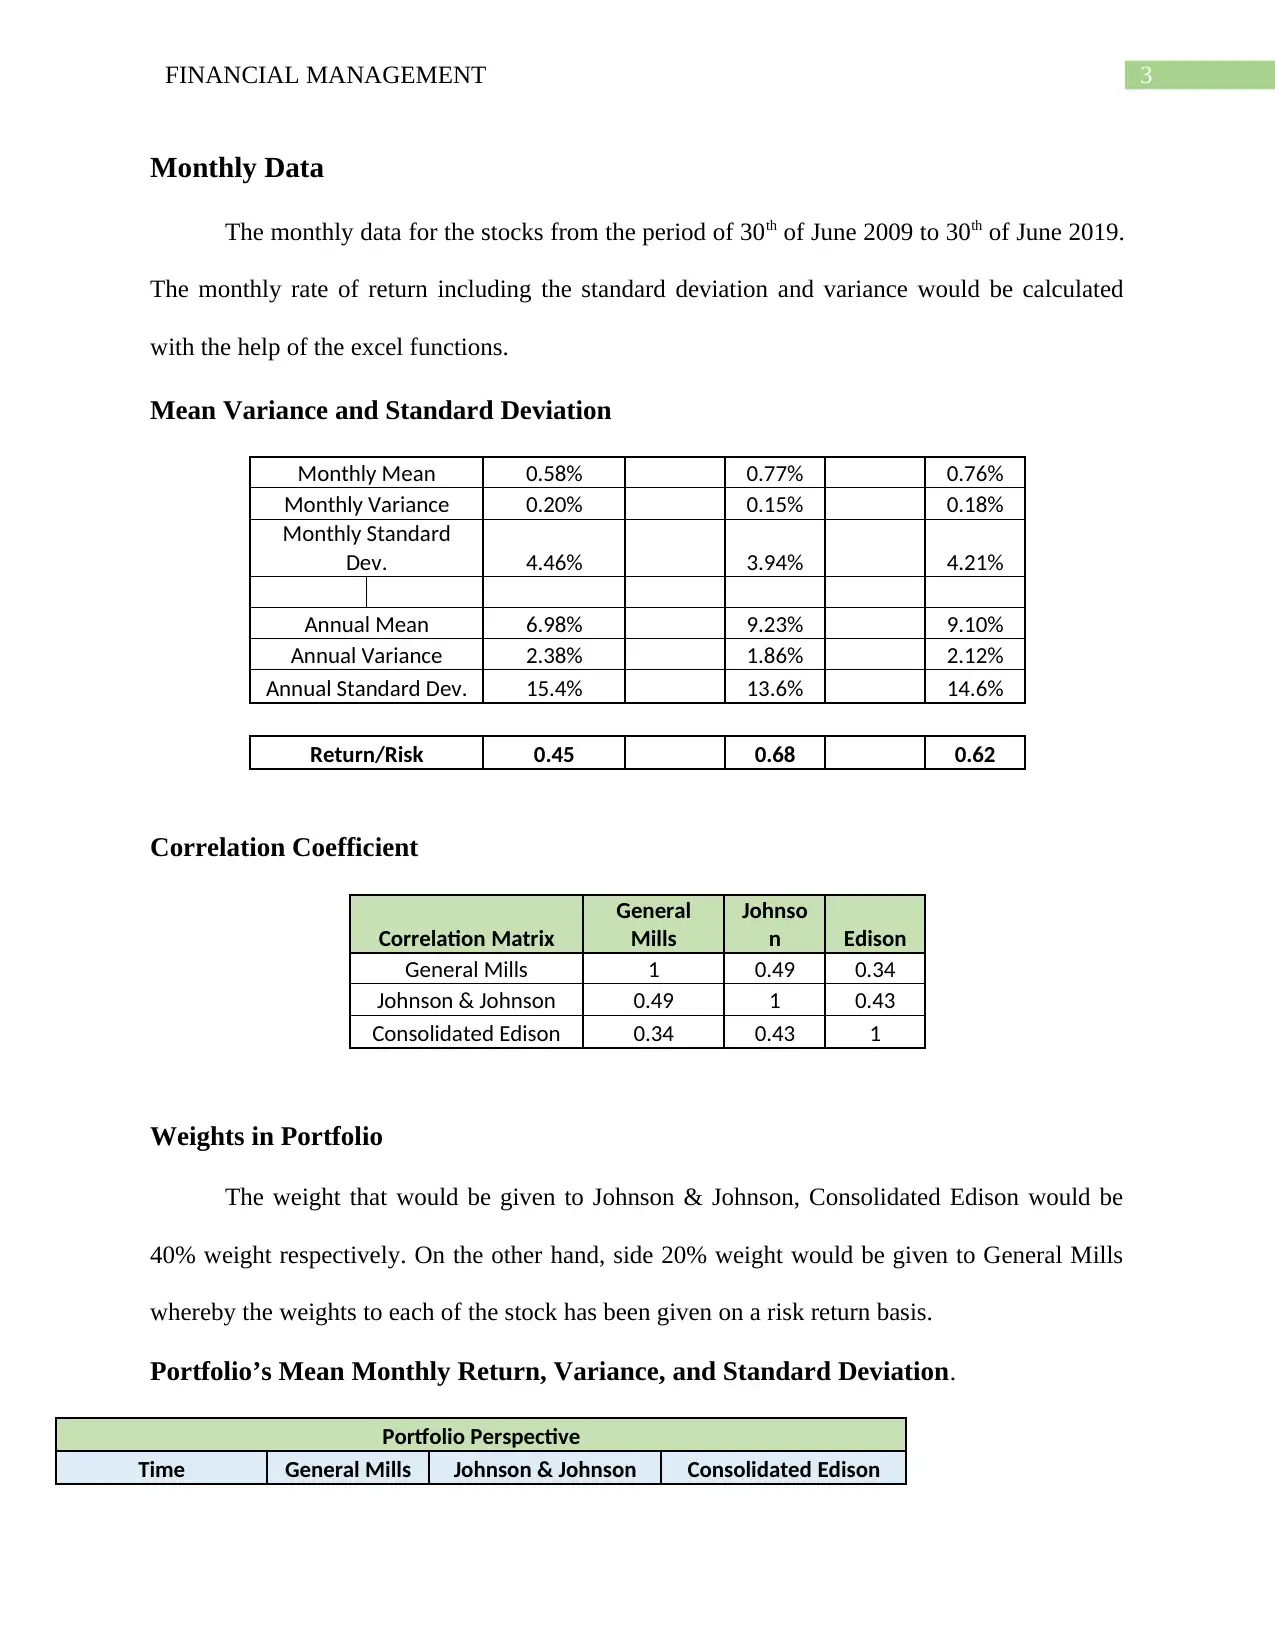
Mean Variance and Standard Deviation
Monthly Mean 0.58% 0.77% 0.76%
Monthly Variance 0.20% 0.15% 0.18%
Monthly Standard
Dev. 4.46% 3.94% 4.21%
Annual Mean 6.98% 9.23% 9.10%
Annual Variance 2.38% 1.86% 2.12%
Annual Standard Dev. 15.4% 13.6% 14.6%
Return/Risk 0.45 0.68 0.62
Correlation Coefficient
Correlation Matrix
General
Mills
Johnso
n Edison
General Mills 1 0.49 0.34
Johnson & Johnson 0.49 1 0.43
Consolidated Edison 0.34 0.43 1
Weights in Portfolio
The weight that would be given to Johnson & Johnson, Consolidated Edison would be
40% weight respectively. On the other hand, side 20% weight would be given to General Mills
whereby the weights to each of the stock has been given on a risk return basis.
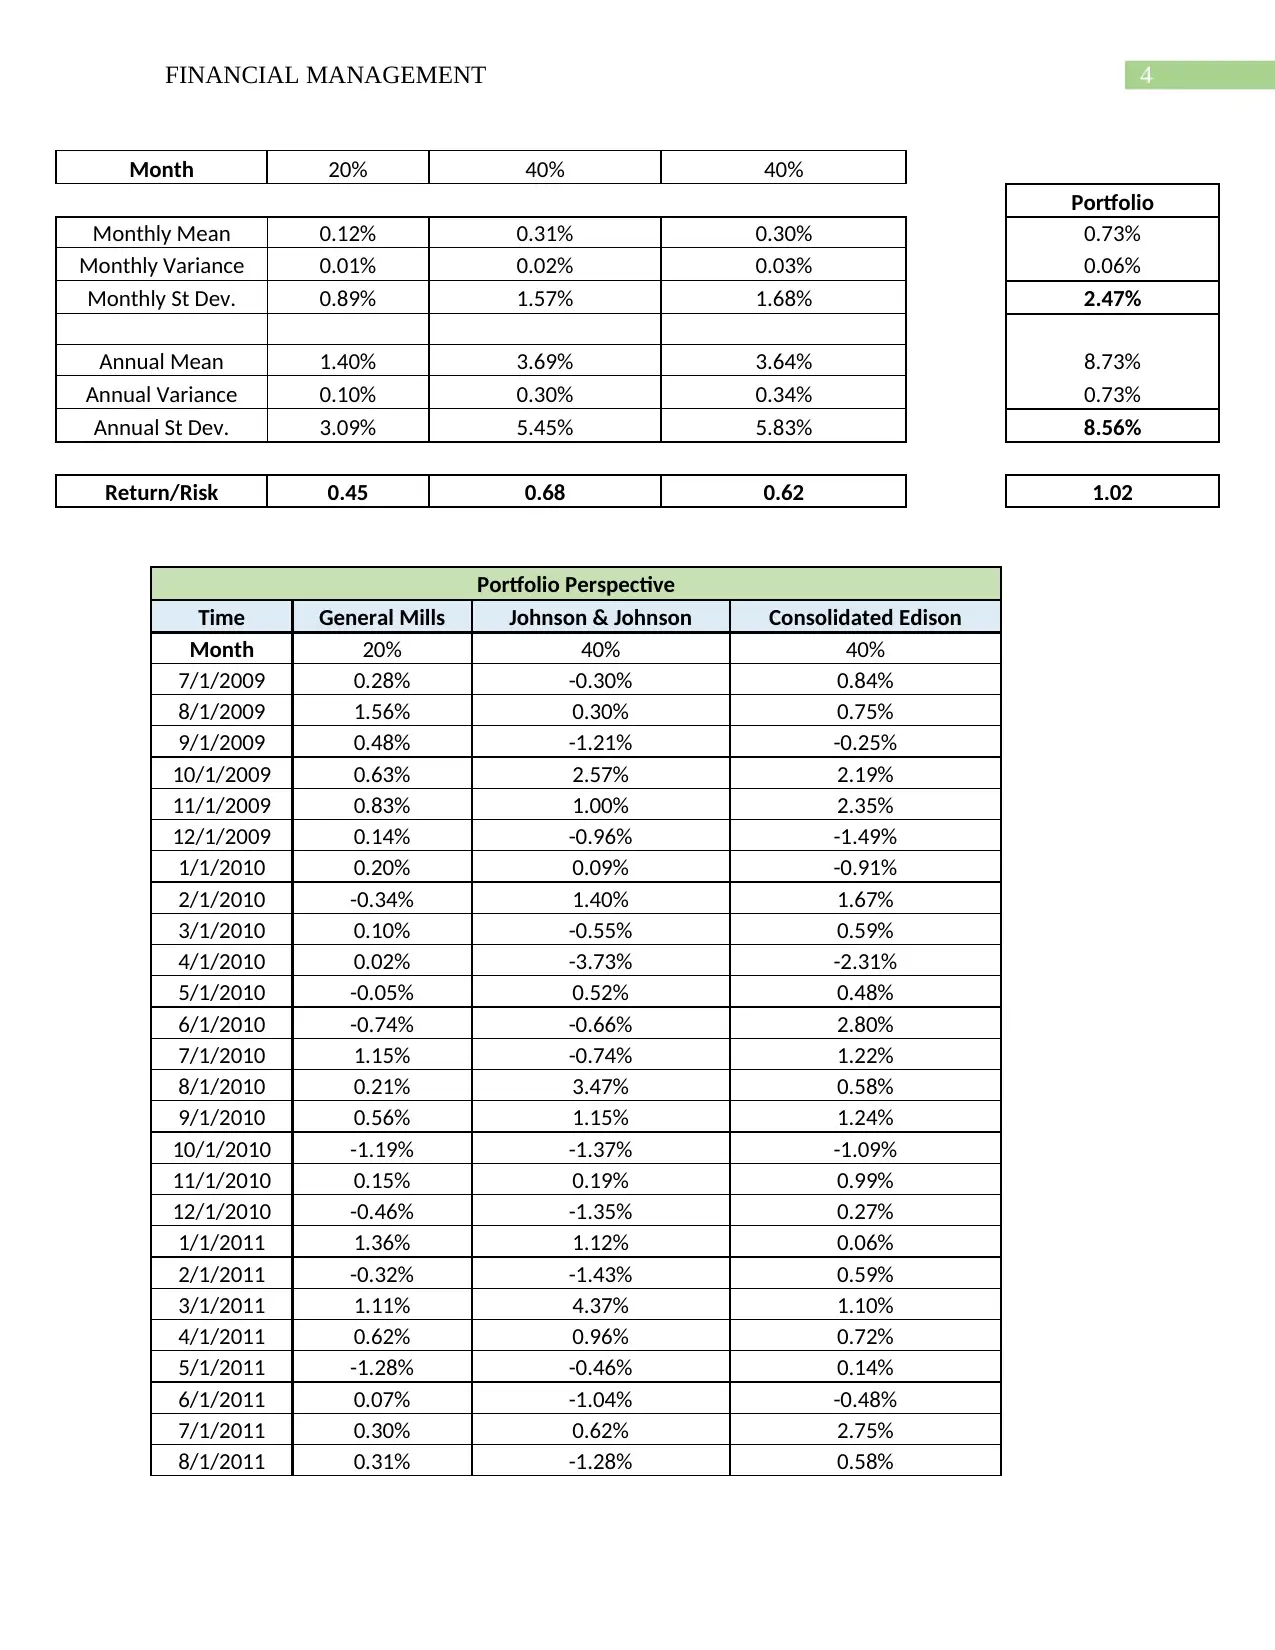
Portfolio’s Mean Monthly Return, Variance, and Standard Deviation.
Portfolio Perspective
Time General Mills Johnson & Johnson Consolidated Edison
Monthly Data
The monthly data for the stocks from the period of 30th of June 2009 to 30th of June 2019.
The monthly rate of return including the standard deviation and variance would be calculated
with the help of the excel functions.
Mean Variance and Standard Deviation
Monthly Mean 0.58% 0.77% 0.76%
Monthly Variance 0.20% 0.15% 0.18%
Monthly Standard
Dev. 4.46% 3.94% 4.21%
Annual Mean 6.98% 9.23% 9.10%
Annual Variance 2.38% 1.86% 2.12%
Annual Standard Dev. 15.4% 13.6% 14.6%
Return/Risk 0.45 0.68 0.62
Correlation Coefficient
Correlation Matrix
General
Mills
Johnso
n Edison
General Mills 1 0.49 0.34
Johnson & Johnson 0.49 1 0.43
Consolidated Edison 0.34 0.43 1
Weights in Portfolio
The weight that would be given to Johnson & Johnson, Consolidated Edison would be
40% weight respectively. On the other hand, side 20% weight would be given to General Mills
whereby the weights to each of the stock has been given on a risk return basis.
Portfolio’s Mean Monthly Return, Variance, and Standard Deviation.
Portfolio Perspective
Time General Mills Johnson & Johnson Consolidated Edison
Paraphrase This Document
Need a fresh take? Get an instant paraphrase of this document with our AI Paraphraser
4FINANCIAL MANAGEMENT
Month 20% 40% 40%
Portfolio
Monthly Mean 0.12% 0.31% 0.30% 0.73%
Monthly Variance 0.01% 0.02% 0.03% 0.06%
Monthly St Dev. 0.89% 1.57% 1.68% 2.47%
Annual Mean 1.40% 3.69% 3.64% 8.73%
Annual Variance 0.10% 0.30% 0.34% 0.73%
Annual St Dev. 3.09% 5.45% 5.83% 8.56%
Return/Risk 0.45 0.68 0.62 1.02
Portfolio Perspective
Time General Mills Johnson & Johnson Consolidated Edison
Month 20% 40% 40%
7/1/2009 0.28% -0.30% 0.84%
8/1/2009 1.56% 0.30% 0.75%
9/1/2009 0.48% -1.21% -0.25%
10/1/2009 0.63% 2.57% 2.19%
11/1/2009 0.83% 1.00% 2.35%
12/1/2009 0.14% -0.96% -1.49%
1/1/2010 0.20% 0.09% -0.91%
2/1/2010 -0.34% 1.40% 1.67%
3/1/2010 0.10% -0.55% 0.59%
4/1/2010 0.02% -3.73% -2.31%
5/1/2010 -0.05% 0.52% 0.48%
6/1/2010 -0.74% -0.66% 2.80%
7/1/2010 1.15% -0.74% 1.22%
8/1/2010 0.21% 3.47% 0.58%
9/1/2010 0.56% 1.15% 1.24%
10/1/2010 -1.19% -1.37% -1.09%
11/1/2010 0.15% 0.19% 0.99%
12/1/2010 -0.46% -1.35% 0.27%
1/1/2011 1.36% 1.12% 0.06%
2/1/2011 -0.32% -1.43% 0.59%
3/1/2011 1.11% 4.37% 1.10%
4/1/2011 0.62% 0.96% 0.72%
5/1/2011 -1.28% -0.46% 0.14%
6/1/2011 0.07% -1.04% -0.48%
7/1/2011 0.30% 0.62% 2.75%
8/1/2011 0.31% -1.28% 0.58%
Month 20% 40% 40%
Portfolio
Monthly Mean 0.12% 0.31% 0.30% 0.73%
Monthly Variance 0.01% 0.02% 0.03% 0.06%
Monthly St Dev. 0.89% 1.57% 1.68% 2.47%
Annual Mean 1.40% 3.69% 3.64% 8.73%
Annual Variance 0.10% 0.30% 0.34% 0.73%
Annual St Dev. 3.09% 5.45% 5.83% 8.56%
Return/Risk 0.45 0.68 0.62 1.02
Portfolio Perspective
Time General Mills Johnson & Johnson Consolidated Edison
Month 20% 40% 40%
7/1/2009 0.28% -0.30% 0.84%
8/1/2009 1.56% 0.30% 0.75%
9/1/2009 0.48% -1.21% -0.25%
10/1/2009 0.63% 2.57% 2.19%
11/1/2009 0.83% 1.00% 2.35%
12/1/2009 0.14% -0.96% -1.49%
1/1/2010 0.20% 0.09% -0.91%
2/1/2010 -0.34% 1.40% 1.67%
3/1/2010 0.10% -0.55% 0.59%
4/1/2010 0.02% -3.73% -2.31%
5/1/2010 -0.05% 0.52% 0.48%
6/1/2010 -0.74% -0.66% 2.80%
7/1/2010 1.15% -0.74% 1.22%
8/1/2010 0.21% 3.47% 0.58%
9/1/2010 0.56% 1.15% 1.24%
10/1/2010 -1.19% -1.37% -1.09%
11/1/2010 0.15% 0.19% 0.99%
12/1/2010 -0.46% -1.35% 0.27%
1/1/2011 1.36% 1.12% 0.06%
2/1/2011 -0.32% -1.43% 0.59%
3/1/2011 1.11% 4.37% 1.10%
4/1/2011 0.62% 0.96% 0.72%
5/1/2011 -1.28% -0.46% 0.14%
6/1/2011 0.07% -1.04% -0.48%
7/1/2011 0.30% 0.62% 2.75%
8/1/2011 0.31% -1.28% 0.58%
5FINANCIAL MANAGEMENT
9/1/2011 0.02% 0.44% 0.60%
10/1/2011 0.74% 0.21% 1.07%
11/1/2011 0.23% 0.53% 1.76%
12/1/2011 -0.29% 0.20% -1.98%
1/1/2012 -0.76% -0.50% -0.58%
2/1/2012 0.60% 0.54% 0.22%
3/1/2012 -0.28% -0.52% 0.71%
4/1/2012 -0.31% -1.64% 0.61%
5/1/2012 0.14% 3.29% 1.21%
6/1/2012 0.08% 0.98% 1.49%
7/1/2012 0.33% -1.03% -2.41%
8/1/2012 0.26% 0.88% -0.48%
9/1/2012 0.12% 1.11% 0.33%
10/1/2012 0.45% -0.62% -3.04%
11/1/2012 -0.28% 0.21% -0.18%
12/1/2012 0.75% 2.18% 0.97%
1/1/2013 2.06% 1.19% 1.49%
2/1/2013 1.32% 2.85% 1.38%
3/1/2013 0.45% 1.82% 1.72%
4/1/2013 -1.32% -0.49% -4.14%
5/1/2013 0.62% 0.80% 0.87%
6/1/2013 1.43% 3.56% 1.09%
7/1/2013 -1.03% -3.03% -2.45%
8/1/2013 -0.57% 0.13% -0.78%
9/1/2013 1.04% 2.73% 2.23%
10/1/2013 0.00% 0.89% -2.07%
11/1/2013 -0.21% -1.30% 0.05%
12/1/2013 -0.76% -1.36% -0.63%
1/1/2014 0.84% 1.65% 1.21%
2/1/2014 0.72% 2.65% -1.71%
3/1/2014 0.46% 1.25% 3.27%
4/1/2014 0.72% 0.07% -2.08%
5/1/2014 -0.87% 1.25% 1.99%
6/1/2014 -0.91% -1.73% -1.14%
7/1/2014 1.29% 1.45% 1.28%
8/1/2014 -1.10% 1.10% -0.85%
9/1/2014 0.60% 0.45% 4.73%
10/1/2014 0.30% 0.17% -0.13%
11/1/2014 0.22% -1.36% 1.81%
12/1/2014 -0.32% -1.69% 1.98%
1/1/2015 0.50% 0.95% -3.55%
2/1/2015 1.04% -0.75% -1.36%
3/1/2015 -0.45% -0.56% 0.36%
⊘ This is a preview!⊘
Do you want full access?
Subscribe today to unlock all pages.
Trusted by 1+ million students worldwide
6FINANCIAL MANAGEMENT
4/1/2015 0.29% 0.38% 0.19%
5/1/2015 -0.15% -1.07% -2.56%
6/1/2015 0.89% 1.13% 3.95%
7/1/2015 -0.50% -2.49% -0.43%
8/1/2015 -0.22% -0.27% 2.51%
9/1/2015 0.71% 3.29% -0.66%
10/1/2015 -0.12% 0.08% -2.19%
11/1/2015 -0.03% 0.58% 1.36%
12/1/2015 -0.40% 0.67% 3.19%
1/1/2016 0.83% 0.29% 0.36%
2/1/2016 1.53% 1.14% 3.78%
3/1/2016 -0.63% 1.43% -1.05%
4/1/2016 0.47% 0.22% -0.72%
5/1/2016 2.72% 3.06% 3.92%
6/1/2016 0.16% 1.30% -0.18%
7/1/2016 -0.30% -1.88% -2.41%
8/1/2016 -1.96% -0.41% 0.03%
9/1/2016 -0.59% -0.72% 0.13%
10/1/2016 -0.34% -1.62% -3.06%
11/1/2016 0.27% 1.41% 2.24%
12/1/2016 0.23% -0.68% 0.36%
1/1/2017 -0.68% 3.16% 1.45%
2/1/2017 -0.45% 0.77% 0.32%
3/1/2017 -0.51% -0.35% 0.83%
4/1/2017 -0.27% 1.55% 1.77%
5/1/2017 -0.47% 1.26% -0.95%
6/1/2017 0.09% 0.13% 1.01%
7/1/2017 -0.86% -0.11% 0.68%
8/1/2017 -0.56% -0.71% -1.70%
9/1/2017 0.06% 2.89% 2.66%
10/1/2017 1.79% -0.02% 1.39%
11/1/2017 0.97% 0.11% -1.84%
12/1/2017 -0.27% -0.44% -2.16%
1/1/2018 -2.71% -2.41% -2.72%
2/1/2018 -2.17% -0.53% 1.63%
3/1/2018 -0.59% -0.52% 1.12%
4/1/2018 -0.66% -2.17% -1.70%
5/1/2018 0.93% 0.58% 0.65%
6/1/2018 0.81% 3.69% 0.49%
7/1/2018 -0.02% 0.65% 0.00%
8/1/2018 -1.34% 1.03% -1.39%
9/1/2018 0.41% 0.53% -0.10%
10/1/2018 -0.68% 1.97% 2.29%
Paraphrase This Document
Need a fresh take? Get an instant paraphrase of this document with our AI Paraphraser
7FINANCIAL MANAGEMENT
11/1/2018 -1.59% -4.86% -1.94%
12/1/2018 2.82% 1.25% 0.62%
1/1/2019 1.21% 1.07% 2.47%
2/1/2019 1.96% 0.92% 1.14%
3/1/2019 -0.11% 0.40% 0.64%
4/1/2019 -0.79% -2.85% 0.06%
5/1/2019 1.25% 2.48% 0.64%
6/1/2019 0.00% 0.00% 0.00%
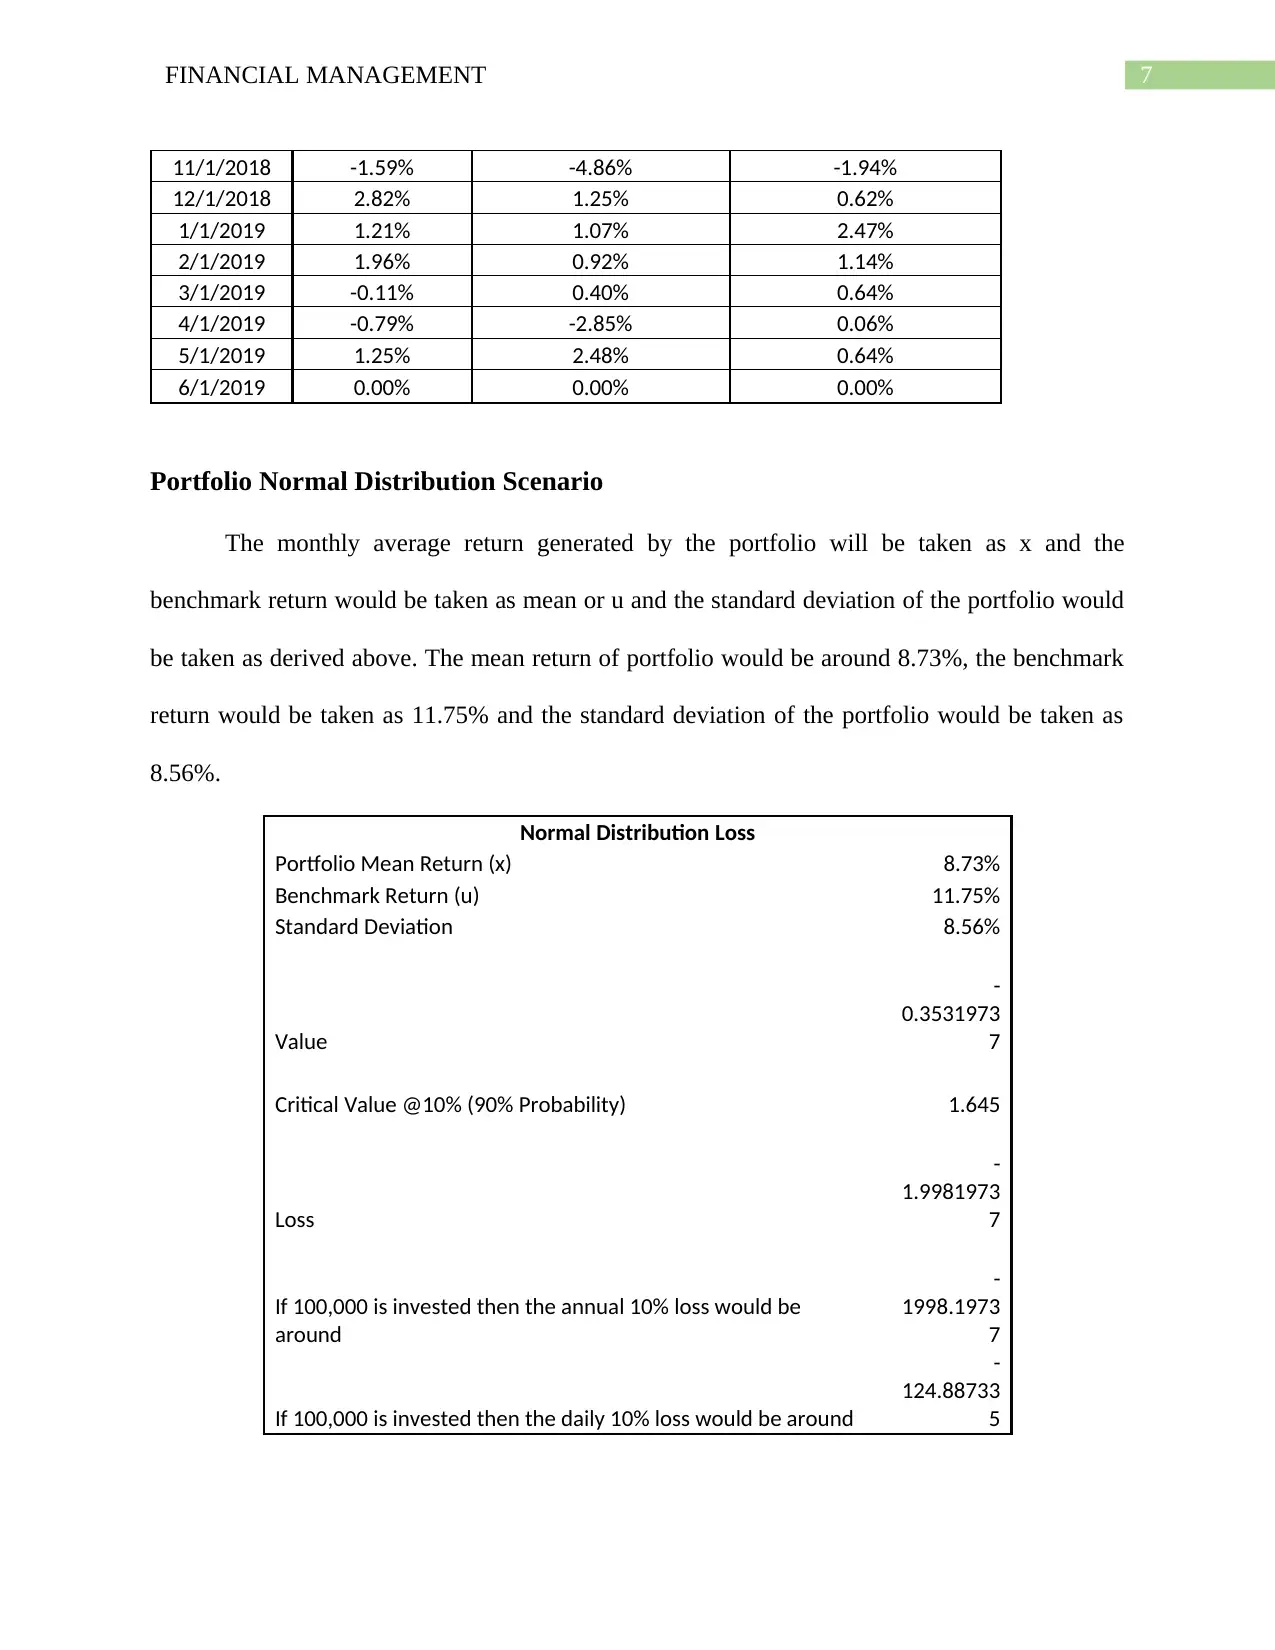
Portfolio Normal Distribution Scenario
The monthly average return generated by the portfolio will be taken as x and the
benchmark return would be taken as mean or u and the standard deviation of the portfolio would
be taken as derived above. The mean return of portfolio would be around 8.73%, the benchmark
return would be taken as 11.75% and the standard deviation of the portfolio would be taken as
8.56%.
Normal Distribution Loss
Portfolio Mean Return (x) 8.73%
Benchmark Return (u) 11.75%
Standard Deviation 8.56%
Value
-
0.3531973
7
Critical Value @10% (90% Probability) 1.645
Loss
-
1.9981973
7
If 100,000 is invested then the annual 10% loss would be
around
-
1998.1973
7
If 100,000 is invested then the daily 10% loss would be around
-
124.88733
5
11/1/2018 -1.59% -4.86% -1.94%
12/1/2018 2.82% 1.25% 0.62%
1/1/2019 1.21% 1.07% 2.47%
2/1/2019 1.96% 0.92% 1.14%
3/1/2019 -0.11% 0.40% 0.64%
4/1/2019 -0.79% -2.85% 0.06%
5/1/2019 1.25% 2.48% 0.64%
6/1/2019 0.00% 0.00% 0.00%
Portfolio Normal Distribution Scenario
The monthly average return generated by the portfolio will be taken as x and the
benchmark return would be taken as mean or u and the standard deviation of the portfolio would
be taken as derived above. The mean return of portfolio would be around 8.73%, the benchmark
return would be taken as 11.75% and the standard deviation of the portfolio would be taken as
8.56%.
Normal Distribution Loss
Portfolio Mean Return (x) 8.73%
Benchmark Return (u) 11.75%
Standard Deviation 8.56%
Value
-
0.3531973
7
Critical Value @10% (90% Probability) 1.645
Loss
-
1.9981973
7
If 100,000 is invested then the annual 10% loss would be
around
-
1998.1973
7
If 100,000 is invested then the daily 10% loss would be around
-
124.88733
5
8FINANCIAL MANAGEMENT
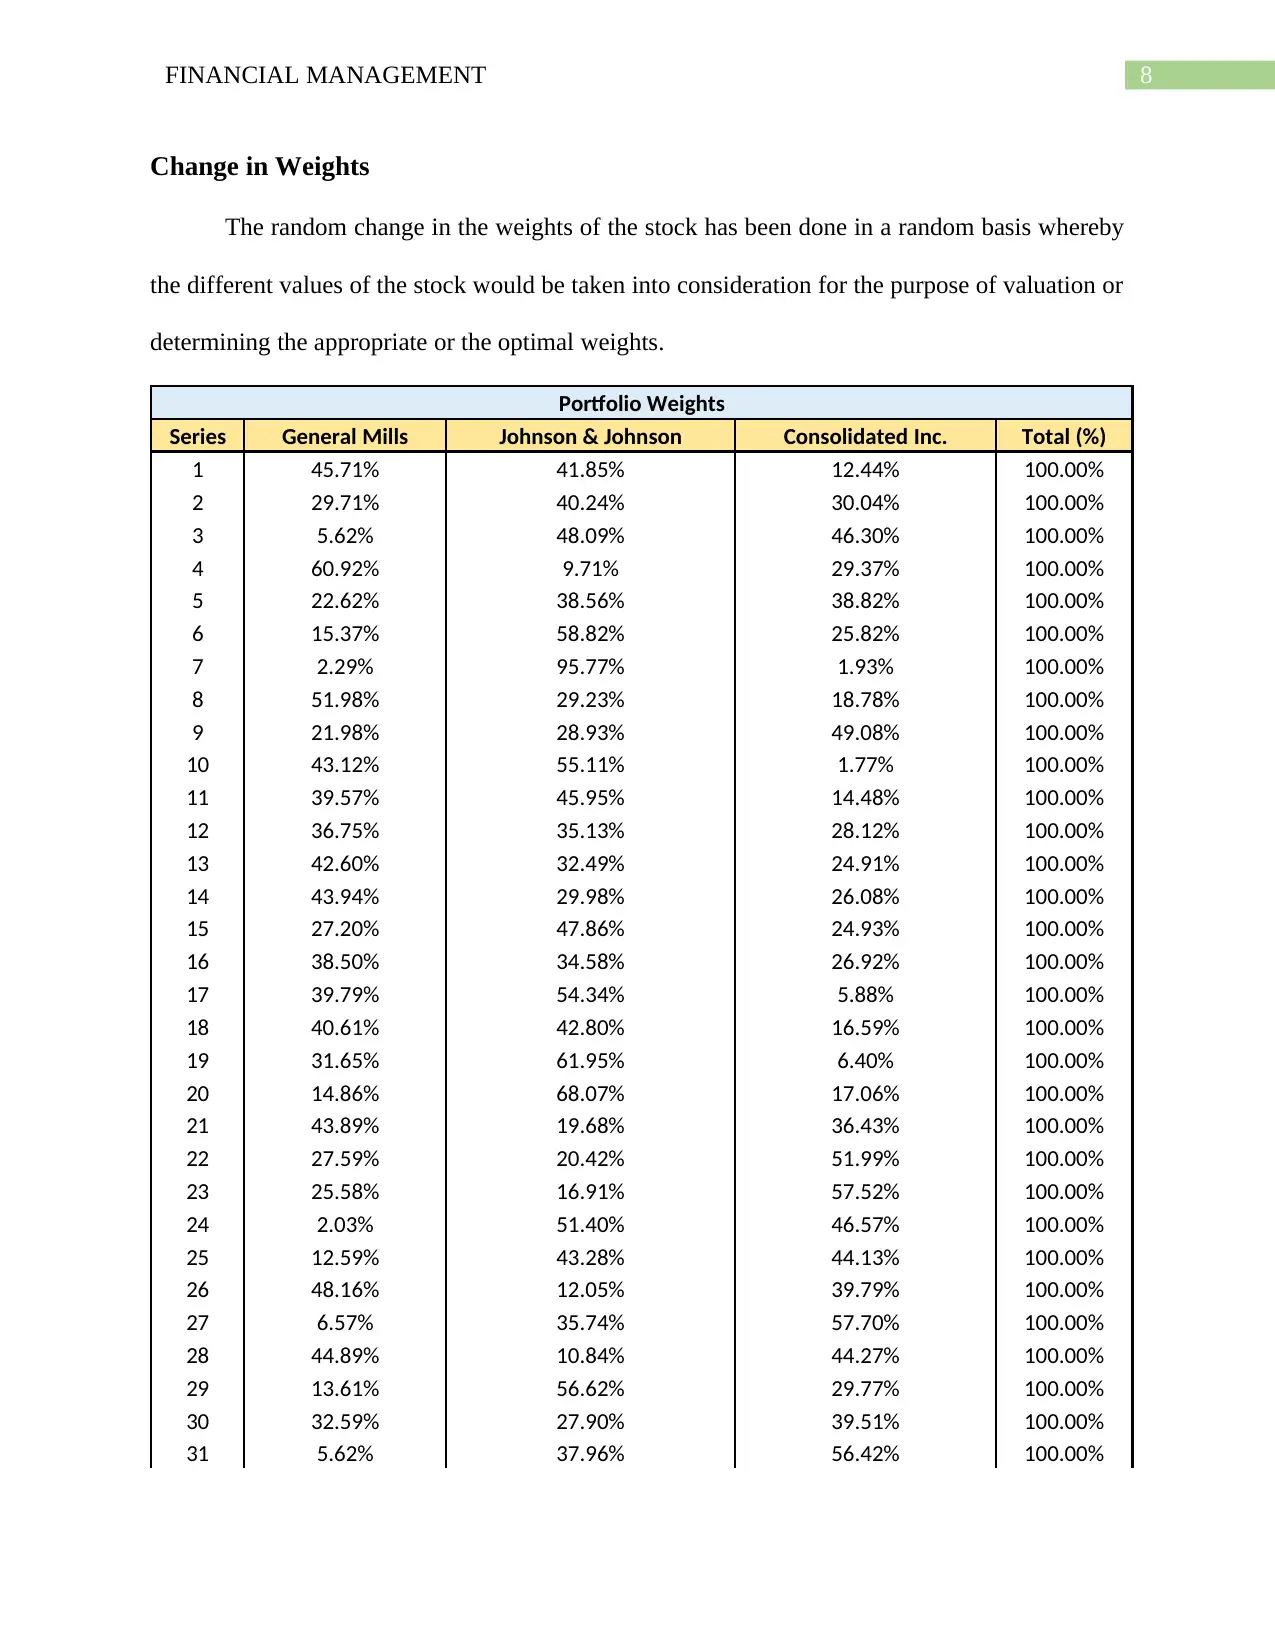
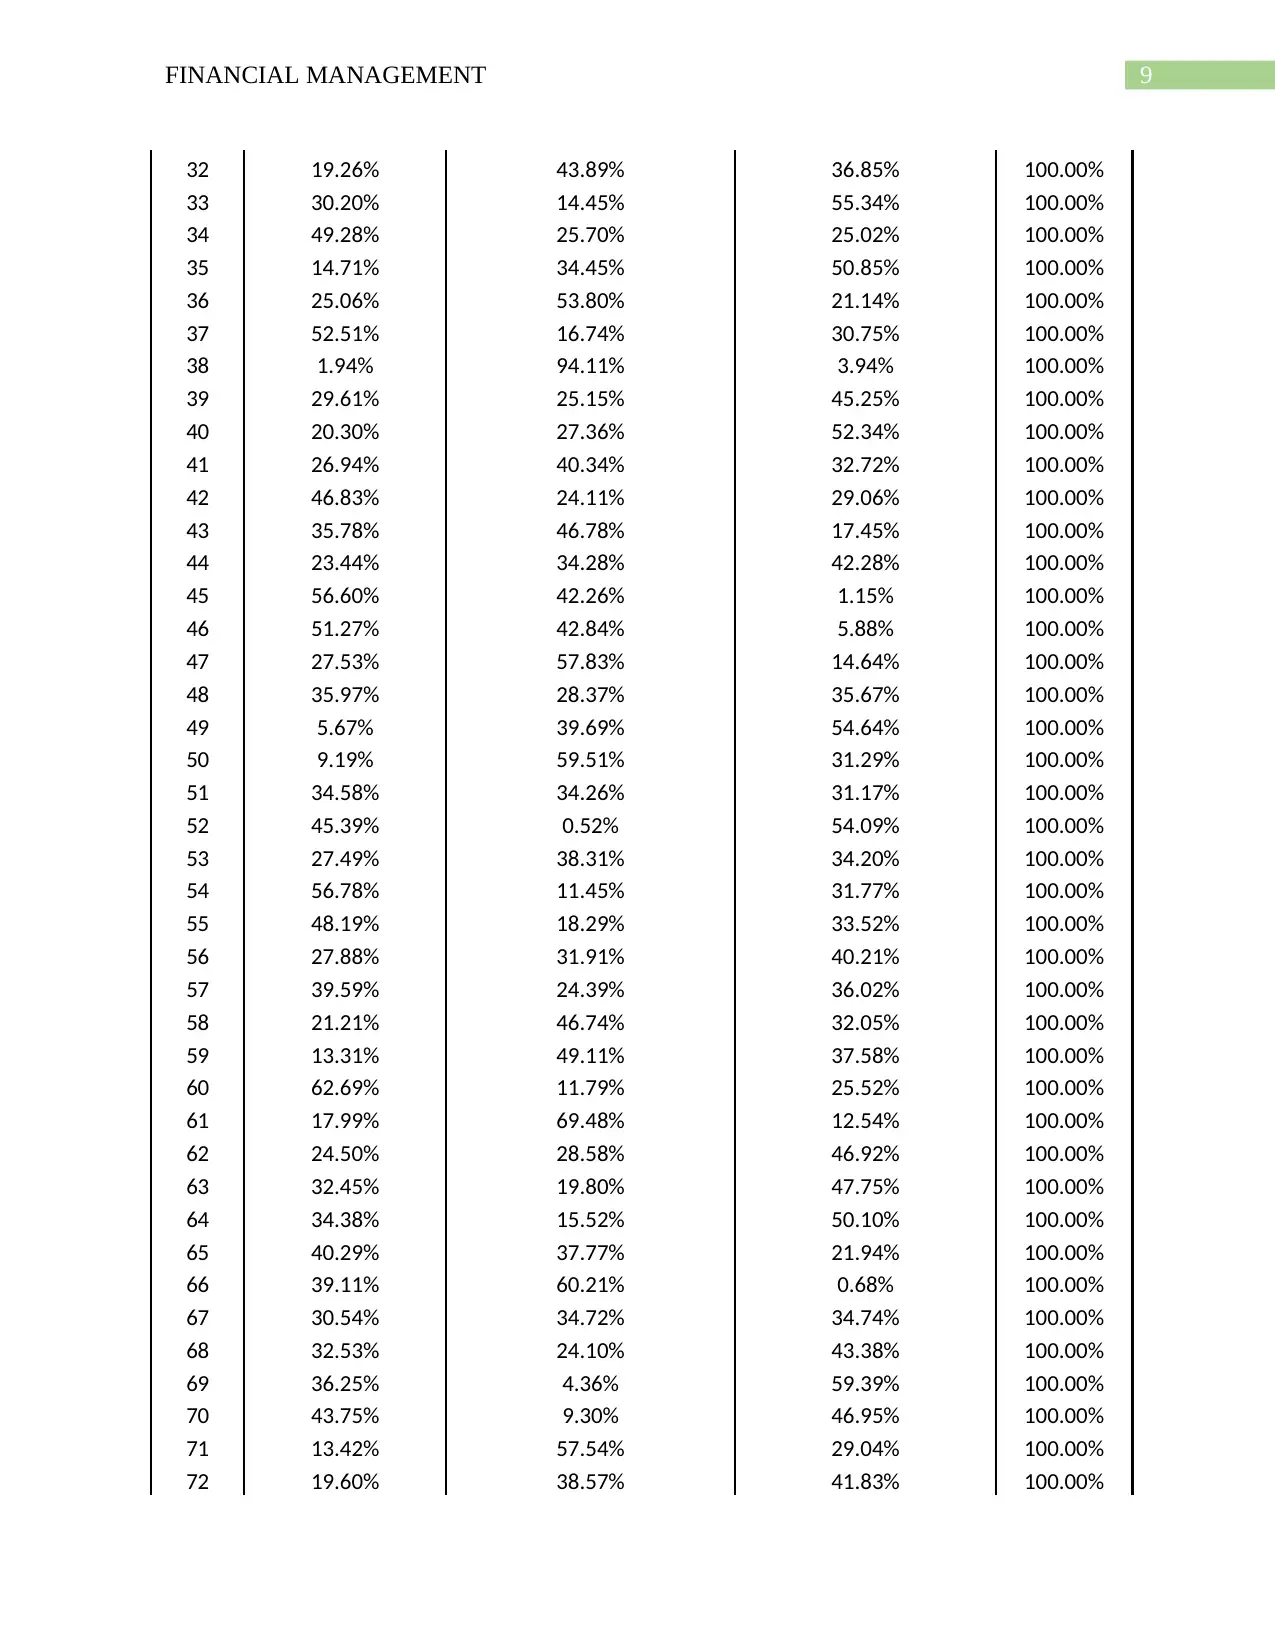
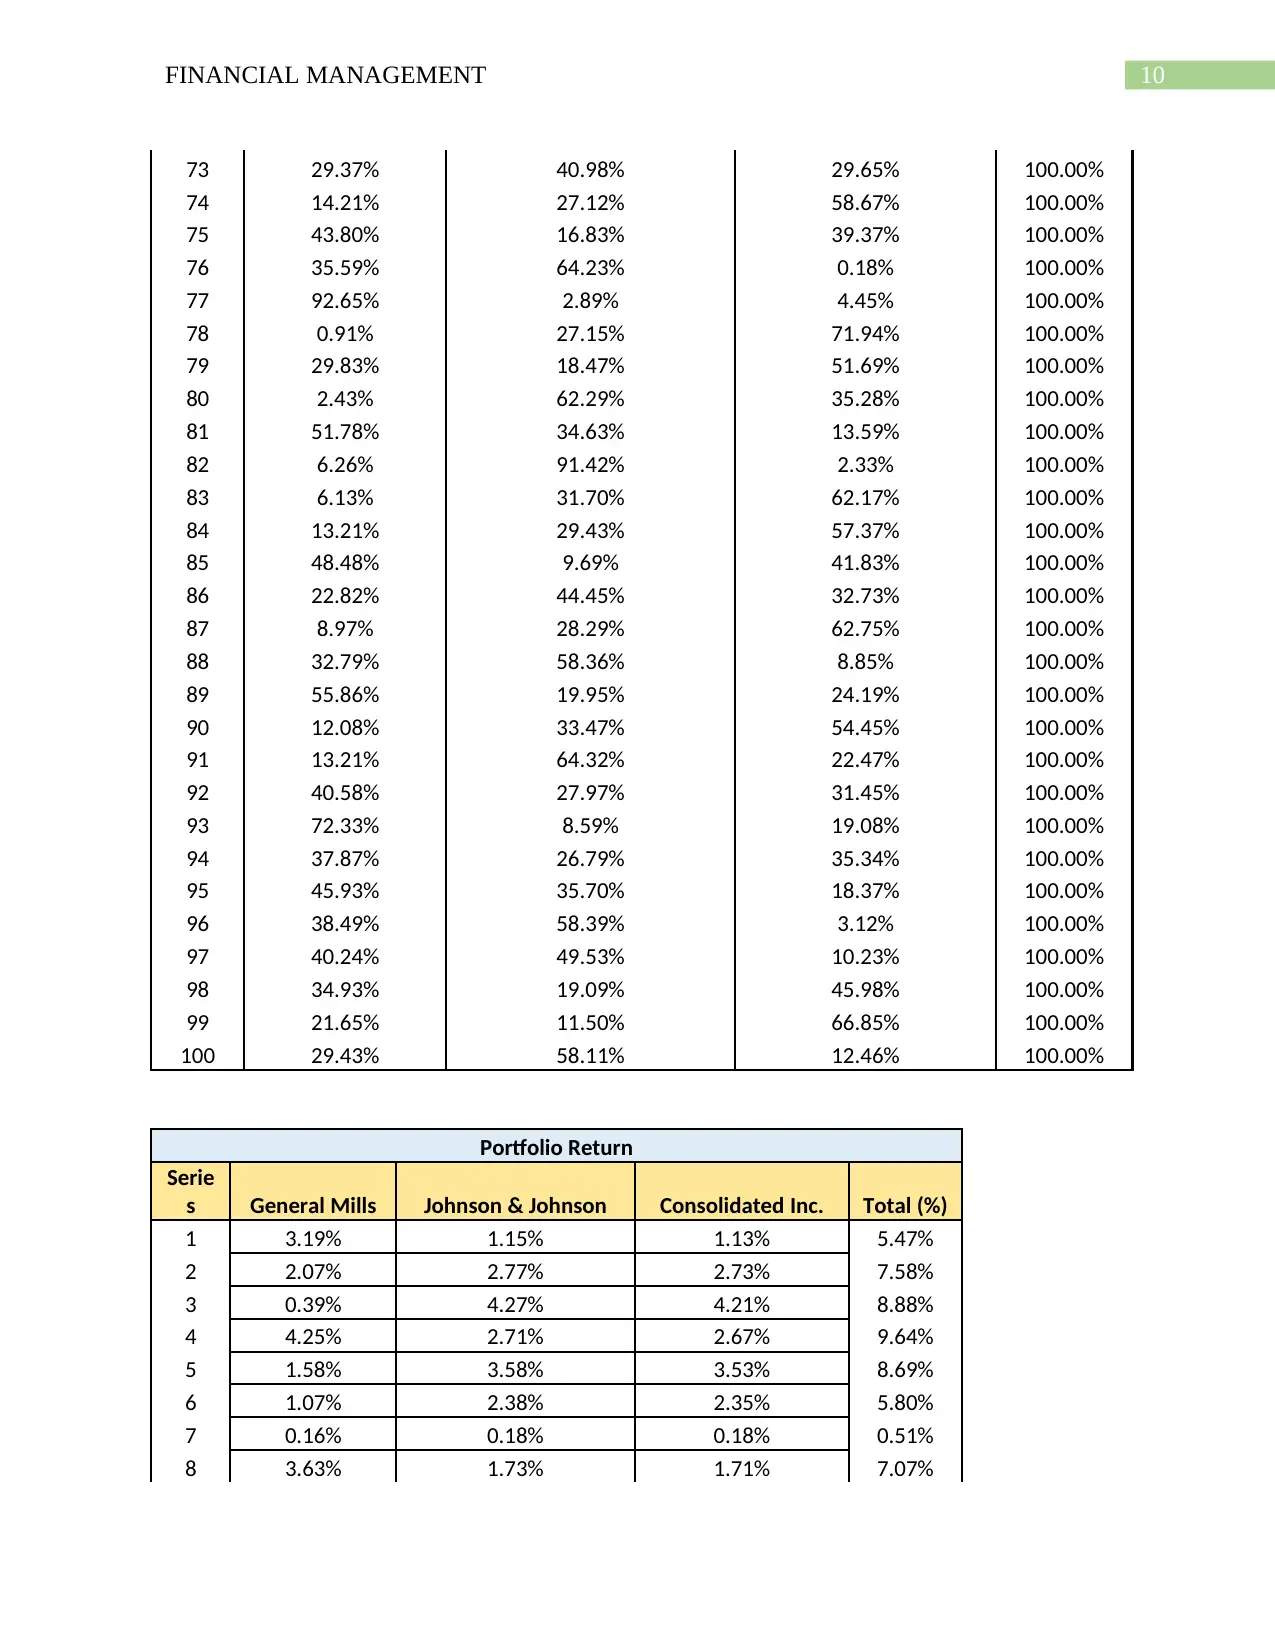
Change in Weights
The random change in the weights of the stock has been done in a random basis whereby
the different values of the stock would be taken into consideration for the purpose of valuation or
determining the appropriate or the optimal weights.
Portfolio Weights
Series General Mills Johnson & Johnson Consolidated Inc. Total (%)
1 45.71% 41.85% 12.44% 100.00%
2 29.71% 40.24% 30.04% 100.00%
3 5.62% 48.09% 46.30% 100.00%
4 60.92% 9.71% 29.37% 100.00%
5 22.62% 38.56% 38.82% 100.00%
6 15.37% 58.82% 25.82% 100.00%
7 2.29% 95.77% 1.93% 100.00%
8 51.98% 29.23% 18.78% 100.00%
9 21.98% 28.93% 49.08% 100.00%
10 43.12% 55.11% 1.77% 100.00%
11 39.57% 45.95% 14.48% 100.00%
12 36.75% 35.13% 28.12% 100.00%
13 42.60% 32.49% 24.91% 100.00%
14 43.94% 29.98% 26.08% 100.00%
15 27.20% 47.86% 24.93% 100.00%
16 38.50% 34.58% 26.92% 100.00%
17 39.79% 54.34% 5.88% 100.00%
18 40.61% 42.80% 16.59% 100.00%
19 31.65% 61.95% 6.40% 100.00%
20 14.86% 68.07% 17.06% 100.00%
21 43.89% 19.68% 36.43% 100.00%
22 27.59% 20.42% 51.99% 100.00%
23 25.58% 16.91% 57.52% 100.00%
24 2.03% 51.40% 46.57% 100.00%
25 12.59% 43.28% 44.13% 100.00%
26 48.16% 12.05% 39.79% 100.00%
27 6.57% 35.74% 57.70% 100.00%
28 44.89% 10.84% 44.27% 100.00%
29 13.61% 56.62% 29.77% 100.00%
30 32.59% 27.90% 39.51% 100.00%
31 5.62% 37.96% 56.42% 100.00%
⊘ This is a preview!⊘
Do you want full access?
Subscribe today to unlock all pages.
Trusted by 1+ million students worldwide
9FINANCIAL MANAGEMENT
32 19.26% 43.89% 36.85% 100.00%
33 30.20% 14.45% 55.34% 100.00%
34 49.28% 25.70% 25.02% 100.00%
35 14.71% 34.45% 50.85% 100.00%
36 25.06% 53.80% 21.14% 100.00%
37 52.51% 16.74% 30.75% 100.00%
38 1.94% 94.11% 3.94% 100.00%
39 29.61% 25.15% 45.25% 100.00%
40 20.30% 27.36% 52.34% 100.00%
41 26.94% 40.34% 32.72% 100.00%
42 46.83% 24.11% 29.06% 100.00%
43 35.78% 46.78% 17.45% 100.00%
44 23.44% 34.28% 42.28% 100.00%
45 56.60% 42.26% 1.15% 100.00%
46 51.27% 42.84% 5.88% 100.00%
47 27.53% 57.83% 14.64% 100.00%
48 35.97% 28.37% 35.67% 100.00%
49 5.67% 39.69% 54.64% 100.00%
50 9.19% 59.51% 31.29% 100.00%
51 34.58% 34.26% 31.17% 100.00%
52 45.39% 0.52% 54.09% 100.00%
53 27.49% 38.31% 34.20% 100.00%
54 56.78% 11.45% 31.77% 100.00%
55 48.19% 18.29% 33.52% 100.00%
56 27.88% 31.91% 40.21% 100.00%
57 39.59% 24.39% 36.02% 100.00%
58 21.21% 46.74% 32.05% 100.00%
59 13.31% 49.11% 37.58% 100.00%
60 62.69% 11.79% 25.52% 100.00%
61 17.99% 69.48% 12.54% 100.00%
62 24.50% 28.58% 46.92% 100.00%
63 32.45% 19.80% 47.75% 100.00%
64 34.38% 15.52% 50.10% 100.00%
65 40.29% 37.77% 21.94% 100.00%
66 39.11% 60.21% 0.68% 100.00%
67 30.54% 34.72% 34.74% 100.00%
68 32.53% 24.10% 43.38% 100.00%
69 36.25% 4.36% 59.39% 100.00%
70 43.75% 9.30% 46.95% 100.00%
71 13.42% 57.54% 29.04% 100.00%
72 19.60% 38.57% 41.83% 100.00%
Paraphrase This Document
Need a fresh take? Get an instant paraphrase of this document with our AI Paraphraser
10FINANCIAL MANAGEMENT
73 29.37% 40.98% 29.65% 100.00%
74 14.21% 27.12% 58.67% 100.00%
75 43.80% 16.83% 39.37% 100.00%
76 35.59% 64.23% 0.18% 100.00%
77 92.65% 2.89% 4.45% 100.00%
78 0.91% 27.15% 71.94% 100.00%
79 29.83% 18.47% 51.69% 100.00%
80 2.43% 62.29% 35.28% 100.00%
81 51.78% 34.63% 13.59% 100.00%
82 6.26% 91.42% 2.33% 100.00%
83 6.13% 31.70% 62.17% 100.00%
84 13.21% 29.43% 57.37% 100.00%
85 48.48% 9.69% 41.83% 100.00%
86 22.82% 44.45% 32.73% 100.00%
87 8.97% 28.29% 62.75% 100.00%
88 32.79% 58.36% 8.85% 100.00%
89 55.86% 19.95% 24.19% 100.00%
90 12.08% 33.47% 54.45% 100.00%
91 13.21% 64.32% 22.47% 100.00%
92 40.58% 27.97% 31.45% 100.00%
93 72.33% 8.59% 19.08% 100.00%
94 37.87% 26.79% 35.34% 100.00%
95 45.93% 35.70% 18.37% 100.00%
96 38.49% 58.39% 3.12% 100.00%
97 40.24% 49.53% 10.23% 100.00%
98 34.93% 19.09% 45.98% 100.00%
99 21.65% 11.50% 66.85% 100.00%
100 29.43% 58.11% 12.46% 100.00%
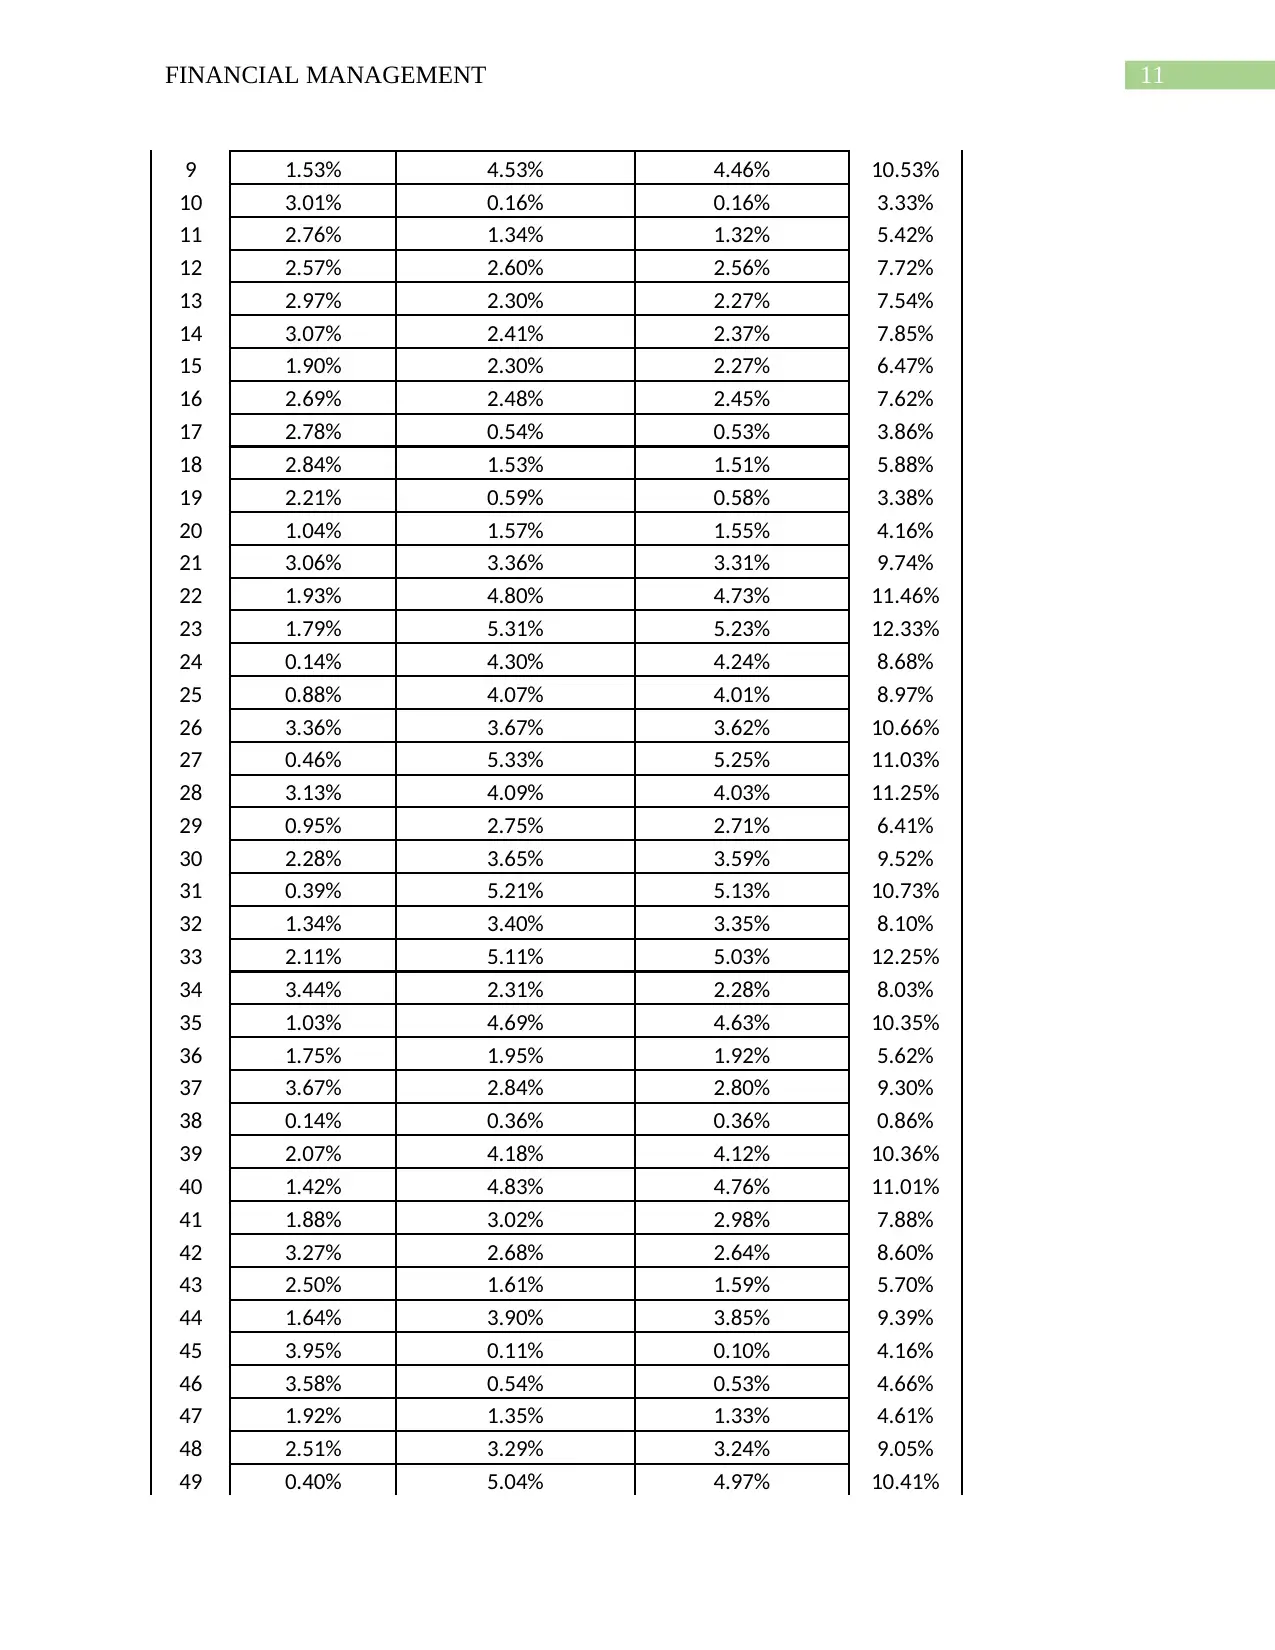
Portfolio Return
Serie
s General Mills Johnson & Johnson Consolidated Inc. Total (%)
1 3.19% 1.15% 1.13% 5.47%
2 2.07% 2.77% 2.73% 7.58%
3 0.39% 4.27% 4.21% 8.88%
4 4.25% 2.71% 2.67% 9.64%
5 1.58% 3.58% 3.53% 8.69%
6 1.07% 2.38% 2.35% 5.80%
7 0.16% 0.18% 0.18% 0.51%
8 3.63% 1.73% 1.71% 7.07%
73 29.37% 40.98% 29.65% 100.00%
74 14.21% 27.12% 58.67% 100.00%
75 43.80% 16.83% 39.37% 100.00%
76 35.59% 64.23% 0.18% 100.00%
77 92.65% 2.89% 4.45% 100.00%
78 0.91% 27.15% 71.94% 100.00%
79 29.83% 18.47% 51.69% 100.00%
80 2.43% 62.29% 35.28% 100.00%
81 51.78% 34.63% 13.59% 100.00%
82 6.26% 91.42% 2.33% 100.00%
83 6.13% 31.70% 62.17% 100.00%
84 13.21% 29.43% 57.37% 100.00%
85 48.48% 9.69% 41.83% 100.00%
86 22.82% 44.45% 32.73% 100.00%
87 8.97% 28.29% 62.75% 100.00%
88 32.79% 58.36% 8.85% 100.00%
89 55.86% 19.95% 24.19% 100.00%
90 12.08% 33.47% 54.45% 100.00%
91 13.21% 64.32% 22.47% 100.00%
92 40.58% 27.97% 31.45% 100.00%
93 72.33% 8.59% 19.08% 100.00%
94 37.87% 26.79% 35.34% 100.00%
95 45.93% 35.70% 18.37% 100.00%
96 38.49% 58.39% 3.12% 100.00%
97 40.24% 49.53% 10.23% 100.00%
98 34.93% 19.09% 45.98% 100.00%
99 21.65% 11.50% 66.85% 100.00%
100 29.43% 58.11% 12.46% 100.00%
Portfolio Return
Serie
s General Mills Johnson & Johnson Consolidated Inc. Total (%)
1 3.19% 1.15% 1.13% 5.47%
2 2.07% 2.77% 2.73% 7.58%
3 0.39% 4.27% 4.21% 8.88%
4 4.25% 2.71% 2.67% 9.64%
5 1.58% 3.58% 3.53% 8.69%
6 1.07% 2.38% 2.35% 5.80%
7 0.16% 0.18% 0.18% 0.51%
8 3.63% 1.73% 1.71% 7.07%
11FINANCIAL MANAGEMENT
9 1.53% 4.53% 4.46% 10.53%
10 3.01% 0.16% 0.16% 3.33%
11 2.76% 1.34% 1.32% 5.42%
12 2.57% 2.60% 2.56% 7.72%
13 2.97% 2.30% 2.27% 7.54%
14 3.07% 2.41% 2.37% 7.85%
15 1.90% 2.30% 2.27% 6.47%
16 2.69% 2.48% 2.45% 7.62%
17 2.78% 0.54% 0.53% 3.86%
18 2.84% 1.53% 1.51% 5.88%
19 2.21% 0.59% 0.58% 3.38%
20 1.04% 1.57% 1.55% 4.16%
21 3.06% 3.36% 3.31% 9.74%
22 1.93% 4.80% 4.73% 11.46%
23 1.79% 5.31% 5.23% 12.33%
24 0.14% 4.30% 4.24% 8.68%
25 0.88% 4.07% 4.01% 8.97%
26 3.36% 3.67% 3.62% 10.66%
27 0.46% 5.33% 5.25% 11.03%
28 3.13% 4.09% 4.03% 11.25%
29 0.95% 2.75% 2.71% 6.41%
30 2.28% 3.65% 3.59% 9.52%
31 0.39% 5.21% 5.13% 10.73%
32 1.34% 3.40% 3.35% 8.10%
33 2.11% 5.11% 5.03% 12.25%
34 3.44% 2.31% 2.28% 8.03%
35 1.03% 4.69% 4.63% 10.35%
36 1.75% 1.95% 1.92% 5.62%
37 3.67% 2.84% 2.80% 9.30%
38 0.14% 0.36% 0.36% 0.86%
39 2.07% 4.18% 4.12% 10.36%
40 1.42% 4.83% 4.76% 11.01%
41 1.88% 3.02% 2.98% 7.88%
42 3.27% 2.68% 2.64% 8.60%
43 2.50% 1.61% 1.59% 5.70%
44 1.64% 3.90% 3.85% 9.39%
45 3.95% 0.11% 0.10% 4.16%
46 3.58% 0.54% 0.53% 4.66%
47 1.92% 1.35% 1.33% 4.61%
48 2.51% 3.29% 3.24% 9.05%
49 0.40% 5.04% 4.97% 10.41%
⊘ This is a preview!⊘
Do you want full access?
Subscribe today to unlock all pages.
Trusted by 1+ million students worldwide
1 out of 16
Your All-in-One AI-Powered Toolkit for Academic Success.
+13062052269
info@desklib.com
Available 24*7 on WhatsApp / Email
![[object Object]](/_next/static/media/star-bottom.7253800d.svg)
Unlock your academic potential
Copyright © 2020–2026 A2Z Services. All Rights Reserved. Developed and managed by ZUCOL.