LSBM203 Managerial Finance Portfolio: Financial Statement Analysis
VerifiedAdded on 2023/01/03
|19
|3919
|55
Portfolio
AI Summary
This finance portfolio delves into the analysis of financial statements, focusing on two key areas: ratio analysis and investment appraisal techniques. The portfolio examines the financial data of Tesco and Sainsbury, utilizing various ratio analysis methods such as current ratio, quick ratio, net profit margin, gearing ratio, price to earnings ratio, and return on capital employed to evaluate their financial performance. Furthermore, the report explores investment appraisal techniques, specifically the net present value method, to assess different investment options. The analysis includes interpretations of the ratios and their implications for the companies' financial health and investment decisions, providing a comprehensive overview of financial statement analysis and capital budgeting processes within a business context. The portfolio is structured into two main sections, covering the analysis of financial statements and evaluation of investment options through the net present value method.

Portfolio
Paraphrase This Document
Need a fresh take? Get an instant paraphrase of this document with our AI Paraphraser
TABLE OF CONTENTS
INTRODUCTION.....................................................................3
PORTFOLIO 1...........................................................................3
Ratio analysis..........................................................................3
Limitations of ratio analysis:................................................14
PORTFOLIO 2.........................................................................14
Investment appraisal techniques...........................................14
Limitation of using investment appraisal techniques in long term decision making 16
CONCLUSION........................................................................17
REFERENCES........................................................................18
INTRODUCTION
In a business firm, the most important thing that is required for taking on the business
operations further is money and finance. Another look aspect in this category is that company
should properly analyse the financial statements. To analyse financial statements, there are
various methods, through which these reports can be monitored and evaluated. To investigate
into financial statements, there are various forms of tests, some of main are ratio analysis, trend
analysis, cash flow statement, etc. The major objective behind this investigation into financial
statements of the company is that it will assist in planning for future course of action. To produce
an efficient strategic planning for future prospects of business, it is essential to look into every
small aspect of financial statements. After inspecting into financial statements, next step is to
look into the process of application of funds and financial resources. The main element in this
aspect is that resources should be allocated in such a way that; they are generating maximum
possible benefits. This process of analysis is called as capital budgeting process. This report is
divided in two segments, first is discussing about analysing financial statements and second part
is focusing on evaluation of various investment options through method of net present value
method. This report will be focusing of financial information of Tesco and Sainsbury, which are
extracted from their financial reports.
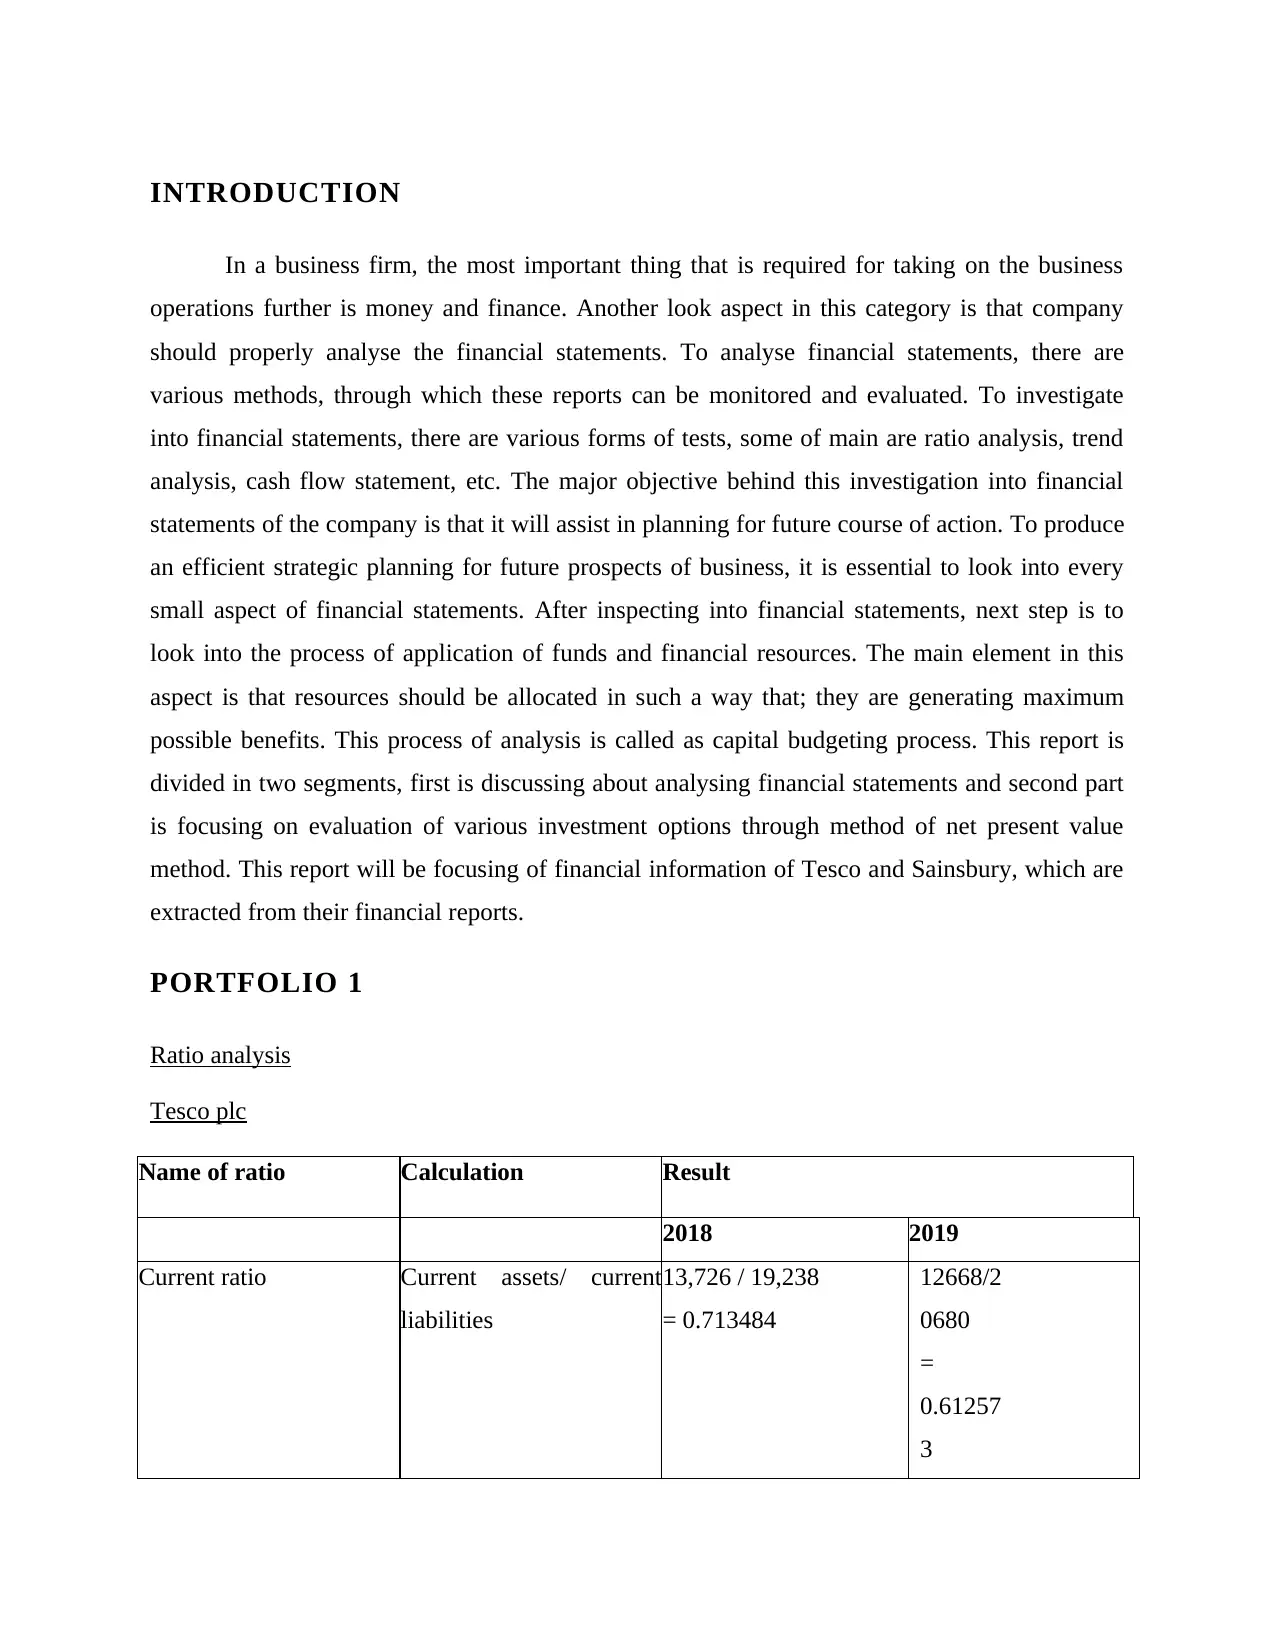
PORTFOLIO 1
Ratio analysis
Tesco plc
Name of ratio Calculation Result
2018 2019
Current ratio Current assets/ current
liabilities
13,726 / 19,238
= 0.713484
12668/2
0680
=
0.61257
3
In a business firm, the most important thing that is required for taking on the business
operations further is money and finance. Another look aspect in this category is that company
should properly analyse the financial statements. To analyse financial statements, there are
various methods, through which these reports can be monitored and evaluated. To investigate
into financial statements, there are various forms of tests, some of main are ratio analysis, trend
analysis, cash flow statement, etc. The major objective behind this investigation into financial
statements of the company is that it will assist in planning for future course of action. To produce
an efficient strategic planning for future prospects of business, it is essential to look into every
small aspect of financial statements. After inspecting into financial statements, next step is to
look into the process of application of funds and financial resources. The main element in this
aspect is that resources should be allocated in such a way that; they are generating maximum
possible benefits. This process of analysis is called as capital budgeting process. This report is
divided in two segments, first is discussing about analysing financial statements and second part
is focusing on evaluation of various investment options through method of net present value
method. This report will be focusing of financial information of Tesco and Sainsbury, which are
extracted from their financial reports.
PORTFOLIO 1
Ratio analysis
Tesco plc
Name of ratio Calculation Result
2018 2019
Current ratio Current assets/ current
liabilities
13,726 / 19,238
= 0.713484
12668/2
0680
=
0.61257
3
⊘ This is a preview!⊘
Do you want full access?
Subscribe today to unlock all pages.
Trusted by 1+ million students worldwide
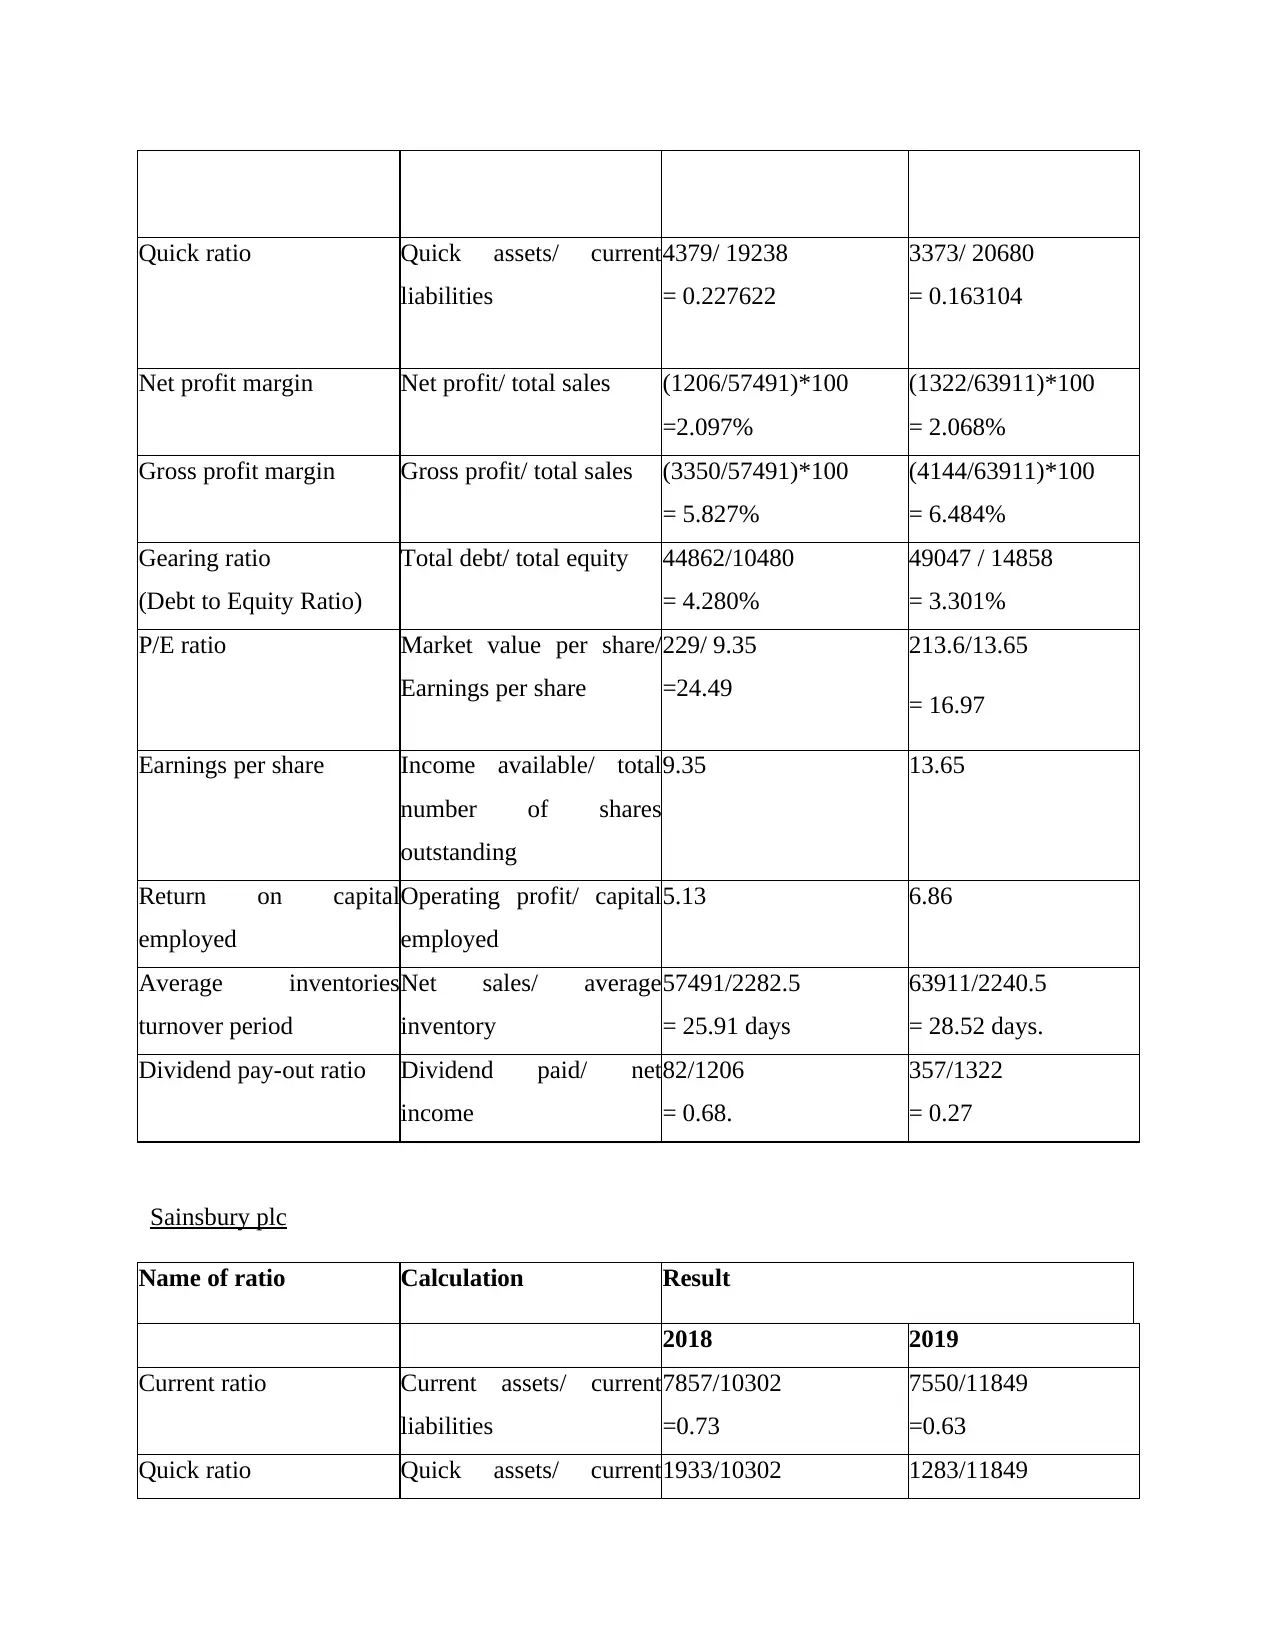
Quick ratio Quick assets/ current
liabilities
4379/ 19238
= 0.227622
3373/ 20680
= 0.163104
Net profit margin Net profit/ total sales (1206/57491)*100
=2.097%
(1322/63911)*100
= 2.068%
Gross profit margin Gross profit/ total sales (3350/57491)*100
= 5.827%
(4144/63911)*100
= 6.484%
Gearing ratio
(Debt to Equity Ratio)
Total debt/ total equity 44862/10480
= 4.280%
49047 / 14858
= 3.301%
P/E ratio Market value per share/
Earnings per share
229/ 9.35
=24.49
213.6/13.65
= 16.97
Earnings per share Income available/ total
number of shares
outstanding
9.35 13.65
Return on capital
employed
Operating profit/ capital
employed
5.13 6.86
Average inventories
turnover period
Net sales/ average
inventory
57491/2282.5
= 25.91 days
63911/2240.5
= 28.52 days.
Dividend pay-out ratio Dividend paid/ net
income
82/1206
= 0.68.
357/1322
= 0.27
Sainsbury plc
Name of ratio Calculation Result
2018 2019
Current ratio Current assets/ current
liabilities
7857/10302
=0.73
7550/11849
=0.63
Quick ratio Quick assets/ current1933/10302 1283/11849
liabilities
4379/ 19238
= 0.227622
3373/ 20680
= 0.163104
Net profit margin Net profit/ total sales (1206/57491)*100
=2.097%
(1322/63911)*100
= 2.068%
Gross profit margin Gross profit/ total sales (3350/57491)*100
= 5.827%
(4144/63911)*100
= 6.484%
Gearing ratio
(Debt to Equity Ratio)
Total debt/ total equity 44862/10480
= 4.280%
49047 / 14858
= 3.301%
P/E ratio Market value per share/
Earnings per share
229/ 9.35
=24.49
213.6/13.65
= 16.97
Earnings per share Income available/ total
number of shares
outstanding
9.35 13.65
Return on capital
employed
Operating profit/ capital
employed
5.13 6.86
Average inventories
turnover period
Net sales/ average
inventory
57491/2282.5
= 25.91 days
63911/2240.5
= 28.52 days.
Dividend pay-out ratio Dividend paid/ net
income
82/1206
= 0.68.
357/1322
= 0.27
Sainsbury plc
Name of ratio Calculation Result
2018 2019
Current ratio Current assets/ current
liabilities
7857/10302
=0.73
7550/11849
=0.63
Quick ratio Quick assets/ current1933/10302 1283/11849
Paraphrase This Document
Need a fresh take? Get an instant paraphrase of this document with our AI Paraphraser
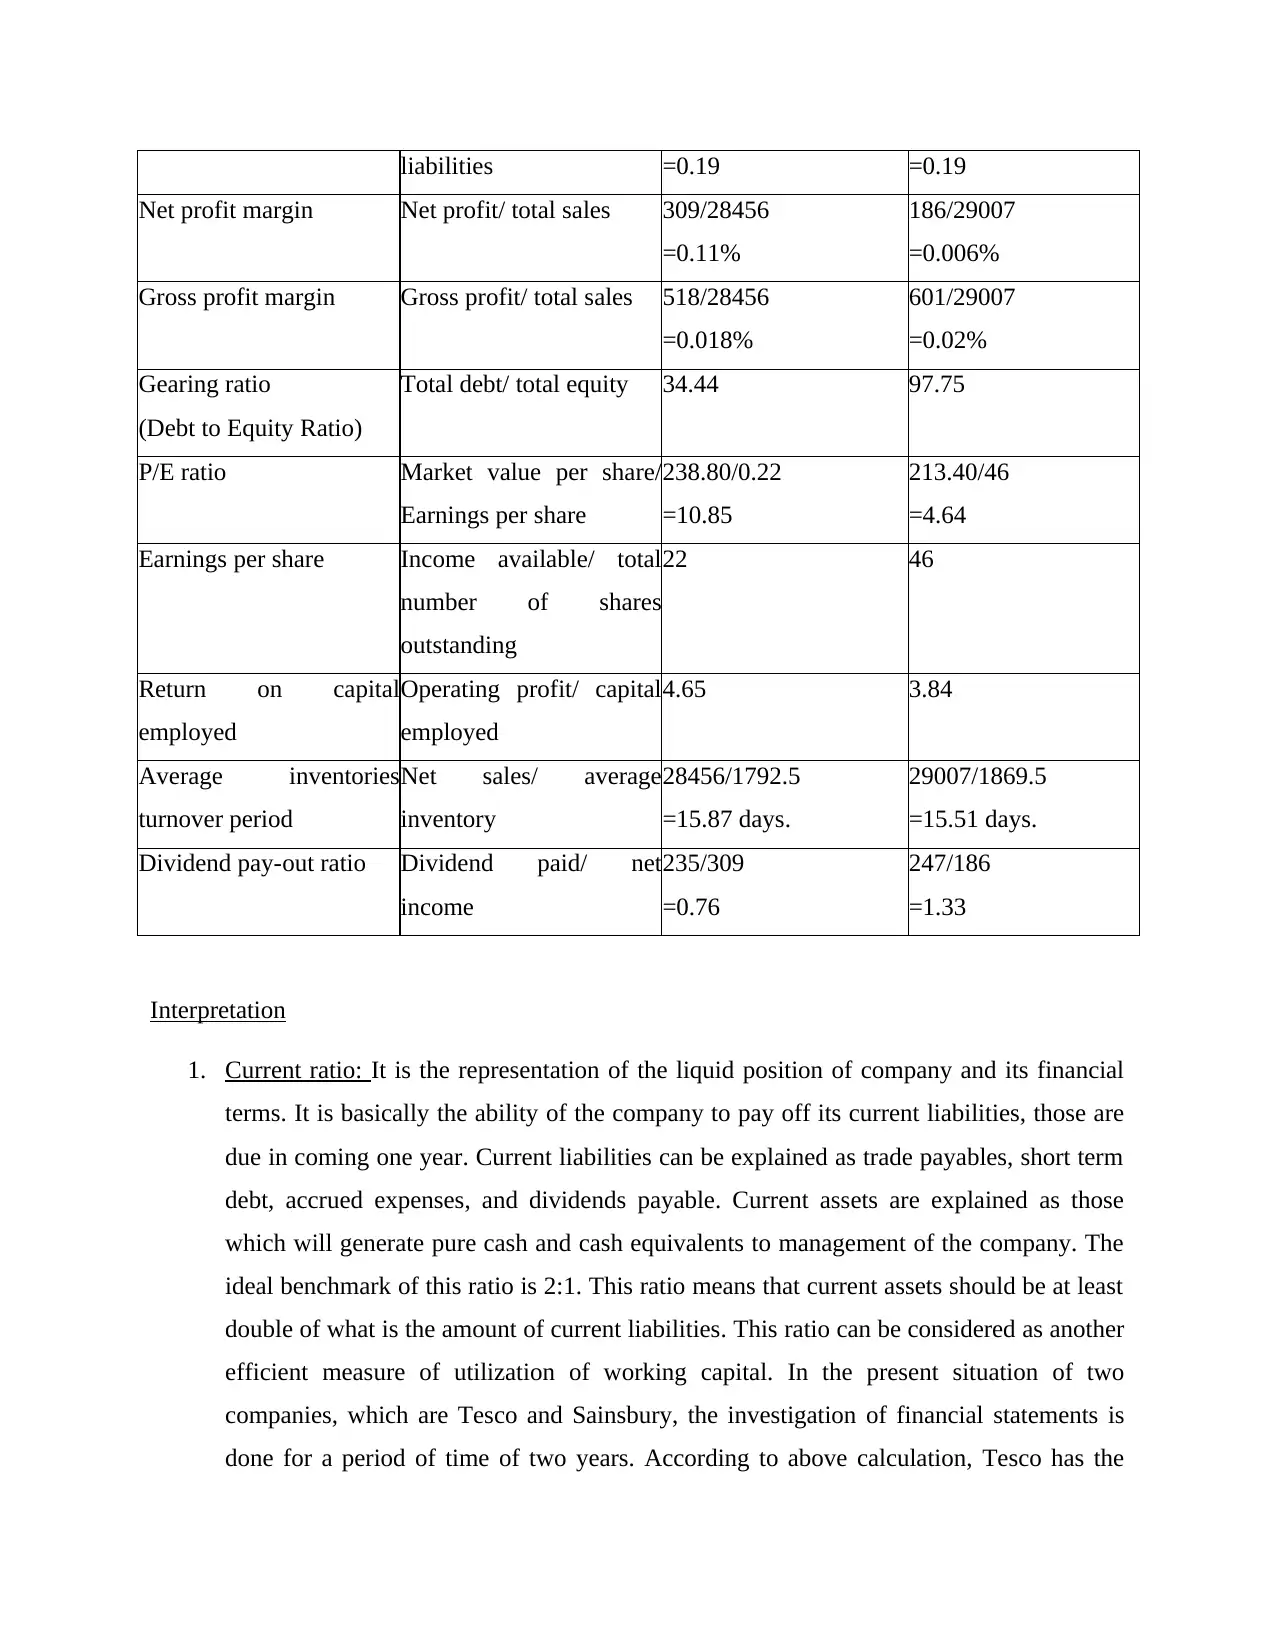
liabilities =0.19 =0.19
Net profit margin Net profit/ total sales 309/28456
=0.11%
186/29007
=0.006%
Gross profit margin Gross profit/ total sales 518/28456
=0.018%
601/29007
=0.02%
Gearing ratio
(Debt to Equity Ratio)
Total debt/ total equity 34.44 97.75
P/E ratio Market value per share/
Earnings per share
238.80/0.22
=10.85
213.40/46
=4.64
Earnings per share Income available/ total
number of shares
outstanding
22 46
Return on capital
employed
Operating profit/ capital
employed
4.65 3.84
Average inventories
turnover period
Net sales/ average
inventory
28456/1792.5
=15.87 days.
29007/1869.5
=15.51 days.
Dividend pay-out ratio Dividend paid/ net
income
235/309
=0.76
247/186
=1.33
Interpretation
1. Current ratio: It is the representation of the liquid position of company and its financial
terms. It is basically the ability of the company to pay off its current liabilities, those are
due in coming one year. Current liabilities can be explained as trade payables, short term
debt, accrued expenses, and dividends payable. Current assets are explained as those
which will generate pure cash and cash equivalents to management of the company. The
ideal benchmark of this ratio is 2:1. This ratio means that current assets should be at least
double of what is the amount of current liabilities. This ratio can be considered as another
efficient measure of utilization of working capital. In the present situation of two
companies, which are Tesco and Sainsbury, the investigation of financial statements is
done for a period of time of two years. According to above calculation, Tesco has the

current ratio of 0.71 and 0.61 in year 2018 and 2019. On the other hand, Sainsbury has
the current ratio of 0.73 and 0.63, respectively in same span of time. The position of
liquidity is almost indistinguishable in both the companies. This means they both are
using their working capital according to same policies of working capital. Ratio is not
matching the mark of ideal ratio, as in accordance of ideal ratio current assets should be
twice of what is the volume of current liabilities. The ratio of chosen companies’ low,
hence, it is advisable that company should take care of this fact.
2. Quick ratio: This ratio comes under the category of same liquidity ratio. This is also
making an attempt to develop an understanding of the operational feasibility of the quick
assets or almost liquid assets. This means that is determining the relation of quick assets
and current liabilities. Quick assets are defined as those assets which are almost
equivalent to cash and cash equivalents. This means that they can be easily converted into
cash or are already in cash. Examples of quick assets are cash, marketable securities,
trade receivables, etc. These assets are used to pay off current liabilities. In accordance of
what famous theorists has recognized, the ideal mark for quick ratio is 1:1. This means
that quick assets should be at least equal to current liabilities. This will represent the
situation of perfect liquidity as, if there is some emergency, where immediate cash is
required, then company is in a position to confront that situation with ease. In the present
situation of Tesco and Sainsbury, the quick ratio comes out to be (Tesco- 0.22 and 0.16)
and (Sainsbury-0.19 and 0.19), respectively in year of 2018 and 2019. This means that
⊘ This is a preview!⊘
Do you want full access?
Subscribe today to unlock all pages.
Trusted by 1+ million students worldwide
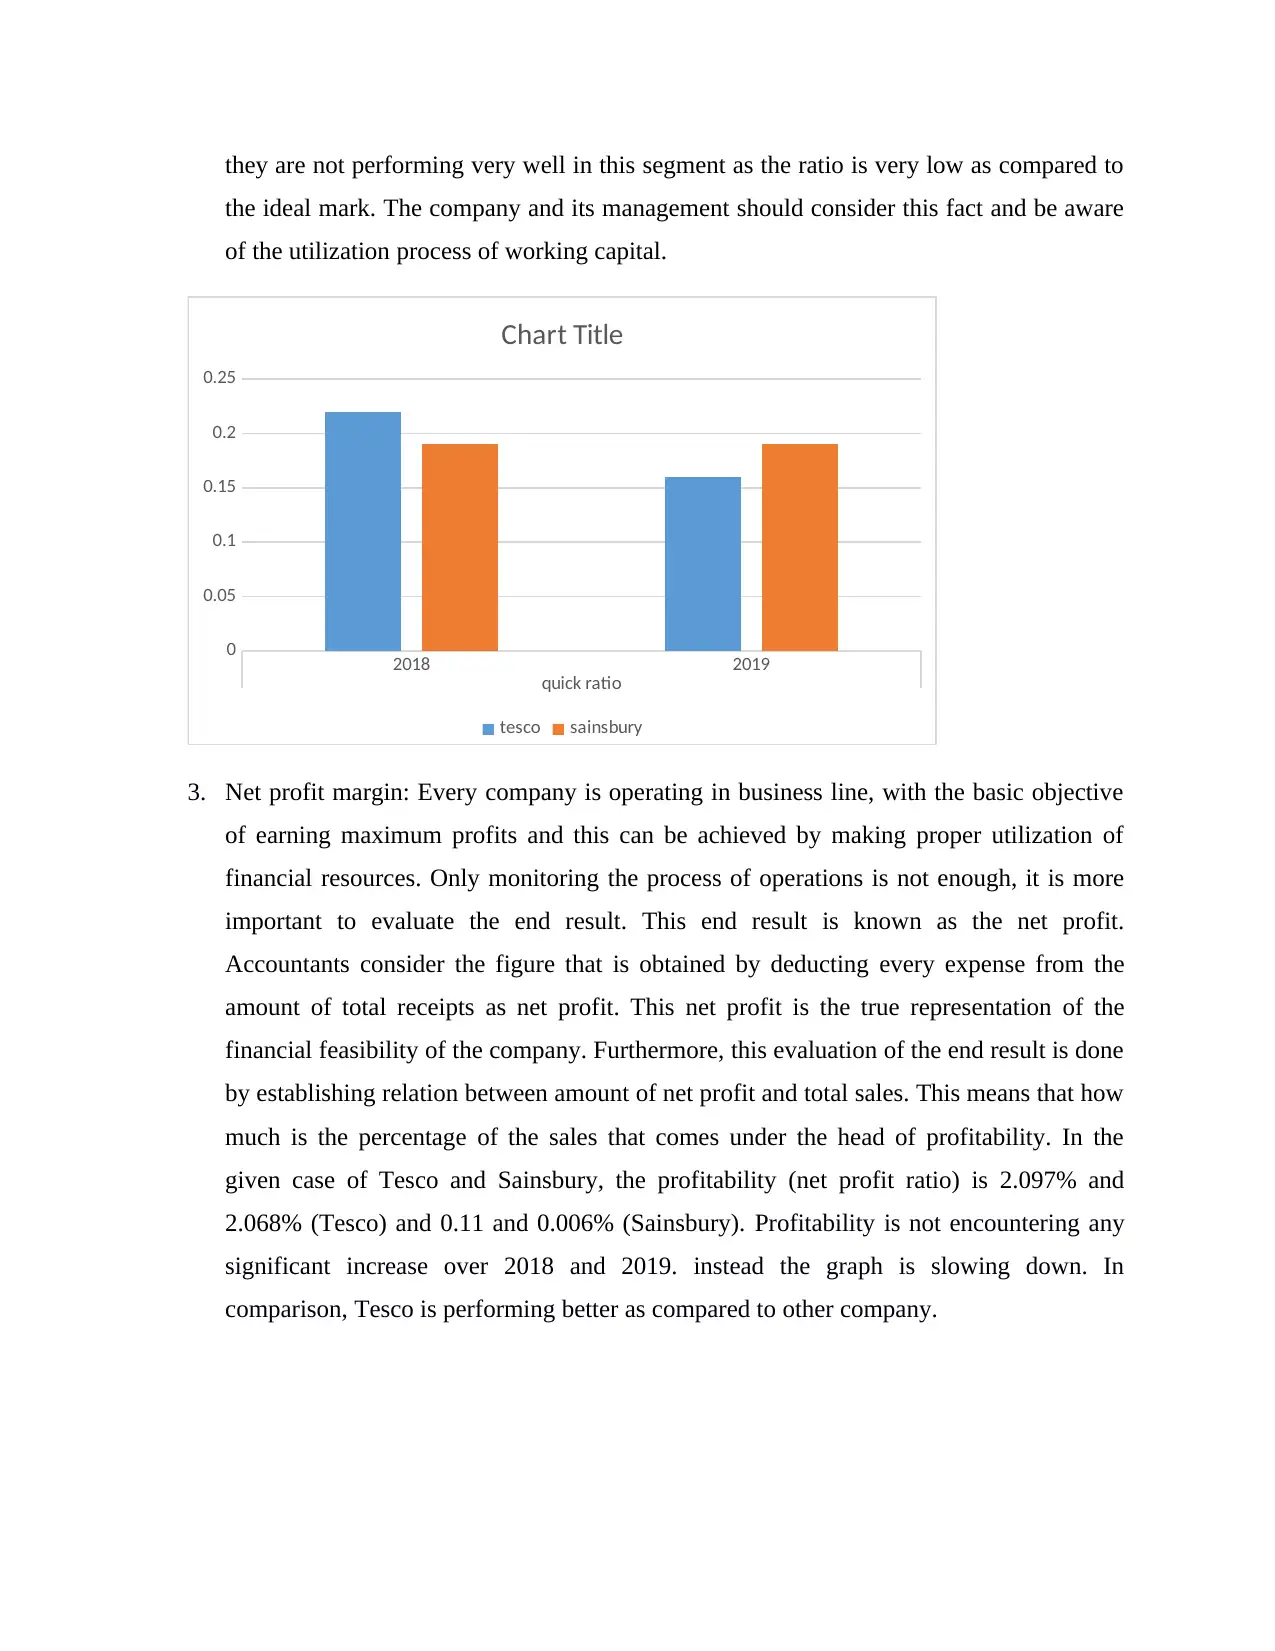
they are not performing very well in this segment as the ratio is very low as compared to
the ideal mark. The company and its management should consider this fact and be aware
of the utilization process of working capital.
2018 2019
quick ratio
0
0.05
0.1
0.15
0.2
0.25
Chart Title
tesco sainsbury
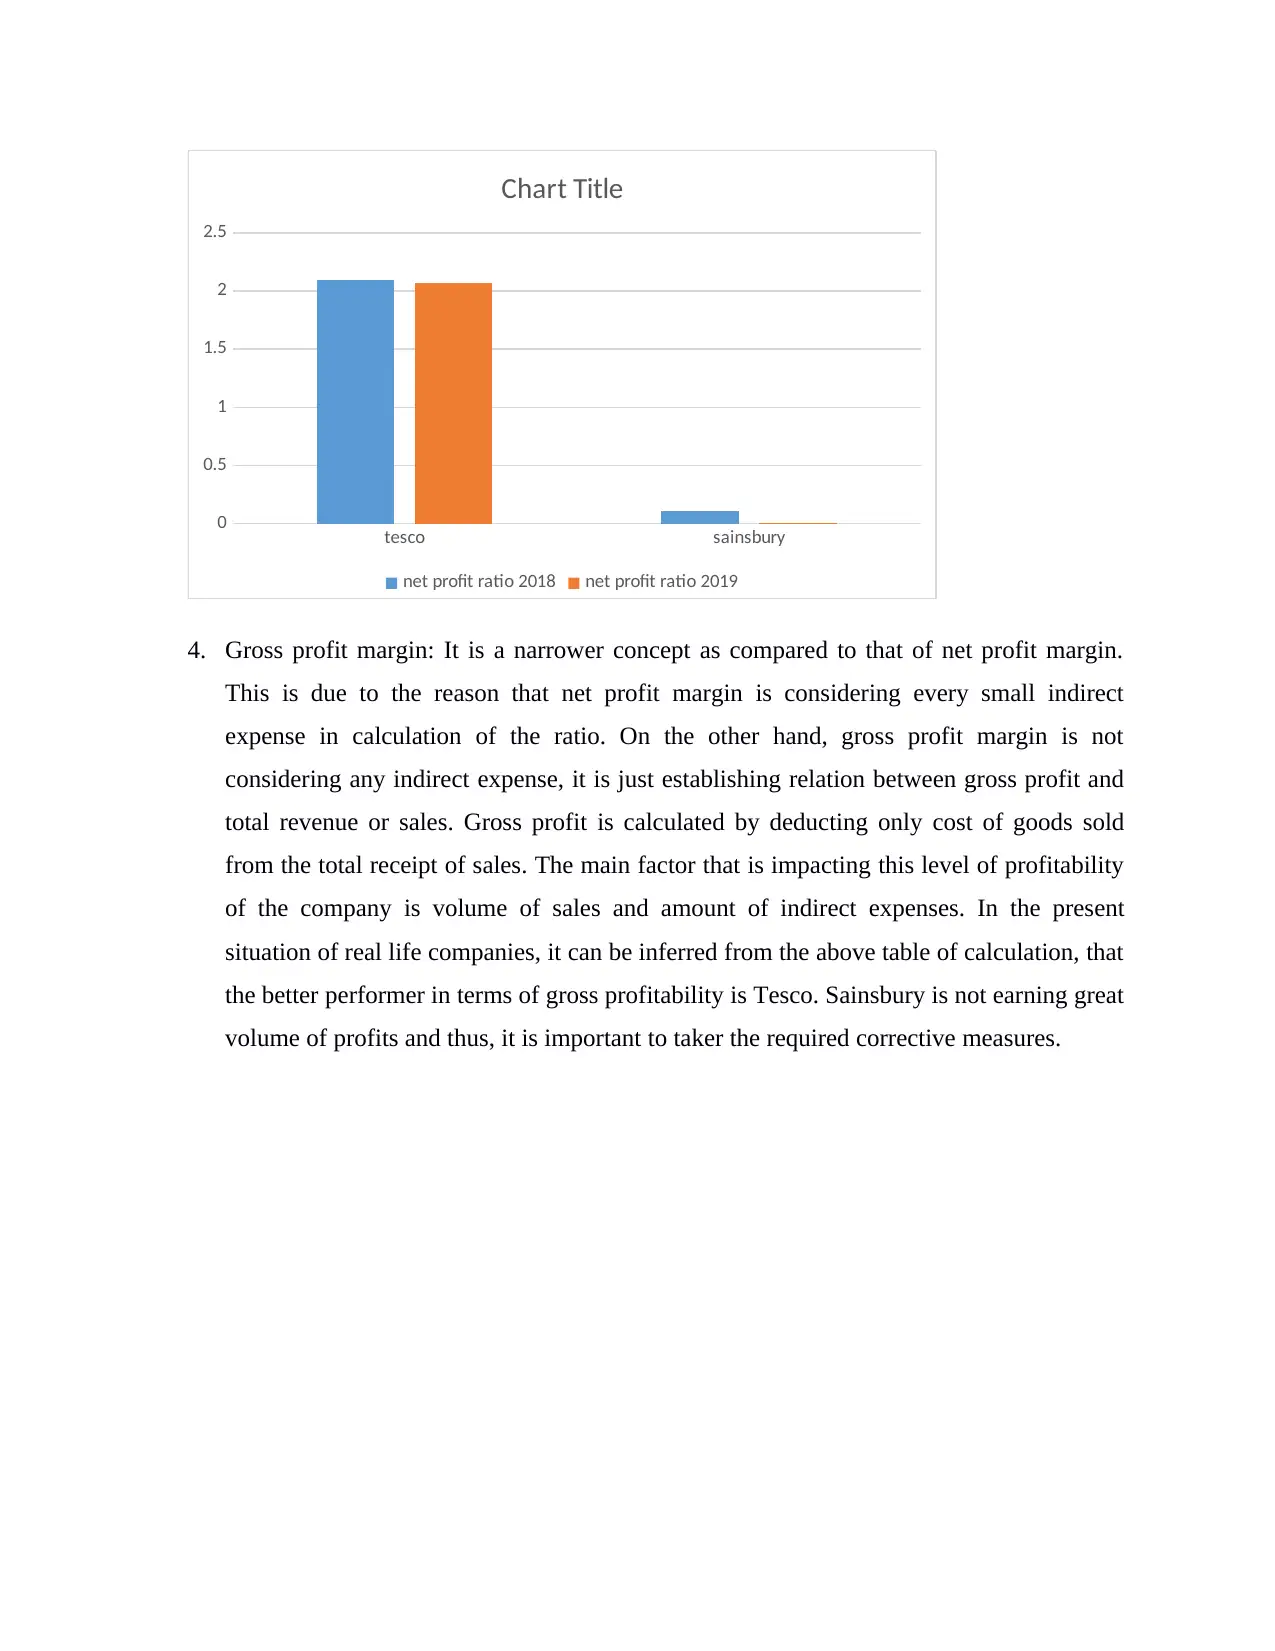
3. Net profit margin: Every company is operating in business line, with the basic objective
of earning maximum profits and this can be achieved by making proper utilization of
financial resources. Only monitoring the process of operations is not enough, it is more
important to evaluate the end result. This end result is known as the net profit.
Accountants consider the figure that is obtained by deducting every expense from the
amount of total receipts as net profit. This net profit is the true representation of the
financial feasibility of the company. Furthermore, this evaluation of the end result is done
by establishing relation between amount of net profit and total sales. This means that how
much is the percentage of the sales that comes under the head of profitability. In the
given case of Tesco and Sainsbury, the profitability (net profit ratio) is 2.097% and
2.068% (Tesco) and 0.11 and 0.006% (Sainsbury). Profitability is not encountering any
significant increase over 2018 and 2019. instead the graph is slowing down. In
comparison, Tesco is performing better as compared to other company.
the ideal mark. The company and its management should consider this fact and be aware
of the utilization process of working capital.
2018 2019
quick ratio
0
0.05
0.1
0.15
0.2
0.25
Chart Title
tesco sainsbury
3. Net profit margin: Every company is operating in business line, with the basic objective
of earning maximum profits and this can be achieved by making proper utilization of
financial resources. Only monitoring the process of operations is not enough, it is more
important to evaluate the end result. This end result is known as the net profit.
Accountants consider the figure that is obtained by deducting every expense from the
amount of total receipts as net profit. This net profit is the true representation of the
financial feasibility of the company. Furthermore, this evaluation of the end result is done
by establishing relation between amount of net profit and total sales. This means that how
much is the percentage of the sales that comes under the head of profitability. In the
given case of Tesco and Sainsbury, the profitability (net profit ratio) is 2.097% and
2.068% (Tesco) and 0.11 and 0.006% (Sainsbury). Profitability is not encountering any
significant increase over 2018 and 2019. instead the graph is slowing down. In
comparison, Tesco is performing better as compared to other company.
Paraphrase This Document
Need a fresh take? Get an instant paraphrase of this document with our AI Paraphraser
tesco sainsbury
0
0.5
1
1.5
2
2.5
Chart Title
net profit ratio 2018 net profit ratio 2019
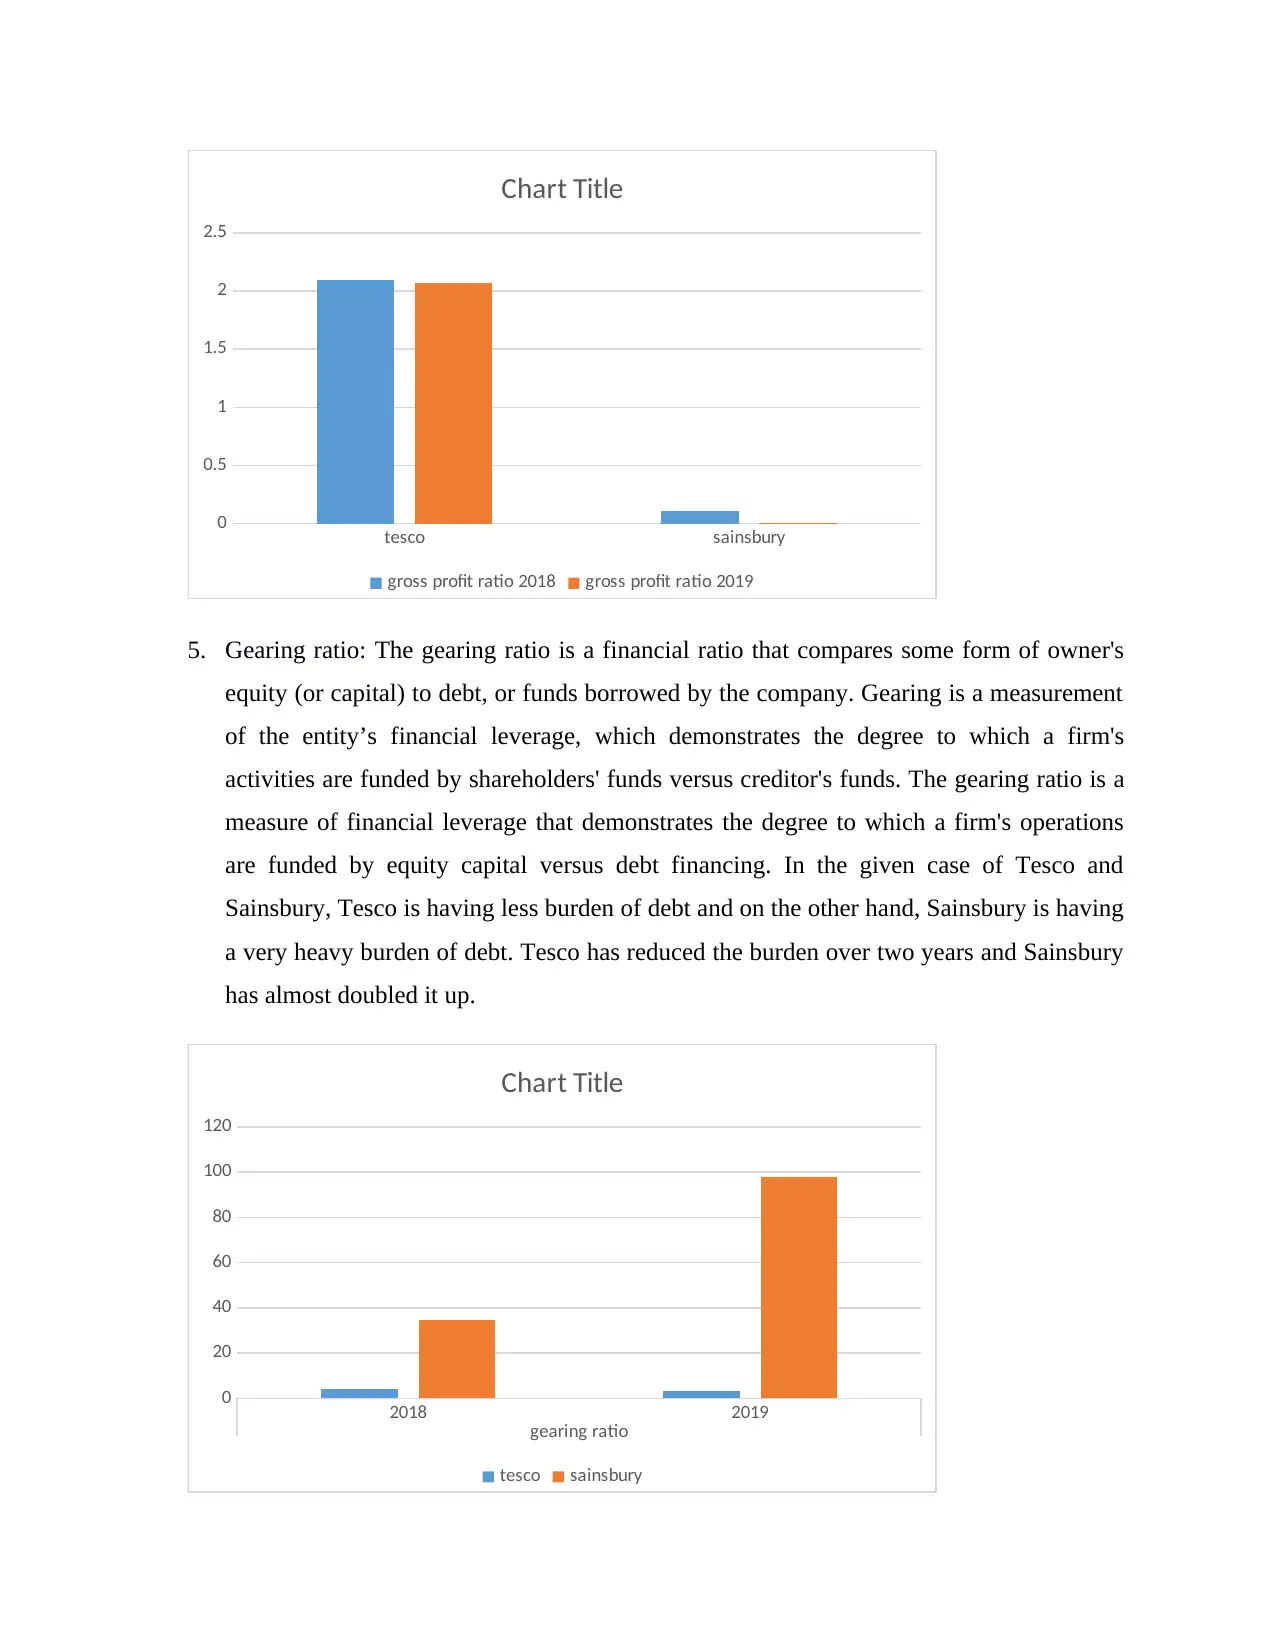
4. Gross profit margin: It is a narrower concept as compared to that of net profit margin.
This is due to the reason that net profit margin is considering every small indirect
expense in calculation of the ratio. On the other hand, gross profit margin is not
considering any indirect expense, it is just establishing relation between gross profit and
total revenue or sales. Gross profit is calculated by deducting only cost of goods sold
from the total receipt of sales. The main factor that is impacting this level of profitability
of the company is volume of sales and amount of indirect expenses. In the present
situation of real life companies, it can be inferred from the above table of calculation, that
the better performer in terms of gross profitability is Tesco. Sainsbury is not earning great
volume of profits and thus, it is important to taker the required corrective measures.
0
0.5
1
1.5
2
2.5
Chart Title
net profit ratio 2018 net profit ratio 2019
4. Gross profit margin: It is a narrower concept as compared to that of net profit margin.
This is due to the reason that net profit margin is considering every small indirect
expense in calculation of the ratio. On the other hand, gross profit margin is not
considering any indirect expense, it is just establishing relation between gross profit and
total revenue or sales. Gross profit is calculated by deducting only cost of goods sold
from the total receipt of sales. The main factor that is impacting this level of profitability
of the company is volume of sales and amount of indirect expenses. In the present
situation of real life companies, it can be inferred from the above table of calculation, that
the better performer in terms of gross profitability is Tesco. Sainsbury is not earning great
volume of profits and thus, it is important to taker the required corrective measures.
tesco sainsbury
0
0.5
1
1.5
2
2.5
Chart Title
gross profit ratio 2018 gross profit ratio 2019
5. Gearing ratio: The gearing ratio is a financial ratio that compares some form of owner's
equity (or capital) to debt, or funds borrowed by the company. Gearing is a measurement
of the entity’s financial leverage, which demonstrates the degree to which a firm's
activities are funded by shareholders' funds versus creditor's funds. The gearing ratio is a
measure of financial leverage that demonstrates the degree to which a firm's operations
are funded by equity capital versus debt financing. In the given case of Tesco and
Sainsbury, Tesco is having less burden of debt and on the other hand, Sainsbury is having
a very heavy burden of debt. Tesco has reduced the burden over two years and Sainsbury
has almost doubled it up.
2018 2019
gearing ratio
0
20
40
60
80
100
120
Chart Title
tesco sainsbury
⊘ This is a preview!⊘
Do you want full access?
Subscribe today to unlock all pages.
Trusted by 1+ million students worldwide
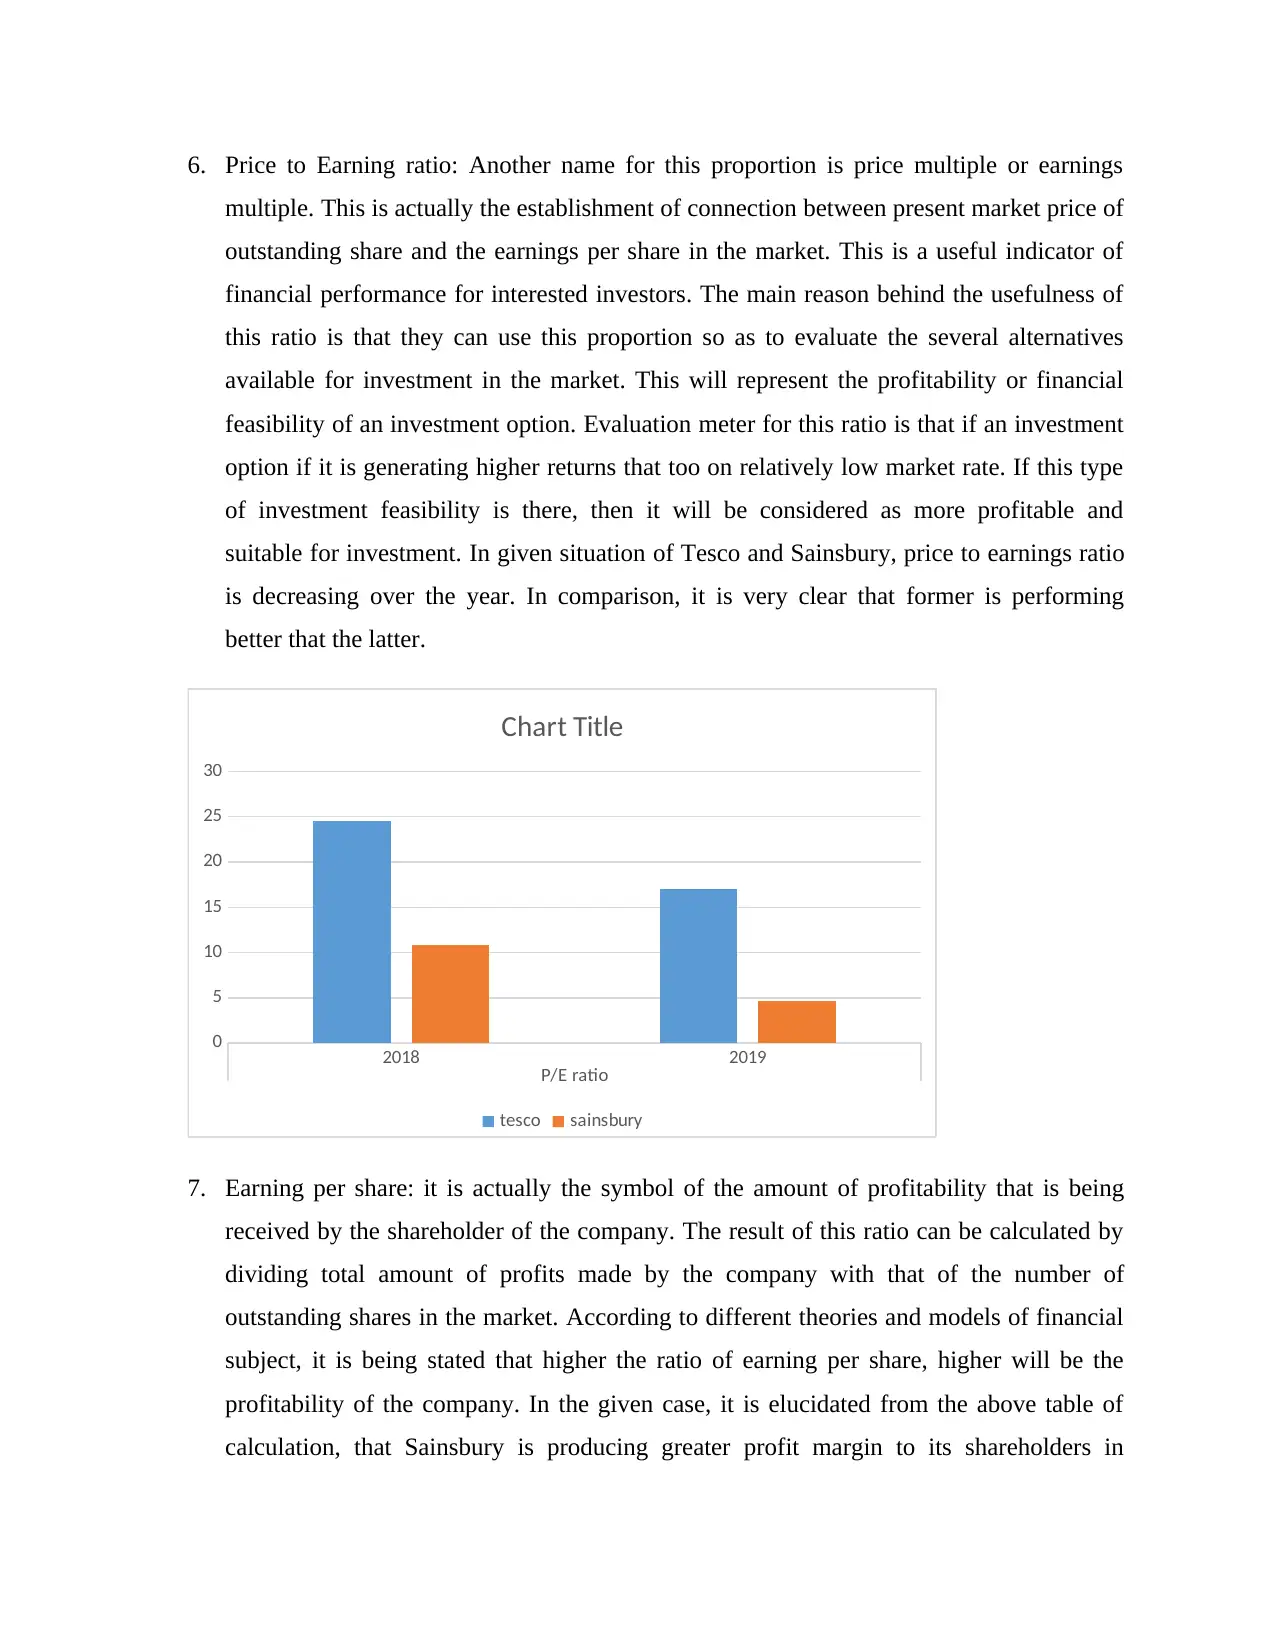
6. Price to Earning ratio: Another name for this proportion is price multiple or earnings
multiple. This is actually the establishment of connection between present market price of
outstanding share and the earnings per share in the market. This is a useful indicator of
financial performance for interested investors. The main reason behind the usefulness of
this ratio is that they can use this proportion so as to evaluate the several alternatives
available for investment in the market. This will represent the profitability or financial
feasibility of an investment option. Evaluation meter for this ratio is that if an investment
option if it is generating higher returns that too on relatively low market rate. If this type
of investment feasibility is there, then it will be considered as more profitable and
suitable for investment. In given situation of Tesco and Sainsbury, price to earnings ratio
is decreasing over the year. In comparison, it is very clear that former is performing
better that the latter.
2018 2019
P/E ratio
0
5
10
15
20
25
30
Chart Title
tesco sainsbury
7. Earning per share: it is actually the symbol of the amount of profitability that is being
received by the shareholder of the company. The result of this ratio can be calculated by
dividing total amount of profits made by the company with that of the number of
outstanding shares in the market. According to different theories and models of financial
subject, it is being stated that higher the ratio of earning per share, higher will be the
profitability of the company. In the given case, it is elucidated from the above table of
calculation, that Sainsbury is producing greater profit margin to its shareholders in
Paraphrase This Document
Need a fresh take? Get an instant paraphrase of this document with our AI Paraphraser
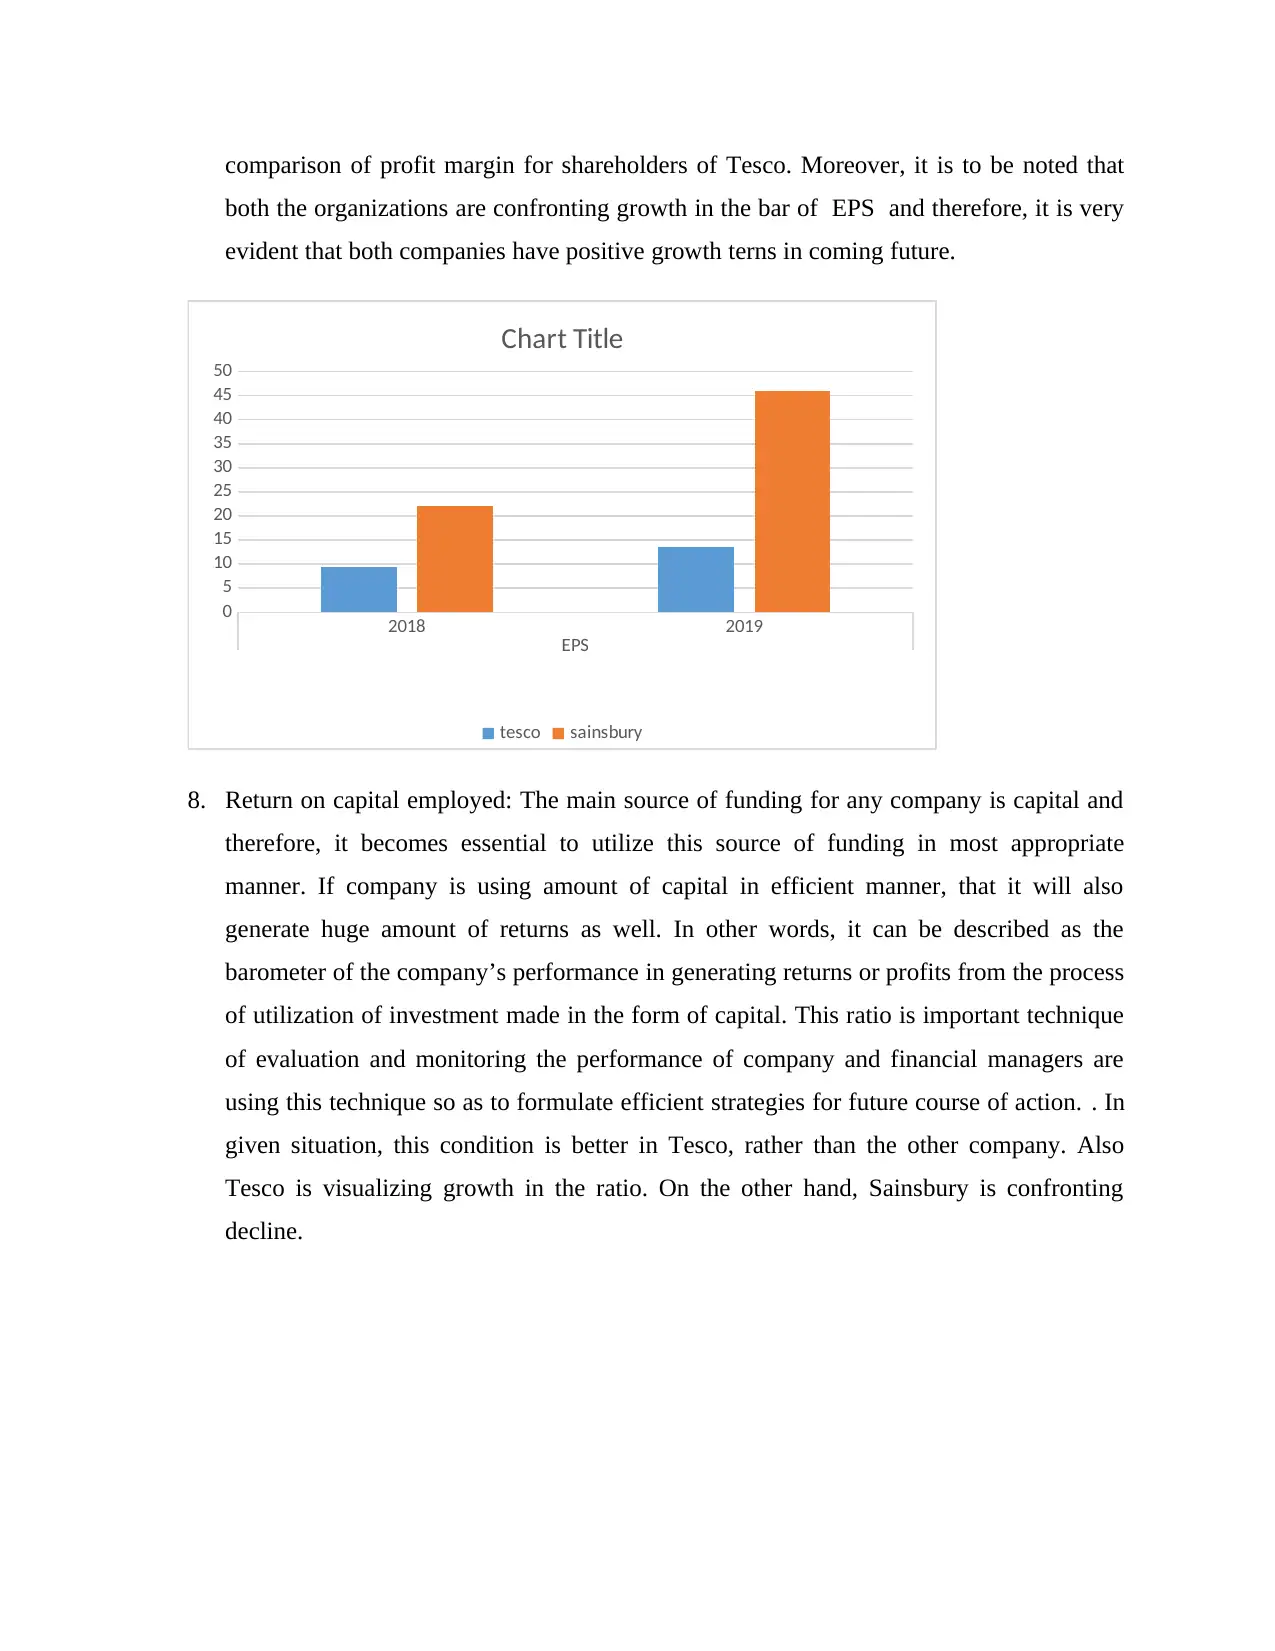
comparison of profit margin for shareholders of Tesco. Moreover, it is to be noted that
both the organizations are confronting growth in the bar of EPS and therefore, it is very
evident that both companies have positive growth terns in coming future.
2018 2019
EPS
0
5
10
15
20
25
30
35
40
45
50
Chart Title
tesco sainsbury
8. Return on capital employed: The main source of funding for any company is capital and
therefore, it becomes essential to utilize this source of funding in most appropriate
manner. If company is using amount of capital in efficient manner, that it will also
generate huge amount of returns as well. In other words, it can be described as the
barometer of the company’s performance in generating returns or profits from the process
of utilization of investment made in the form of capital. This ratio is important technique
of evaluation and monitoring the performance of company and financial managers are
using this technique so as to formulate efficient strategies for future course of action. . In
given situation, this condition is better in Tesco, rather than the other company. Also
Tesco is visualizing growth in the ratio. On the other hand, Sainsbury is confronting
decline.
2018 2019
ROCE
0
1
2
3
4
5
6
7
8
Chart Title
Tesco Sainsbury
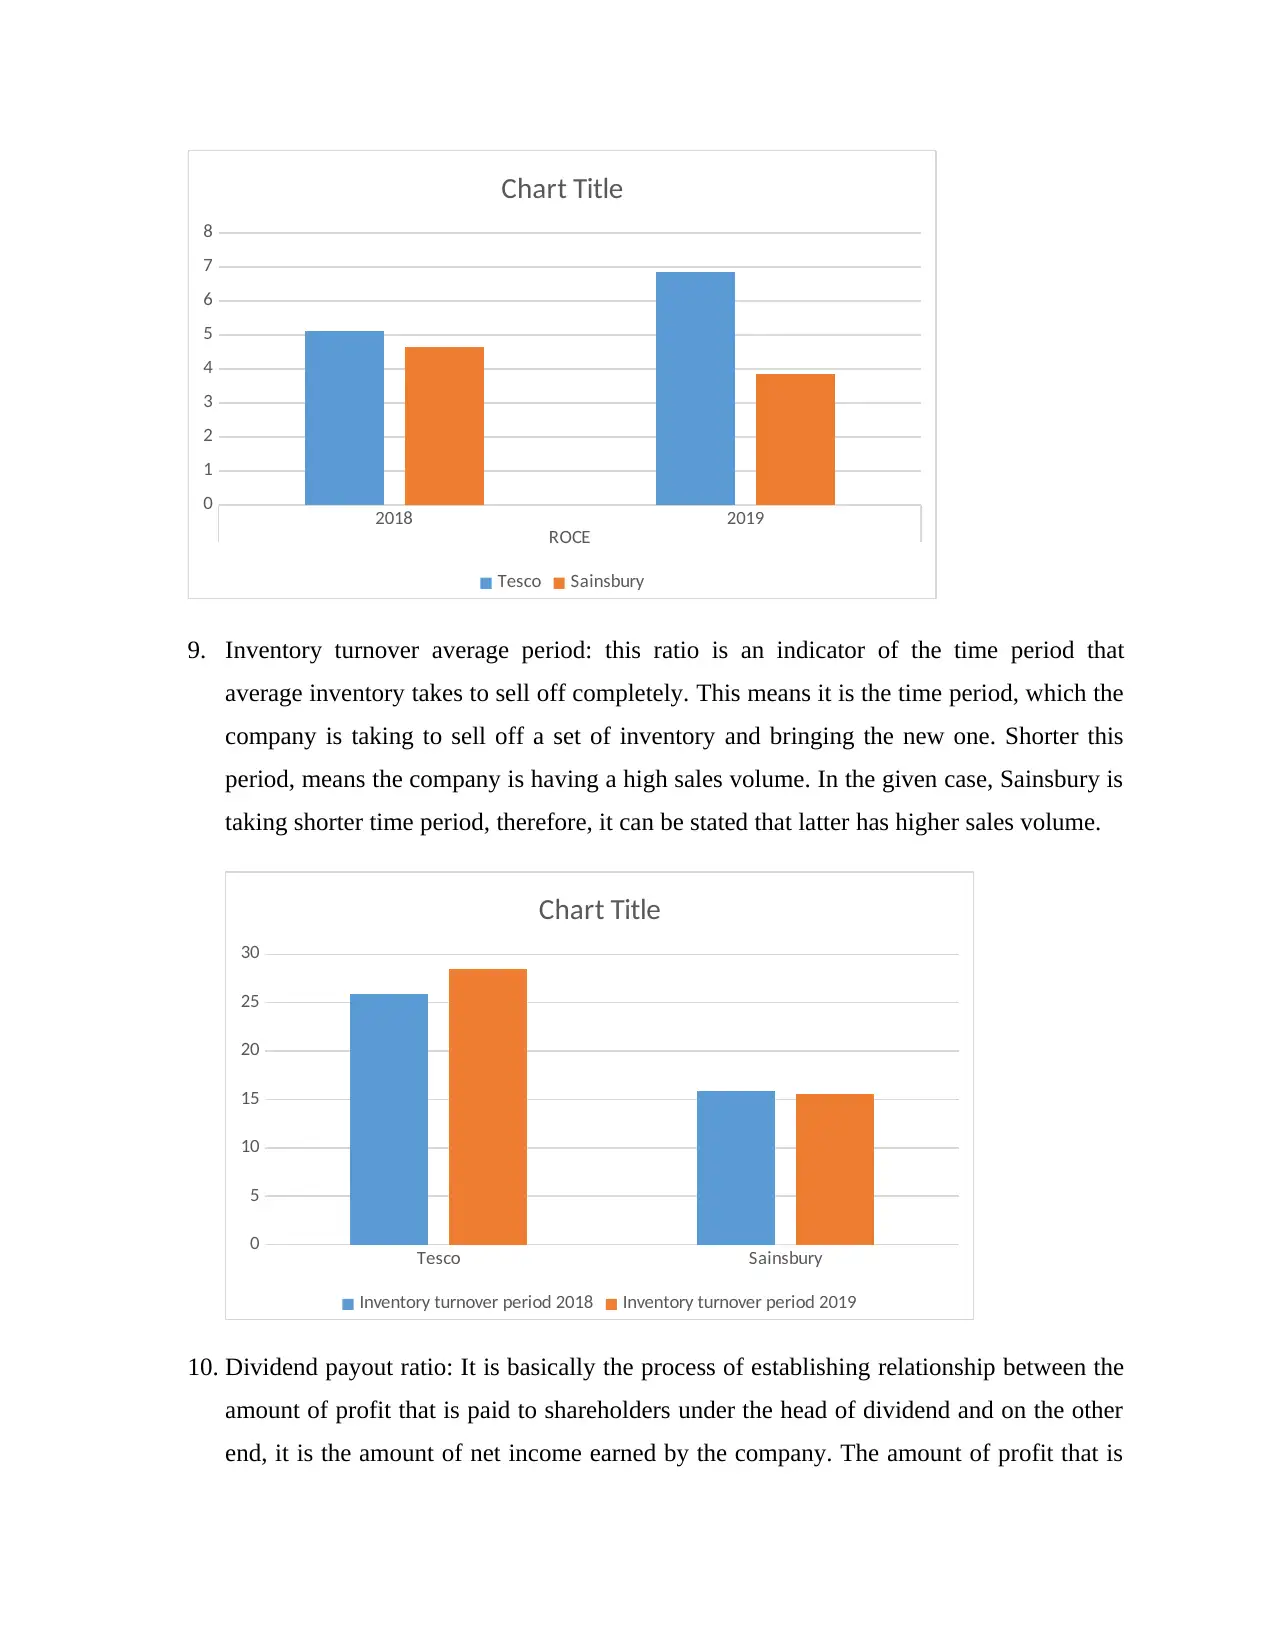
9. Inventory turnover average period: this ratio is an indicator of the time period that
average inventory takes to sell off completely. This means it is the time period, which the
company is taking to sell off a set of inventory and bringing the new one. Shorter this
period, means the company is having a high sales volume. In the given case, Sainsbury is
taking shorter time period, therefore, it can be stated that latter has higher sales volume.
Tesco Sainsbury
0
5
10
15
20
25
30
Chart Title
Inventory turnover period 2018 Inventory turnover period 2019
10. Dividend payout ratio: It is basically the process of establishing relationship between the
amount of profit that is paid to shareholders under the head of dividend and on the other
end, it is the amount of net income earned by the company. The amount of profit that is
ROCE
0
1
2
3
4
5
6
7
8
Chart Title
Tesco Sainsbury
9. Inventory turnover average period: this ratio is an indicator of the time period that
average inventory takes to sell off completely. This means it is the time period, which the
company is taking to sell off a set of inventory and bringing the new one. Shorter this
period, means the company is having a high sales volume. In the given case, Sainsbury is
taking shorter time period, therefore, it can be stated that latter has higher sales volume.
Tesco Sainsbury
0
5
10
15
20
25
30
Chart Title
Inventory turnover period 2018 Inventory turnover period 2019
10. Dividend payout ratio: It is basically the process of establishing relationship between the
amount of profit that is paid to shareholders under the head of dividend and on the other
end, it is the amount of net income earned by the company. The amount of profit that is
⊘ This is a preview!⊘
Do you want full access?
Subscribe today to unlock all pages.
Trusted by 1+ million students worldwide
1 out of 19
Related Documents


Your All-in-One AI-Powered Toolkit for Academic Success.
+13062052269
info@desklib.com
Available 24*7 on WhatsApp / Email
![[object Object]](/_next/static/media/star-bottom.7253800d.svg)
Unlock your academic potential
Copyright © 2020–2026 A2Z Services. All Rights Reserved. Developed and managed by ZUCOL.