Financial Portfolio Management: Comparing Methods and Analysis

Verified

Added on  2019/11/12

|4
|531
|198
Report
AI Summary
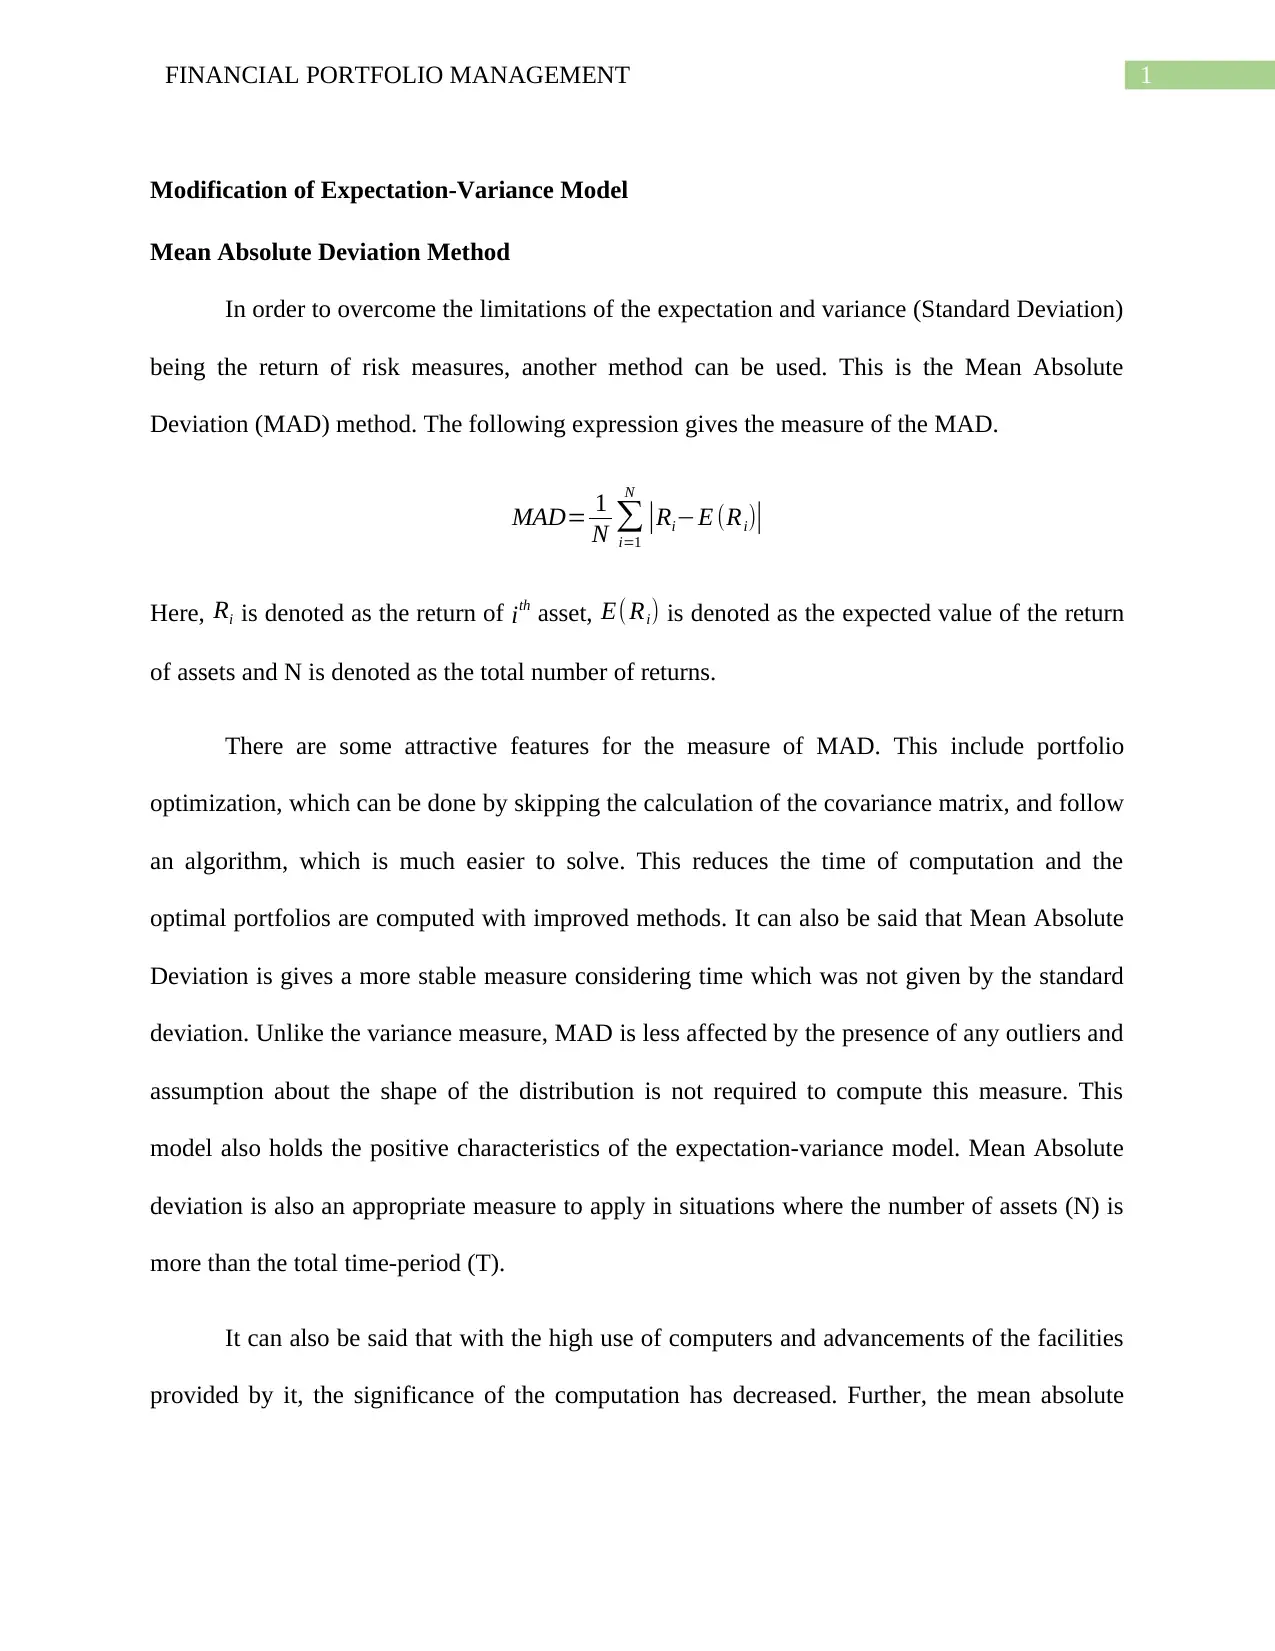
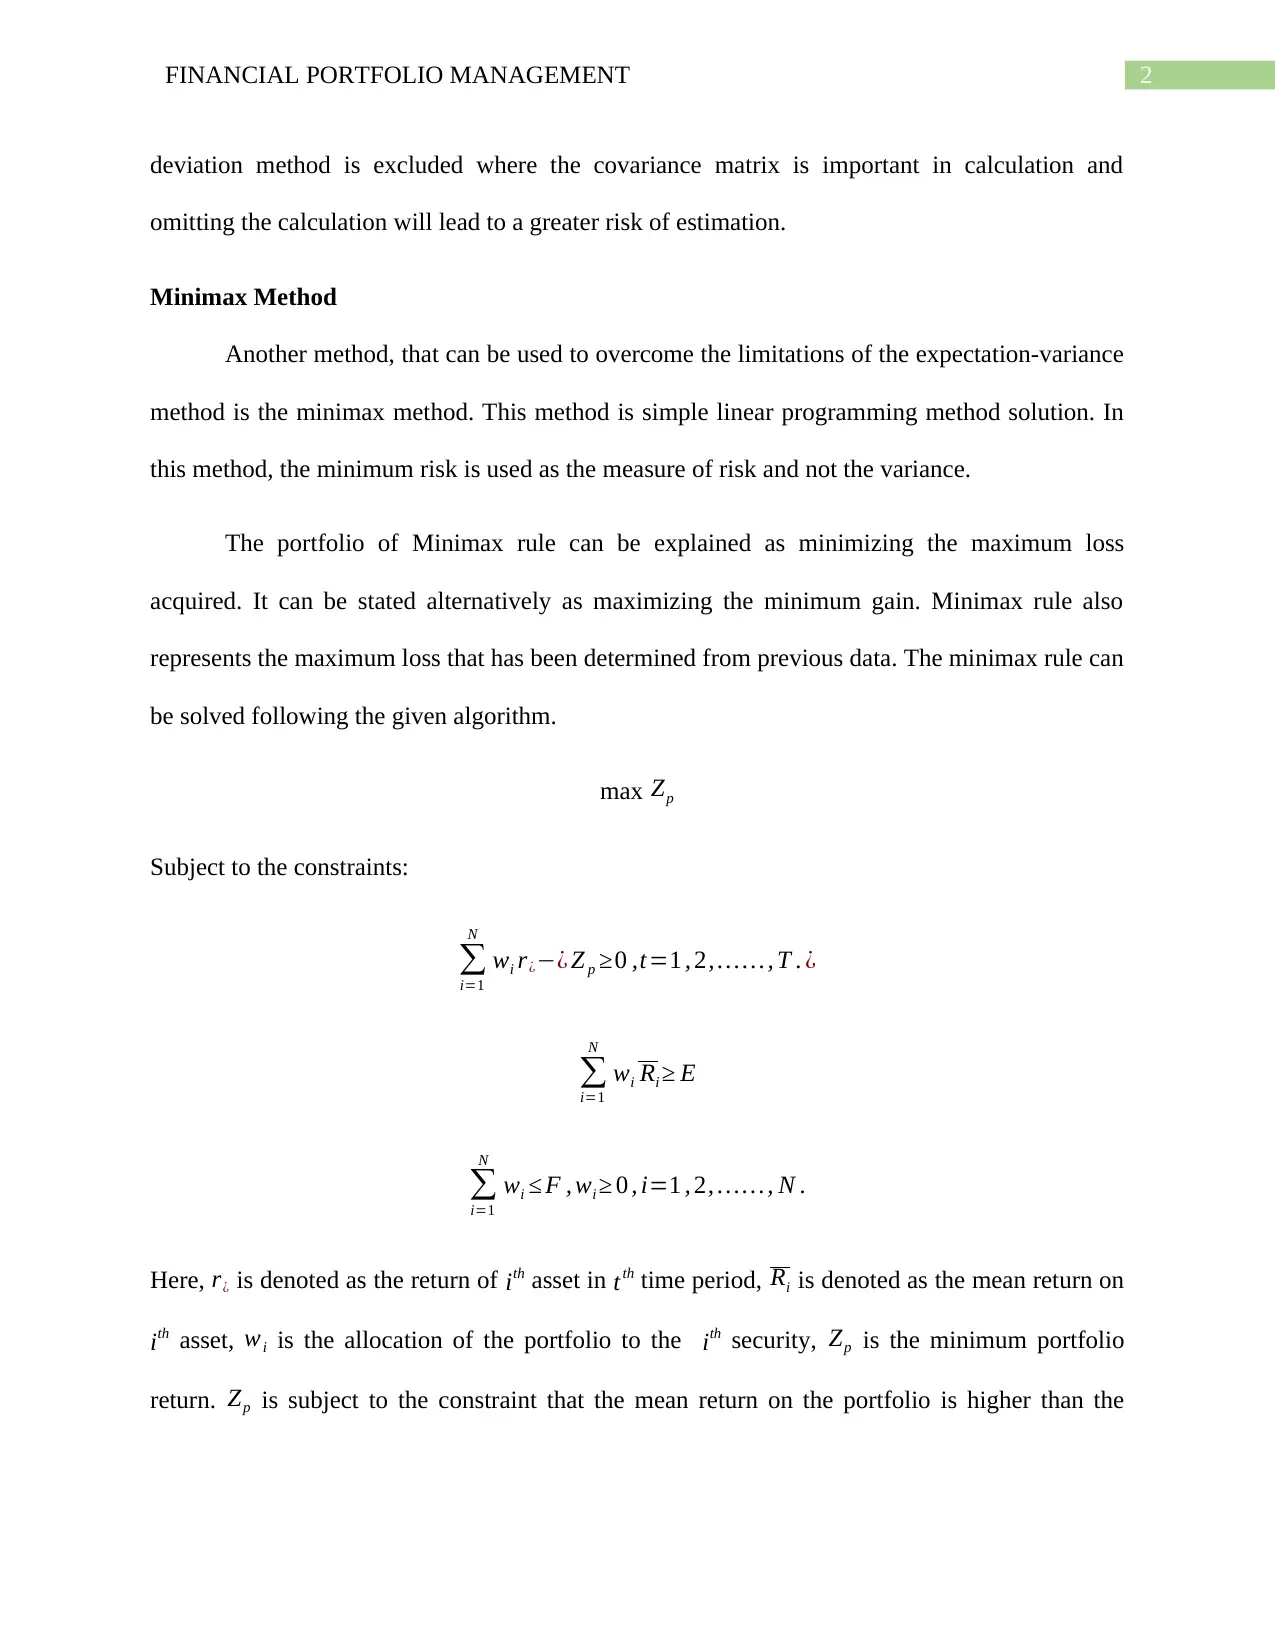
This report delves into the realm of financial portfolio management, exploring two key methodologies: Mean Absolute Deviation (MAD) and the Minimax method. The MAD method, presented as an alternative to the expectation-variance model, is highlighted for its ability to simplify portfolio optimization by circumventing the need for a covariance matrix, thereby reducing computational complexity. It is also noted for its relative stability over time and reduced sensitivity to outliers compared to standard deviation, making it suitable for scenarios with more assets than time periods. The Minimax method, another approach discussed, focuses on minimizing maximum loss or maximizing minimum gain. This method utilizes linear programming to determine the minimum risk associated with a portfolio and is explained through a specific algorithm with constraints. Both methods are analyzed in terms of their applications, strengths, and limitations within the broader context of financial portfolio management. The report aims to provide a comprehensive overview of these techniques for effective portfolio management and risk assessment.
Document Page
Running Head: FINANCIAL PORTFOLIO MANAGEMENT
Financial Portfolio Management
Name of the Student
Name of the University
Author Note
tabler-icon-diamond-filled.svg

Secure Best Marks with AI Grader

Need help grading? Try our AI Grader for instant feedback on your assignments.
Document Page
1FINANCIAL PORTFOLIO MANAGEMENT
Modification of Expectation-Variance Model
Mean Absolute Deviation Method
In order to overcome the limitations of the expectation and variance (Standard Deviation)
being the return of risk measures, another method can be used. This is the Mean Absolute
Deviation (MAD) method. The following expression gives the measure of the MAD.
MAD= 1
N
i=1
N
|RiE (Ri)|
Here, Ri is denoted as the return of ith asset, E( Ri) is denoted as the expected value of the return
of assets and N is denoted as the total number of returns.
There are some attractive features for the measure of MAD. This include portfolio
optimization, which can be done by skipping the calculation of the covariance matrix, and follow
an algorithm, which is much easier to solve. This reduces the time of computation and the
optimal portfolios are computed with improved methods. It can also be said that Mean Absolute
Deviation is gives a more stable measure considering time which was not given by the standard
deviation. Unlike the variance measure, MAD is less affected by the presence of any outliers and
assumption about the shape of the distribution is not required to compute this measure. This
model also holds the positive characteristics of the expectation-variance model. Mean Absolute
deviation is also an appropriate measure to apply in situations where the number of assets (N) is
more than the total time-period (T).
It can also be said that with the high use of computers and advancements of the facilities
provided by it, the significance of the computation has decreased. Further, the mean absolute
Document Page
2FINANCIAL PORTFOLIO MANAGEMENT
deviation method is excluded where the covariance matrix is important in calculation and
omitting the calculation will lead to a greater risk of estimation.
Minimax Method
Another method, that can be used to overcome the limitations of the expectation-variance
method is the minimax method. This method is simple linear programming method solution. In
this method, the minimum risk is used as the measure of risk and not the variance.
The portfolio of Minimax rule can be explained as minimizing the maximum loss
acquired. It can be stated alternatively as maximizing the minimum gain. Minimax rule also
represents the maximum loss that has been determined from previous data. The minimax rule can
be solved following the given algorithm.
max Zp
Subject to the constraints:

i=1
N
wi r¿¿ Z p 0 ,t=1 , 2, , T . ¿

i=1
N
wi Ri E

i=1
N
wi F , wi 0 , i=1 , 2, , N .
Here, r¿ is denoted as the return of ith asset in tth time period, Ri is denoted as the mean return on
ith asset, wi is the allocation of the portfolio to the ith security, Zp is the minimum portfolio
return. Zp is subject to the constraint that the mean return on the portfolio is higher than the
Document Page
3FINANCIAL PORTFOLIO MANAGEMENT
lower level which is given by E. Another constraint can be said to be the sum of the allocations
given to the portfolios are less than the total number of allocations, which is denoted by F.
chevron_up_icon
1 out of 4
circle_padding
hide_on_mobile
zoom_out_icon
[object Object]