Project Report: Technical and Fundamental Portfolio Analysis
VerifiedAdded on 2020/03/02
|34
|7743
|90
Project
AI Summary
This project report delves into the realm of advanced financial management by evaluating the performance of two distinct portfolios: one constructed using technical analysis and the other based on fundamental analysis. The report begins with an introduction that highlights the importance of both technical and fundamental analysis in selecting stocks and managing investments. The literature review provides a detailed overview of existing methodologies and challenges in stock analysis, covering efficient market theories, behavioral finance, and the application of modern portfolio theory. The methodology section outlines the approach used to analyze the stock market, focusing on the selection of data and analytical tools to draw conclusions on market trends and investment opportunities. The results and analysis section breaks down the two portfolios, with the fundamental portfolio utilizing PE multiple and dividend discount models to assess stock valuations, while the technical portfolio employs line charts and moving averages. The report evaluates the performance of each portfolio through specific activities, such as share purchases and sales, and concludes with an assessment of the effectiveness of each analytical approach. The report also includes essential components such as an introduction, literature review, rational and methodology, results, and analysis, along with conclusion and references.

RUNNING HEAD: ADVANCED FINANCIAL MANAGEMENT
1
Project Report
1
Project Report
Paraphrase This Document
Need a fresh take? Get an instant paraphrase of this document with our AI Paraphraser

ADVANCED FINANCIAL MANAGEMENT
2
Contents
Introduction.......................................................................................................................3
Literature Review.............................................................................................................3
Rational and methodology................................................................................................5
Result and analysis...........................................................................................................6
Fundamental portfolio......................................................................................................6
PE Multiple Models......................................................................................................6
Dividend discount model..............................................................................................6
Technical portfolio............................................................................................................7
Line chart......................................................................................................................7
Moving Average...........................................................................................................7
Evaluation of portfolio’s performance..............................................................................8
Activities in Fundamental Portfolio..............................................................................8
Activities in Technical Portfolio...................................................................................8
Evaluation of Performance of both the Portfolios........................................................8
Conclusion........................................................................................................................8
References.......................................................................................................................10
Appendix.........................................................................................................................12
ADVANCED FINANCIAL MANAGEMENT
3
Introduction:
It is crucial for an analyst or investor to select the shares for making an investment as
various skills and knowledge is required by the analyst to investigate over the risk and return
of the company. Usually, two methods are taken into consideration by the analyst to conduct
this study which is technical and fundamental analysis. In technical analysis, share prices are
analyzed and according to that and other factors, future movement is the share pricing is
depicted whereas in fundamental analysis, financial performance of the company is evaluated
and macro economic data is also investigated to analyze the future movements in share prices
of the company. In technical analysis and fundamental analysis, various tools are used.
However the most famous tools which have been used in this paper are moving average and
line chart (technical) and PE Multiple and dividend discount model (fundamental). In this
report paper, two portfolios have been prepared which includes 10 stocks each. Out of these
portfolios, one portfolio has been prepared according to the technical analysis and other one
has been prepared according to the fundamental analysis.
Literature Review:
The stock analysis for making an investment starts by evaluating the company’s
financial performance and position. Further, historical prices trends of the stock are analyzed
to make a better decision about the investment in the stock. Thus, two methods are taken into
consideration by the analyst to conduct this study which is technical and fundamental
analysis (Schlichting, 2013). These methods are quite crucial to analyze the stock. However,
it has been observed that various challenges are there which has been paused by efficient
market theories and behavioral finance theories in which the analysis of stock and selection
stocks is done. The efficient market hypothesis theory and behavioral finance theory provide
an observation about the market (Schlichting, 2013). Even the stock selection by delivering
out a complete analysis of fundamental aspects and technical aspects could not be avoided by
the possibility of beating when behavioral finance influences persist.
The theories of finance and fundamental concepts like Harry Markowitz’s modern
portfolio theory and Sharpe’s capital asset pricing model have offered a strong basis to
investigate over the selection of the stocks and performance of the stock (Elton, et al., 2009).
The above fundamental theories are based on a belief that entire investors act realistically.
Further, fundamental theories also assume that the stock market is efficient and always
remain similar all the times due to the reason that the entire required information is accessible
⊘ This is a preview!⊘
Do you want full access?
Subscribe today to unlock all pages.
Trusted by 1+ million students worldwide
ADVANCED FINANCIAL MANAGEMENT
4
by all the participants in the market all the times (Elton, et al., 2009). Though, the behavioral
finance theory opposes the observation that entire investors are sensible. Further, efficient
market hypothesis theory depict that the view of capital markets are always efficient. It must
be kept in brain that the models and techniques which has been used in fundamental analysis
and technical analyzes are always based on an assumption that the investors are sensible and
capital markets are resourceful (Schlichting, 2013).
Thus, the conflicts are always existed among the fundamental results and technical
results and the behavioral finance results and efficient market theories results. The investors
struggle to hit the market by investigating over the stocks which are methodically covering
the fundamental and technical aspects, but the EMH states that it is not easy to beat the
market (Ackert and Deaves, 2009). Additionally, the behavioral finance concepts states that
investors could not always be sensible which depicts that the decisions made by them for
buying and selling the stocks could not always be validated on the fundamental analysis and
technical analysis. The choice of investors to buy and sale the shares are sometimes affected
by behavioral power (Ackert and Deaves, 2009). Such as in the year of 2008 when the global
financial crisis has taken place in USA and affected the economy of USA as well as other
countries like United Kingdom (UK), China and Australia.
The fundamental concepts depicts that the financial crisis of USA in 2008 must have
affected the US only, but it left an impression over the entire world. The worldwide capital
markets went into gloominess when the global financial crisis has been encountered in the US
(Baker and Nofsinger, 2010). The main reason behind this gloominess in all the capital
markets and economy was the behavioral influences. It has been observed that when the
United States stocks had fell down, the other company’s investors such as the UK, Australia
and China had also begun to lose their faith and they have started selling their hold stock.
And thus the huge selling made the company weak and it directly made an impact over the
share price of the company (Baker and Nofsinger, 2010).
The behavioral finance mainly affects over the understanding of capital markets, the
EMH also offers sight of another side of the capital market. The behavioral finance principle
states that investor could not be sensible and the EMH depicts that the capital market could
not be unproductive (Kurth, 2013). The EMH theory is based on an idea that the securities
prices incorporate entire required information, and thus, it become impossible for investors to
take benefit of the information gap and with the help of it, make excessive gains. In other
Paraphrase This Document
Need a fresh take? Get an instant paraphrase of this document with our AI Paraphraser
ADVANCED FINANCIAL MANAGEMENT
5
words, the EMH depicts that the investors could not find the securities undervalued or
overvalued to make chances to earn more profits. though, the financial fundamental concepts
has been established in the CAPM and Gordon’s growth rate model which provides an idea
that the securities could be overvalued or undervalued in the market. Financial fundamental
principles depicts that the securities which are trading in the market could not always be
traded in their faire value (Kurth, 2013).
Rational and methodology:
The methodology includes entire framework which helps in selecting the data and
analytical equipments to draw a conclusion from the selected information. It is crucial to
adopt a suitable methodology for completing the research work in a very effective and
efficient manner. In this report the capital market has been taken into consideration, in which
the stock has been analyzed, and it has found out that whether the selected stocks would be
able to beat the market or not (Phillips and Stawarski, 2016). The selected methodology for
this report comprises stock selection’s two primary methods which are fundamental and
technical methods. The fundamental analysis and technical analysis offers different concept
which are based on diverse parameters of selecting the stocks (Palicka, 2011). Since, as both
methods are based on diverse principles and concepts so, none no method is superior on
other.
In fact, it could be said that both the methods such as technical and fundamental could
be known as each other’s complementary method. The fundamental analysis outcomes in
stocks selection which are quite strong in context of financial performance at the same time
the technical analysis focuses over the growth in the prices along with the financial
performance of the company which offers them the best basis to choose a good stock
(Palicka, 2011). For this report, it has been found that the stock of Keppel Corporation which
is financial strong as the return of the company is quite strong (Yahoo finance, 2017).
Further, according to the fundamental analysis it has been comprised that the stock named by
Courts Asia Limited is quite strong as the return of the equity is 8.83% (Yahoo finance,
2017). Hence, the fundamental analysis over the selection of the stocks would be good in
context of the financial performance. At the same time the stocks which have been selected
according to the technical analysis would also offer a good return to the shareholders
(Palicka, 2011).
ADVANCED FINANCIAL MANAGEMENT
6
It has been observed that it is a good choice for the analyst and investors to analyze
the stock according to both the methods as due to it, the result would be sensible and it would
help the investor to make a better investment. According to the current research, 2 portfolios
have been prepared which includes 20 stocks which have been selected according to the
fundamental and technical analysis.
Result and analysis:
Fundamental portfolio:
Fundamental portfolio has been prepared according to the two main tools of
fundamental methods which are Dividend discount model and PE multiple methods. In this
report, the stock which has been named by great Eastern limited has been taken into
consideration for PE multiple model and dividend discount model.
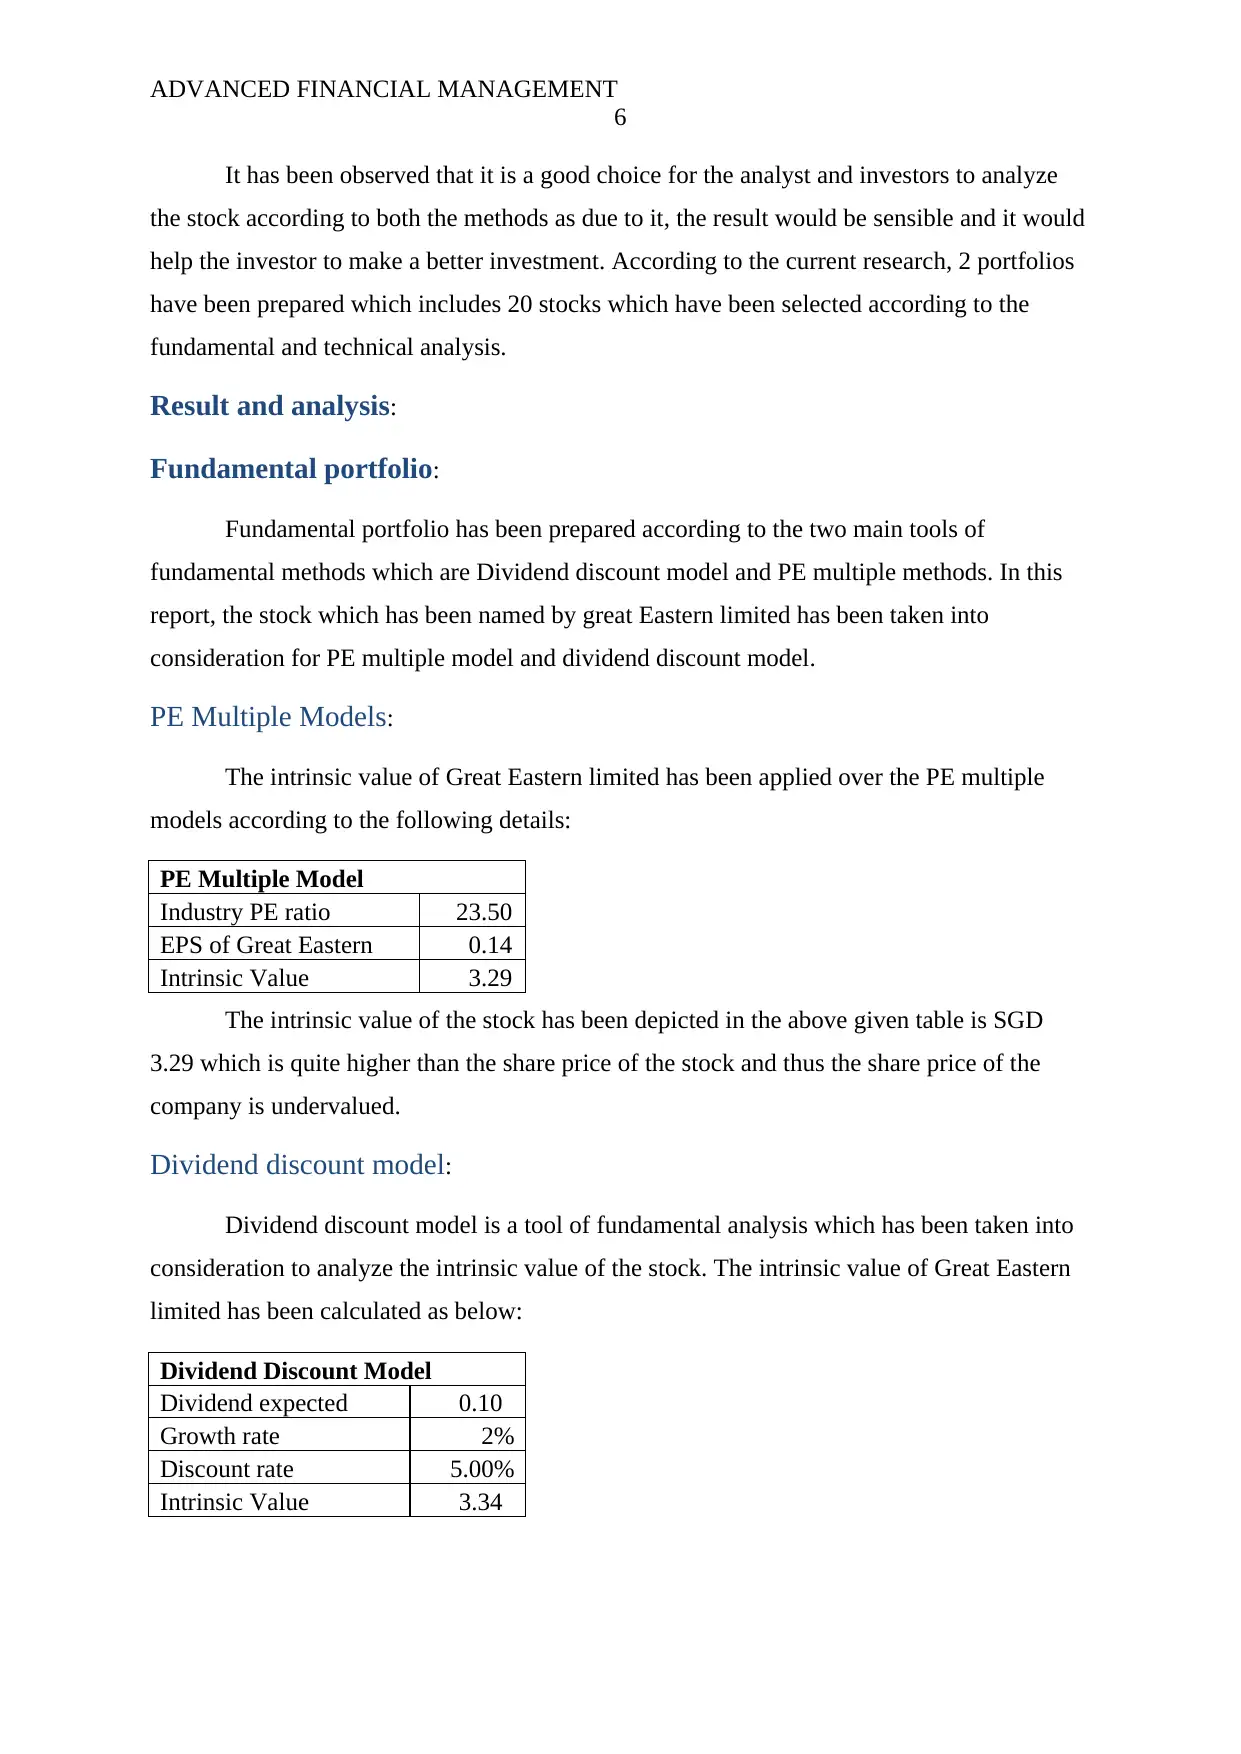
PE Multiple Models:
The intrinsic value of Great Eastern limited has been applied over the PE multiple
models according to the following details:
PE Multiple Model
Industry PE ratio 23.50
EPS of Great Eastern 0.14
Intrinsic Value 3.29
The intrinsic value of the stock has been depicted in the above given table is SGD
3.29 which is quite higher than the share price of the stock and thus the share price of the
company is undervalued.
Dividend discount model:
Dividend discount model is a tool of fundamental analysis which has been taken into
consideration to analyze the intrinsic value of the stock. The intrinsic value of Great Eastern
limited has been calculated as below:
Dividend Discount Model
Dividend expected 0.10
Growth rate 2%
Discount rate 5.00%
Intrinsic Value 3.34
6
It has been observed that it is a good choice for the analyst and investors to analyze
the stock according to both the methods as due to it, the result would be sensible and it would
help the investor to make a better investment. According to the current research, 2 portfolios
have been prepared which includes 20 stocks which have been selected according to the
fundamental and technical analysis.
Result and analysis:
Fundamental portfolio:
Fundamental portfolio has been prepared according to the two main tools of
fundamental methods which are Dividend discount model and PE multiple methods. In this
report, the stock which has been named by great Eastern limited has been taken into
consideration for PE multiple model and dividend discount model.
PE Multiple Models:
The intrinsic value of Great Eastern limited has been applied over the PE multiple
models according to the following details:
PE Multiple Model
Industry PE ratio 23.50
EPS of Great Eastern 0.14
Intrinsic Value 3.29
The intrinsic value of the stock has been depicted in the above given table is SGD
3.29 which is quite higher than the share price of the stock and thus the share price of the
company is undervalued.
Dividend discount model:
Dividend discount model is a tool of fundamental analysis which has been taken into
consideration to analyze the intrinsic value of the stock. The intrinsic value of Great Eastern
limited has been calculated as below:
Dividend Discount Model
Dividend expected 0.10
Growth rate 2%
Discount rate 5.00%
Intrinsic Value 3.34
⊘ This is a preview!⊘
Do you want full access?
Subscribe today to unlock all pages.
Trusted by 1+ million students worldwide
ADVANCED FINANCIAL MANAGEMENT
7
It has been observed through this model that the intrinsic value of the stock is SGD
3.34 which is depicting that the stock is overvalued as the current market price of the
company is quite lower than the intrinsic value of the company.
Technical portfolio:
Technical analysis is most common used model. Technical portfolio has been
prepared according to the two main tools of technical methods which are line chart and
moving average. In this report, the stock which has been named by Frasers Centre point
limited has been taken into consideration for Line chart model and moving average model.
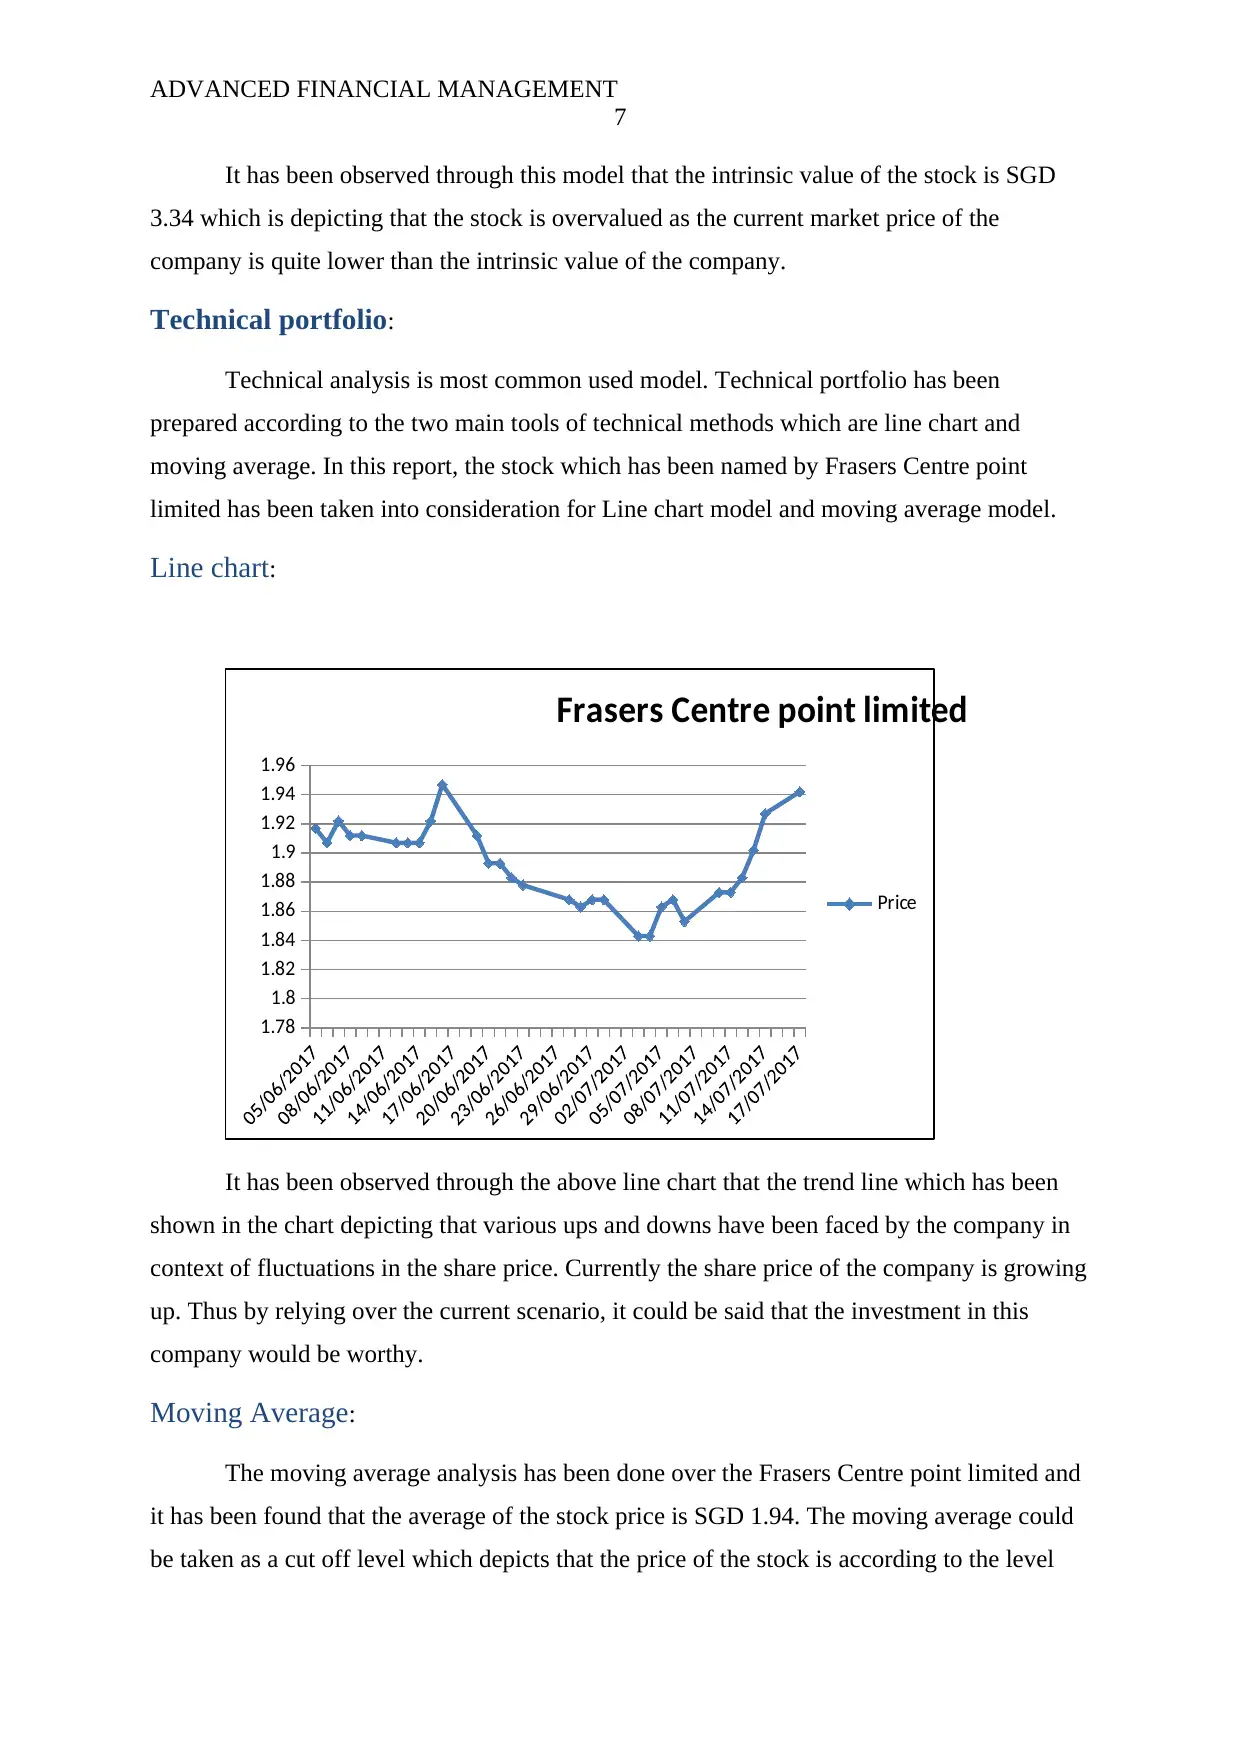
Line chart:
1.78
1.8
1.82
1.84
1.86
1.88
1.9
1.92
1.94
1.96
Frasers Centre point limited
Price
It has been observed through the above line chart that the trend line which has been
shown in the chart depicting that various ups and downs have been faced by the company in
context of fluctuations in the share price. Currently the share price of the company is growing
up. Thus by relying over the current scenario, it could be said that the investment in this
company would be worthy.
Moving Average:
The moving average analysis has been done over the Frasers Centre point limited and
it has been found that the average of the stock price is SGD 1.94. The moving average could
be taken as a cut off level which depicts that the price of the stock is according to the level
7
It has been observed through this model that the intrinsic value of the stock is SGD
3.34 which is depicting that the stock is overvalued as the current market price of the
company is quite lower than the intrinsic value of the company.
Technical portfolio:
Technical analysis is most common used model. Technical portfolio has been
prepared according to the two main tools of technical methods which are line chart and
moving average. In this report, the stock which has been named by Frasers Centre point
limited has been taken into consideration for Line chart model and moving average model.
Line chart:
1.78
1.8
1.82
1.84
1.86
1.88
1.9
1.92
1.94
1.96
Frasers Centre point limited
Price
It has been observed through the above line chart that the trend line which has been
shown in the chart depicting that various ups and downs have been faced by the company in
context of fluctuations in the share price. Currently the share price of the company is growing
up. Thus by relying over the current scenario, it could be said that the investment in this
company would be worthy.
Moving Average:
The moving average analysis has been done over the Frasers Centre point limited and
it has been found that the average of the stock price is SGD 1.94. The moving average could
be taken as a cut off level which depicts that the price of the stock is according to the level
Paraphrase This Document
Need a fresh take? Get an instant paraphrase of this document with our AI Paraphraser
ADVANCED FINANCIAL MANAGEMENT
8
and thus there are quite more chances for the stock price to be enhanced. Thus by relying
over the current scenario, it could be said that the investment in this company would be
worthy.
Evaluation of portfolio’s performance:
Activities in Fundamental Portfolio
Two activities have been performed in preparing the fundamental portfolio. Under the
first activity, 500 shares of Jardine Cycle and Carriage Limited have been bought at the rate
of S$41.34 per share on June 25, 2017. The decision to buy 500 shares of Jardine Cycle and
Carriage Limited has been taken to manage the profits to sell those shares in the peak season.
Further, under the second activity, 5000 shares of Wilmar international Limited has been
purchased on August 5, 2017 at the rate of S$3.6201 (Appendix-2). The amount which has
been received on selling the 300 shares of Jardine Cycle and Carriage Limited has been used
in buying the shares of Wilmar international Limited. Looking at the fundamentals of Wilmar
international Limited, it has been estimated that the stock would grow in near future therefore
the decision to enhance the holdings more in the company has been made.
Activities in Technical Portfolio
Two activities have been performed in preparing the technical portfolio also. Under
the first activity, 1000 shares of Frasers Centre point Limited had bought on August 5, 2017
at the rate of S$ 2.201 (Appendix-2). It has been observed that the stock price has been
decreased; as a result, the decision of buying more shares have been taken as it would offer
more profit to the company. Under the second activity, the funds which have been released
from Frasers Centre point Limited has been deployed in buying the shares of Tiong Seng
Holdings limited on August 20, 2017. The preliminary analysis of Frasers Centre point
Limited showed probable in the stock; accordingly, it has been considered the finest option to
organize the released amounts.
Evaluation of Performance of both the Portfolios
Through the above analysis it has been found that both the portfolios would be offer
more profits of the investors as the portfolios have been set after considering and analyzing
every single aspect of the stock and various tools have been used for this report.
Conclusion:

ADVANCED FINANCIAL MANAGEMENT
9
Thus through this report, it could be concluded that both the portfolios are quite
impressive and would offer he profit to the investor as the portfolios have been set after
considering and analyzing every single aspect of the stock and various tools have been used
for this report.
9
Thus through this report, it could be concluded that both the portfolios are quite
impressive and would offer he profit to the investor as the portfolios have been set after
considering and analyzing every single aspect of the stock and various tools have been used
for this report.
⊘ This is a preview!⊘
Do you want full access?
Subscribe today to unlock all pages.
Trusted by 1+ million students worldwide
ADVANCED FINANCIAL MANAGEMENT
10
References:
Ackert, L. and Deaves, R. 2009. Behavioral Finance: Psychology, Decision-Making, and
Markets. Cengage Learning.
Baker, H.K. and Nofsinger, J.R. 2010. Behavioral Finance: Investors, Corporations, and
Markets. John Wiley & Sons.
Elton, E.J., Gruber, M.J., Brown, S.J., and Goetzmann, W.N. 2009. Modern Portfolio Theory
and Investment Analysis. John Wiley & Sons.
Kinsky, R. 2011. Charting Made Simple: A Beginner's Guide to Technical Analysis. John
Wiley & Sons.
Krantz, M. 2016. Fundamental Analysis for Dummies. John Wiley & Sons.
Kurth, S. 2013. Critical Review about Implications of the Efficient Market Hypothesis. GRIN
Verlag.
Madura, J. 2014. Financial Markets and Institutions. Cengage Learning.
Palicka, V.J. 2011. Fusion Analysis: Merging Fundamental and Technical Analysis for Risk-
Adjusted Excess Returns. McGraw Hill Professional.
Phillips, P.P. and Stawarski, C.A. 2016. Data Collection: Planning for and Collecting All
Types of Data. John Wiley & Sons.
Schlichting, T. 2013. Fundamental Analysis, Behavioral Finance and Technical Analysis on
the Stock Market. GRIN Verlag.
Yahoo finance. 2017. Frasers centre point limited. [Online]. Available at:
https://in.finance.yahoo.com/q/ks?s=C31.SI [Accessed on: 4 September 2017].
Paraphrase This Document
Need a fresh take? Get an instant paraphrase of this document with our AI Paraphraser

ADVANCED FINANCIAL MANAGEMENT
11
Yahoo finance. 2017. Jardine Cycle and carriage limited. [Online]. Available at:
https://sg.finance.yahoo.com/quote/RE2.SI/key-statistics?p=RE2.SI [Accessed on: 04 Sept
2017].
11
Yahoo finance. 2017. Jardine Cycle and carriage limited. [Online]. Available at:
https://sg.finance.yahoo.com/quote/RE2.SI/key-statistics?p=RE2.SI [Accessed on: 04 Sept
2017].
ADVANCED FINANCIAL MANAGEMENT
12
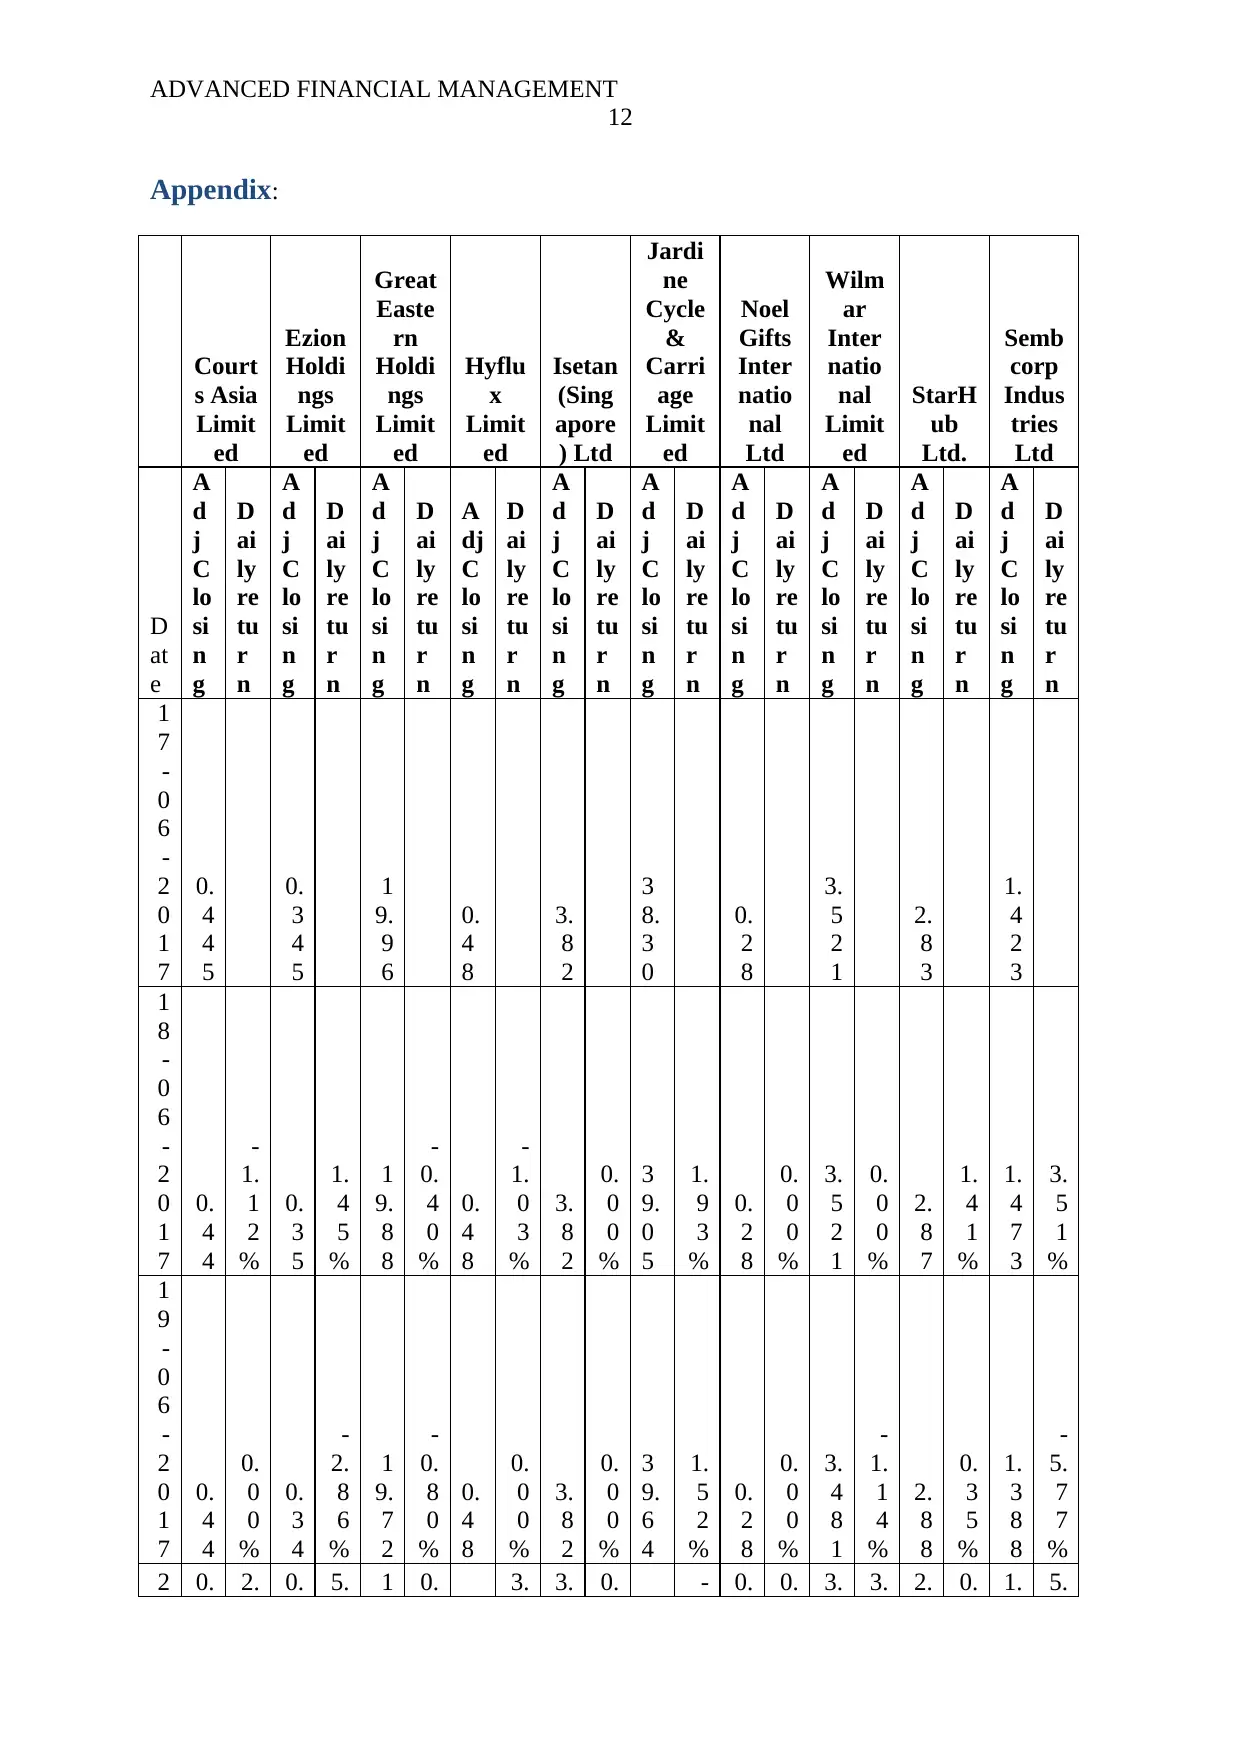
Appendix:
Court
s Asia
Limit
ed
Ezion
Holdi
ngs
Limit
ed
Great
Easte
rn
Holdi
ngs
Limit
ed
Hyflu
x
Limit
ed
Isetan
(Sing
apore
) Ltd
Jardi
ne
Cycle
&
Carri
age
Limit
ed
Noel
Gifts
Inter
natio
nal
Ltd
Wilm
ar
Inter
natio
nal
Limit
ed
StarH
ub
Ltd.
Semb
corp
Indus
tries
Ltd
D
at
e
A
d
j
C
lo
si
n
g
D
ai
ly
re
tu
r
n
A
d
j
C
lo
si
n
g
D
ai
ly
re
tu
r
n
A
d
j
C
lo
si
n
g
D
ai
ly
re
tu
r
n
A
dj
C
lo
si
n
g
D
ai
ly
re
tu
r
n
A
d
j
C
lo
si
n
g
D
ai
ly
re
tu
r
n
A
d
j
C
lo
si
n
g
D
ai
ly
re
tu
r
n
A
d
j
C
lo
si
n
g
D
ai
ly
re
tu
r
n
A
d
j
C
lo
si
n
g
D
ai
ly
re
tu
r
n
A
d
j
C
lo
si
n
g
D
ai
ly
re
tu
r
n
A
d
j
C
lo
si
n
g
D
ai
ly
re
tu
r
n
1
7
-
0
6
-
2
0
1
7
0.
4
4
5
0.
3
4
5
1
9.
9
6
0.
4
8
3.
8
2
3
8.
3
0
0.
2
8
3.
5
2
1
2.
8
3
1.
4
2
3
1
8
-
0
6
-
2
0
1
7
0.
4
4
-
1.
1
2
%
0.
3
5
1.
4
5
%
1
9.
8
8
-
0.
4
0
%
0.
4
8
-
1.
0
3
%
3.
8
2
0.
0
0
%
3
9.
0
5
1.
9
3
%
0.
2
8
0.
0
0
%
3.
5
2
1
0.
0
0
%
2.
8
7
1.
4
1
%
1.
4
7
3
3.
5
1
%
1
9
-
0
6
-
2
0
1
7
0.
4
4
0.
0
0
%
0.
3
4
-
2.
8
6
%
1
9.
7
2
-
0.
8
0
%
0.
4
8
0.
0
0
%
3.
8
2
0.
0
0
%
3
9.
6
4
1.
5
2
%
0.
2
8
0.
0
0
%
3.
4
8
1
-
1.
1
4
%
2.
8
8
0.
3
5
%
1.
3
8
8
-
5.
7
7
%
2 0. 2. 0. 5. 1 0. 3. 3. 0. - 0. 0. 3. 3. 2. 0. 1. 5.
12
Appendix:
Court
s Asia
Limit
ed
Ezion
Holdi
ngs
Limit
ed
Great
Easte
rn
Holdi
ngs
Limit
ed
Hyflu
x
Limit
ed
Isetan
(Sing
apore
) Ltd
Jardi
ne
Cycle
&
Carri
age
Limit
ed
Noel
Gifts
Inter
natio
nal
Ltd
Wilm
ar
Inter
natio
nal
Limit
ed
StarH
ub
Ltd.
Semb
corp
Indus
tries
Ltd
D
at
e
A
d
j
C
lo
si
n
g
D
ai
ly
re
tu
r
n
A
d
j
C
lo
si
n
g
D
ai
ly
re
tu
r
n
A
d
j
C
lo
si
n
g
D
ai
ly
re
tu
r
n
A
dj
C
lo
si
n
g
D
ai
ly
re
tu
r
n
A
d
j
C
lo
si
n
g
D
ai
ly
re
tu
r
n
A
d
j
C
lo
si
n
g
D
ai
ly
re
tu
r
n
A
d
j
C
lo
si
n
g
D
ai
ly
re
tu
r
n
A
d
j
C
lo
si
n
g
D
ai
ly
re
tu
r
n
A
d
j
C
lo
si
n
g
D
ai
ly
re
tu
r
n
A
d
j
C
lo
si
n
g
D
ai
ly
re
tu
r
n
1
7
-
0
6
-
2
0
1
7
0.
4
4
5
0.
3
4
5
1
9.
9
6
0.
4
8
3.
8
2
3
8.
3
0
0.
2
8
3.
5
2
1
2.
8
3
1.
4
2
3
1
8
-
0
6
-
2
0
1
7
0.
4
4
-
1.
1
2
%
0.
3
5
1.
4
5
%
1
9.
8
8
-
0.
4
0
%
0.
4
8
-
1.
0
3
%
3.
8
2
0.
0
0
%
3
9.
0
5
1.
9
3
%
0.
2
8
0.
0
0
%
3.
5
2
1
0.
0
0
%
2.
8
7
1.
4
1
%
1.
4
7
3
3.
5
1
%
1
9
-
0
6
-
2
0
1
7
0.
4
4
0.
0
0
%
0.
3
4
-
2.
8
6
%
1
9.
7
2
-
0.
8
0
%
0.
4
8
0.
0
0
%
3.
8
2
0.
0
0
%
3
9.
6
4
1.
5
2
%
0.
2
8
0.
0
0
%
3.
4
8
1
-
1.
1
4
%
2.
8
8
0.
3
5
%
1.
3
8
8
-
5.
7
7
%
2 0. 2. 0. 5. 1 0. 3. 3. 0. - 0. 0. 3. 3. 2. 0. 1. 5.
⊘ This is a preview!⊘
Do you want full access?
Subscribe today to unlock all pages.
Trusted by 1+ million students worldwide
1 out of 34
Related Documents


Your All-in-One AI-Powered Toolkit for Academic Success.
+13062052269
info@desklib.com
Available 24*7 on WhatsApp / Email
![[object Object]](/_next/static/media/star-bottom.7253800d.svg)
Unlock your academic potential
Copyright © 2020–2026 A2Z Services. All Rights Reserved. Developed and managed by ZUCOL.