Comprehensive Financial Portfolio Analysis: CAPM and Optimization

Verified

Added on  2019/09/18

|8
|958
|255
Project
AI Summary
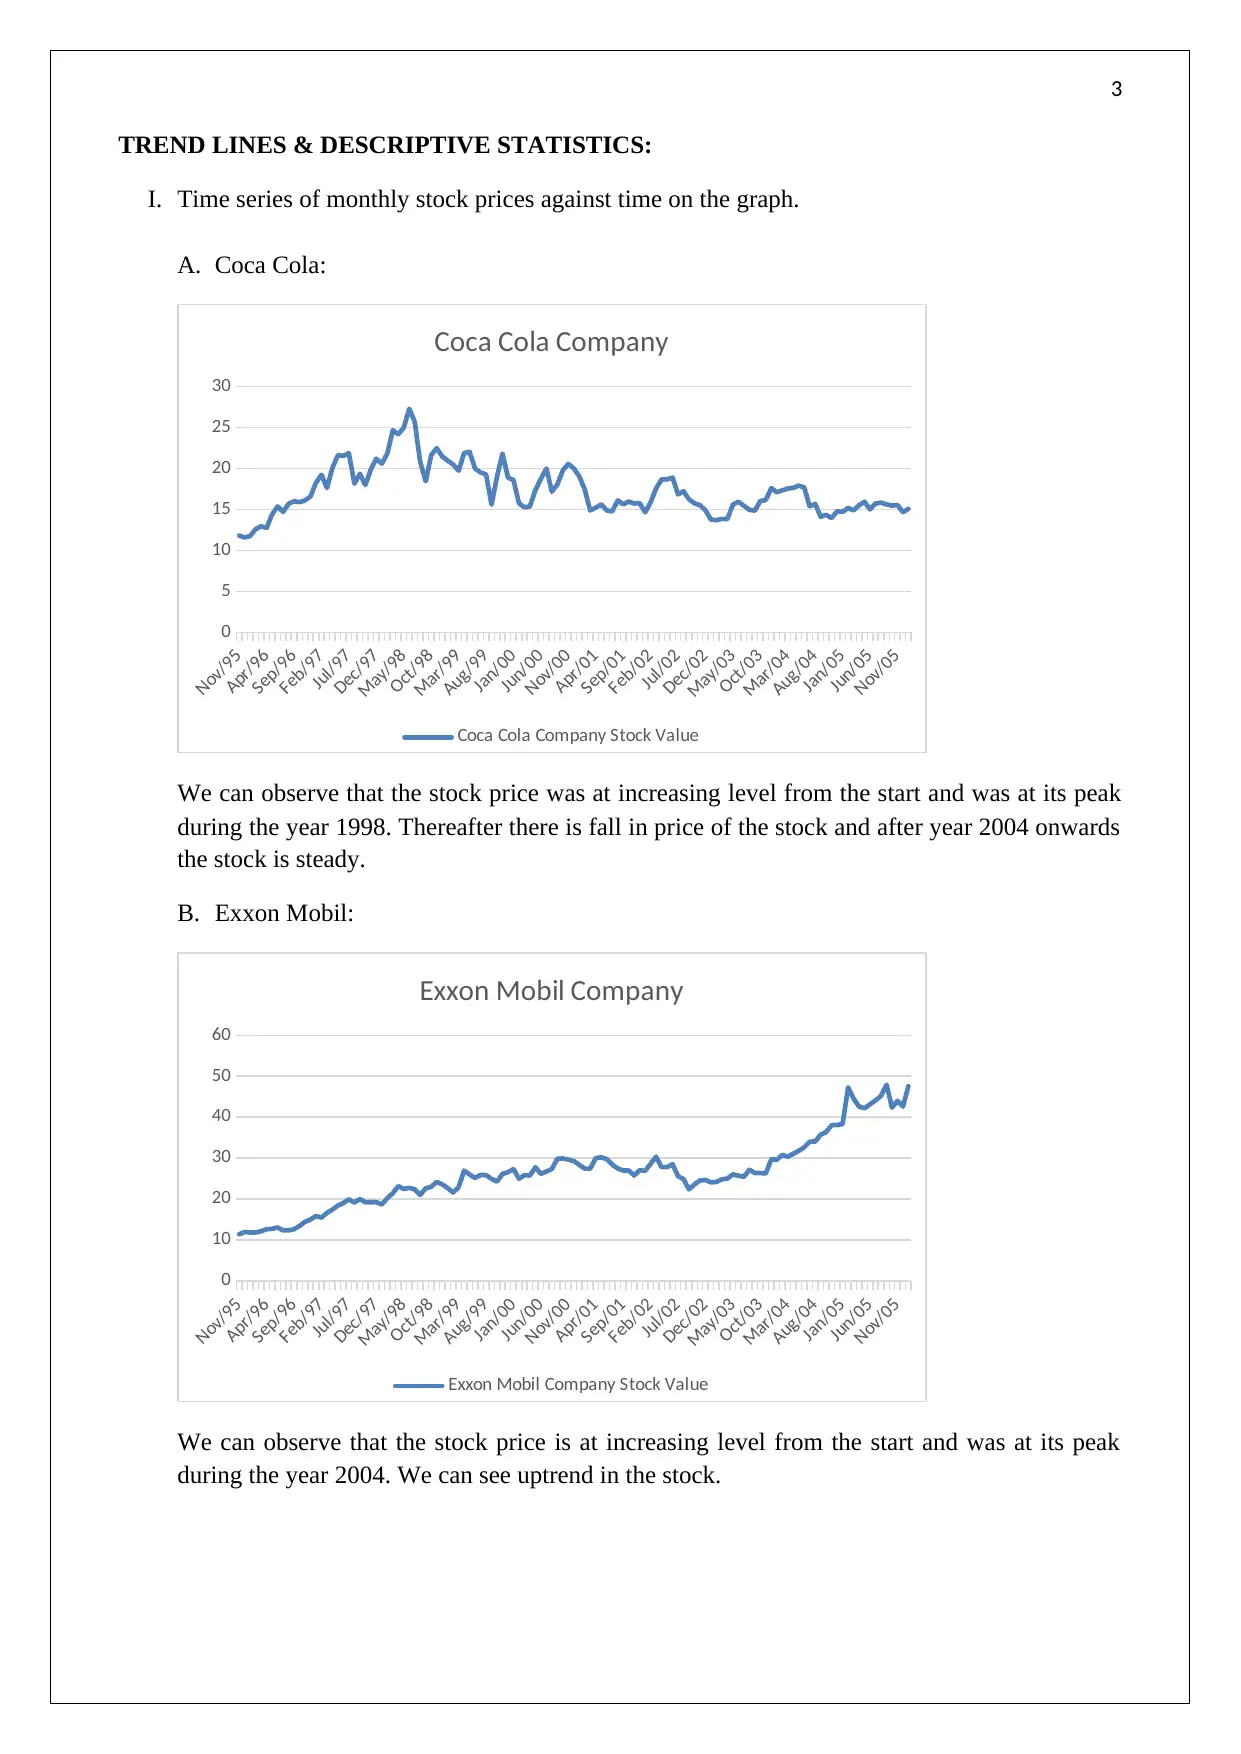
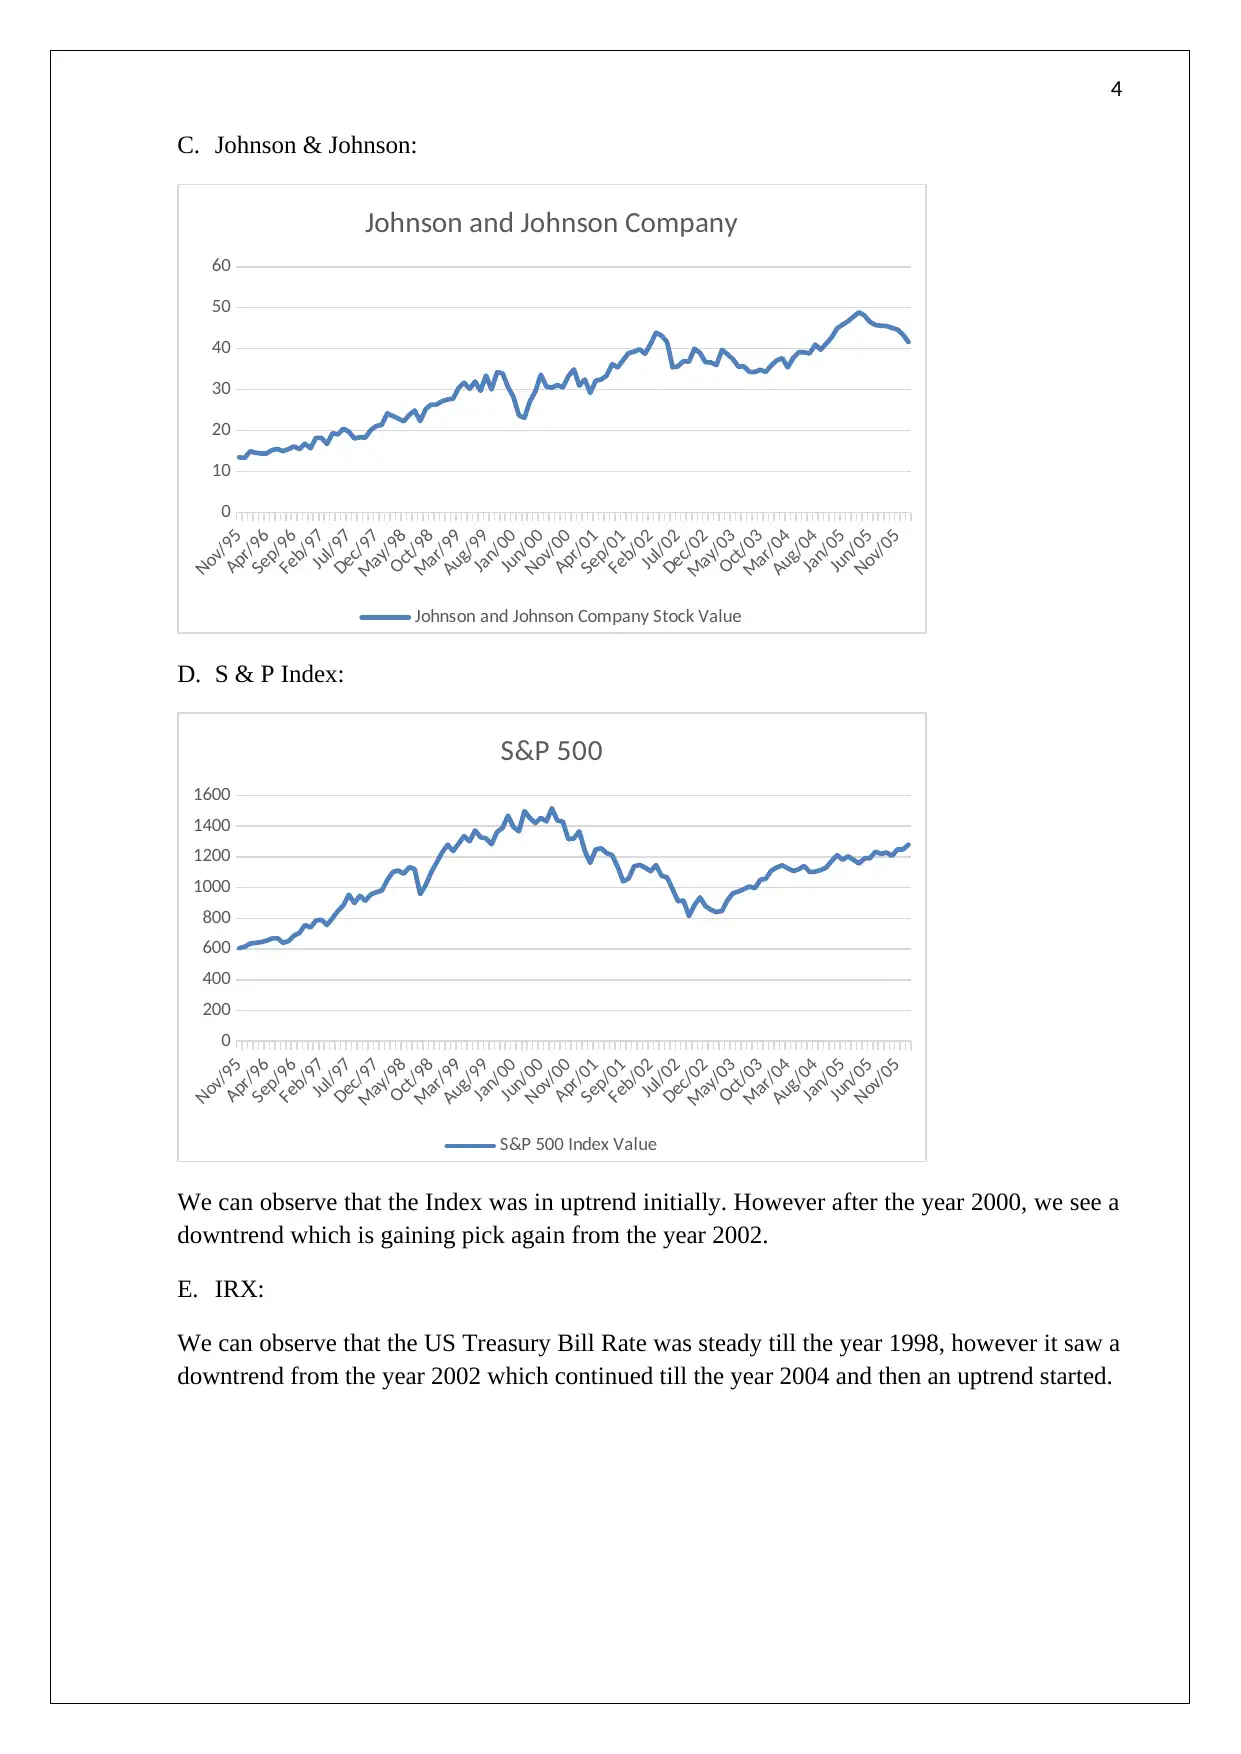
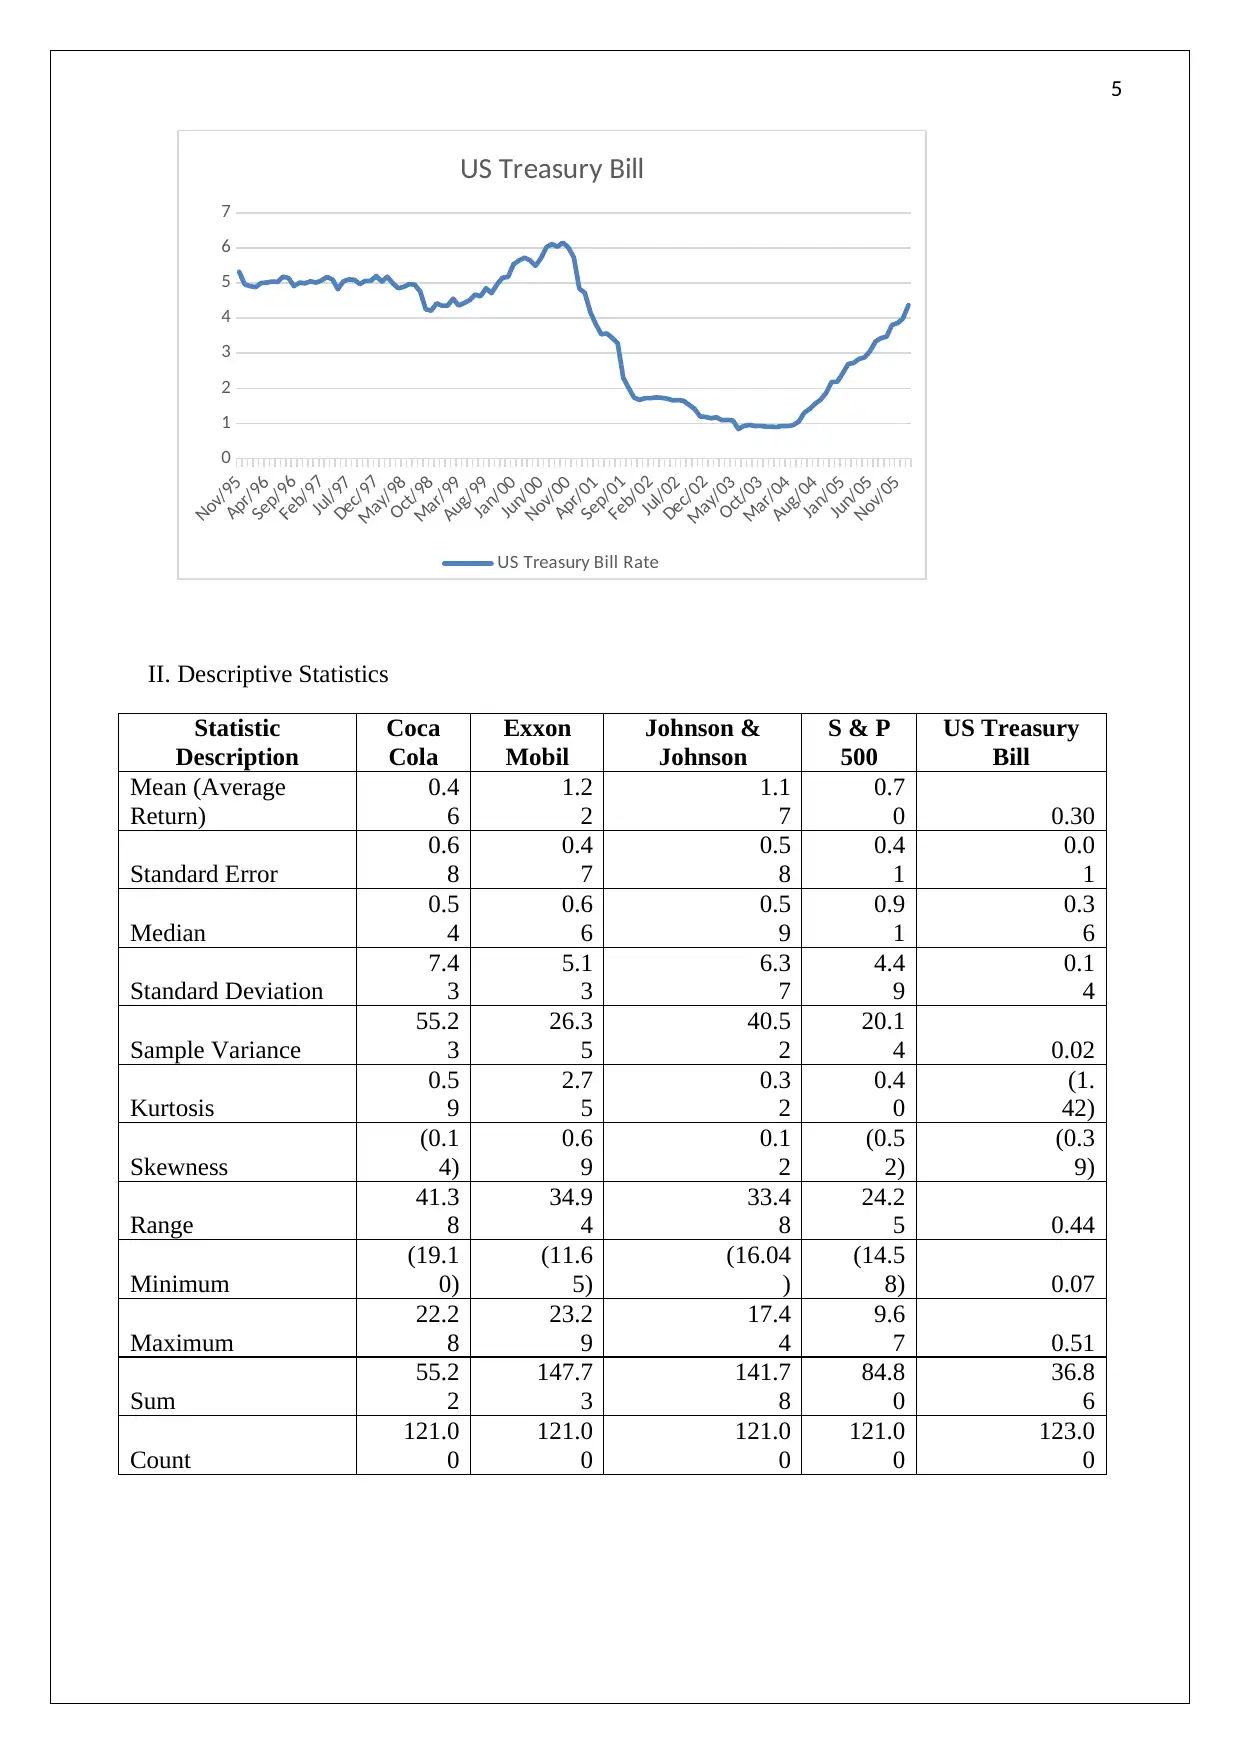
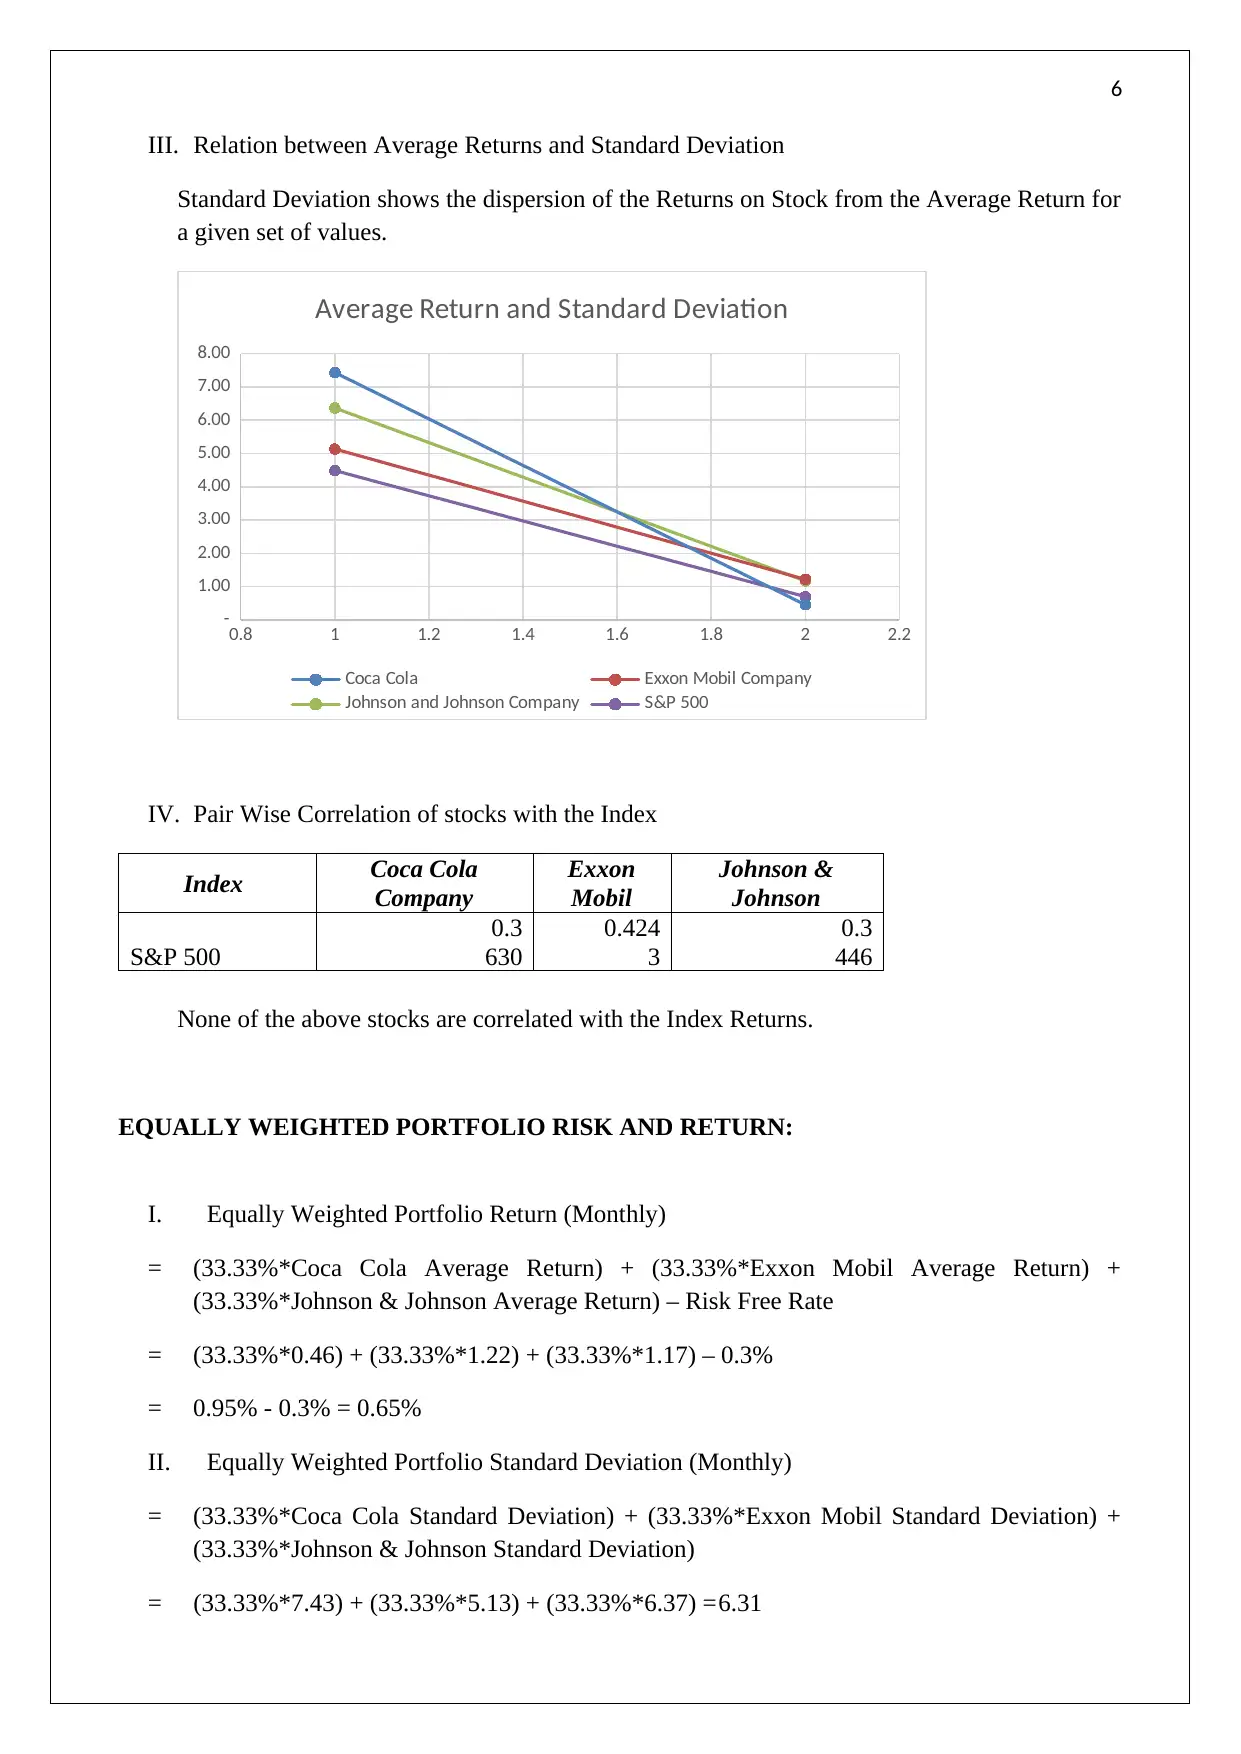
This project conducts a financial portfolio analysis, examining the performance of Coca-Cola, Exxon Mobil, and Johnson & Johnson stocks. It begins with trend lines and descriptive statistics to understand the historical price movements and key statistical measures like mean, standard deviation, and correlation. The analysis calculates the risk and return of an equally weighted portfolio, including the Sharpe ratio. Beta estimation is performed through regression analysis to assess the stocks' sensitivity to market movements. The Capital Asset Pricing Model (CAPM) is implemented to compute expected returns, and a comparison is made between the mean returns and CAPM-based returns. Finally, the project identifies an optimal portfolio by maximizing the Sharpe ratio and comparing it to the equally weighted portfolio, highlighting the impact of asset allocation on portfolio performance.
tabler-icon-diamond-filled.svg

Contribute Materials

Your contribution can guide someone’s learning journey. Share your documents today.
Document Page
1
ASSIGNMENT
tabler-icon-diamond-filled.svg

Secure Best Marks with AI Grader

Need help grading? Try our AI Grader for instant feedback on your assignments.
Document Page
2
Table of Contents
TREND LINES AND DESCRIPTIVE STATISTICS 3-6
EQUALLY WEIGHTED PORTFOLIO RISK AND RETURN 6-7
REGRESSION – BETA ESTIMATION 7
IMPLEMENTING CAPM 7-8
OPTIMAL PORTFOLIO 8
Document Page
3
TREND LINES & DESCRIPTIVE STATISTICS:
I. Time series of monthly stock prices against time on the graph.
A. Coca Cola:
Nov/95
Apr/96
Sep/96
Feb/97
Jul/97
Dec/97
May/98
Oct/98
Mar/99
Aug/99
Jan/00
Jun/00
Nov/00
Apr/01
Sep/01
Feb/02
Jul/02
Dec/02
May/03
Oct/03
Mar/04
Aug/04
Jan/05
Jun/05
Nov/05
0
5
10
15
20
25
30
Coca Cola Company
Coca Cola Company Stock Value
We can observe that the stock price was at increasing level from the start and was at its peak
during the year 1998. Thereafter there is fall in price of the stock and after year 2004 onwards
the stock is steady.
B. Exxon Mobil:
Nov/95
Apr/96
Sep/96
Feb/97
Jul/97
Dec/97
May/98
Oct/98
Mar/99
Aug/99
Jan/00
Jun/00
Nov/00
Apr/01
Sep/01
Feb/02
Jul/02
Dec/02
May/03
Oct/03
Mar/04
Aug/04
Jan/05
Jun/05
Nov/05
0
10
20
30
40
50
60
Exxon Mobil Company
Exxon Mobil Company Stock Value
We can observe that the stock price is at increasing level from the start and was at its peak
during the year 2004. We can see uptrend in the stock.
Document Page
4
C. Johnson & Johnson:
Nov/95
Apr/96
Sep/96
Feb/97
Jul/97
Dec/97
May/98
Oct/98
Mar/99
Aug/99
Jan/00
Jun/00
Nov/00
Apr/01
Sep/01
Feb/02
Jul/02
Dec/02
May/03
Oct/03
Mar/04
Aug/04
Jan/05
Jun/05
Nov/05
0
10
20
30
40
50
60
Johnson and Johnson Company
Johnson and Johnson Company Stock Value
D. S & P Index:
Nov/95
Apr/96
Sep/96
Feb/97
Jul/97
Dec/97
May/98
Oct/98
Mar/99
Aug/99
Jan/00
Jun/00
Nov/00
Apr/01
Sep/01
Feb/02
Jul/02
Dec/02
May/03
Oct/03
Mar/04
Aug/04
Jan/05
Jun/05
Nov/05
0
200
400
600
800
1000
1200
1400
1600
S&P 500
S&P 500 Index Value
We can observe that the Index was in uptrend initially. However after the year 2000, we see a
downtrend which is gaining pick again from the year 2002.
E. IRX:
We can observe that the US Treasury Bill Rate was steady till the year 1998, however it saw a
downtrend from the year 2002 which continued till the year 2004 and then an uptrend started.
tabler-icon-diamond-filled.svg

Secure Best Marks with AI Grader

Need help grading? Try our AI Grader for instant feedback on your assignments.
Document Page
5
Nov/95
Apr/96
Sep/96
Feb/97
Jul/97
Dec/97
May/98
Oct/98
Mar/99
Aug/99
Jan/00
Jun/00
Nov/00
Apr/01
Sep/01
Feb/02
Jul/02
Dec/02
May/03
Oct/03
Mar/04
Aug/04
Jan/05
Jun/05
Nov/05
0
1
2
3
4
5
6
7
US Treasury Bill
US Treasury Bill Rate
II. Descriptive Statistics
Statistic
Description
Coca
Cola
Exxon
Mobil
Johnson &
Johnson
S & P
500
US Treasury
Bill
Mean (Average
Return)
0.4
6
1.2
2
1.1
7
0.7
0 0.30
Standard Error
0.6
8
0.4
7
0.5
8
0.4
1
0.0
1
Median
0.5
4
0.6
6
0.5
9
0.9
1
0.3
6
Standard Deviation
7.4
3
5.1
3
6.3
7
4.4
9
0.1
4
Sample Variance
55.2
3
26.3
5
40.5
2
20.1
4 0.02
Kurtosis
0.5
9
2.7
5
0.3
2
0.4
0
(1.
42)
Skewness
(0.1
4)
0.6
9
0.1
2
(0.5
2)
(0.3
9)
Range
41.3
8
34.9
4
33.4
8
24.2
5 0.44
Minimum
(19.1
0)
(11.6
5)
(16.04
)
(14.5
8) 0.07
Maximum
22.2
8
23.2
9
17.4
4
9.6
7 0.51
Sum
55.2
2
147.7
3
141.7
8
84.8
0
36.8
6
Count
121.0
0
121.0
0
121.0
0
121.0
0
123.0
0
Document Page
6
III. Relation between Average Returns and Standard Deviation
Standard Deviation shows the dispersion of the Returns on Stock from the Average Return for
a given set of values.
0.8 1 1.2 1.4 1.6 1.8 2 2.2
-
1.00
2.00
3.00
4.00
5.00
6.00
7.00
8.00
Average Return and Standard Deviation
Coca Cola Exxon Mobil Company
Johnson and Johnson Company S&P 500
IV. Pair Wise Correlation of stocks with the Index
Index Coca Cola
Company
Exxon
Mobil
Johnson &
Johnson
S&P 500
0.3
630
0.424
3
0.3
446
None of the above stocks are correlated with the Index Returns.
EQUALLY WEIGHTED PORTFOLIO RISK AND RETURN:
I. Equally Weighted Portfolio Return (Monthly)
= (33.33%*Coca Cola Average Return) + (33.33%*Exxon Mobil Average Return) +
(33.33%*Johnson & Johnson Average Return) – Risk Free Rate
= (33.33%*0.46) + (33.33%*1.22) + (33.33%*1.17) – 0.3%
= 0.95% - 0.3% = 0.65%
II. Equally Weighted Portfolio Standard Deviation (Monthly)
= (33.33%*Coca Cola Standard Deviation) + (33.33%*Exxon Mobil Standard Deviation) +
(33.33%*Johnson & Johnson Standard Deviation)
= (33.33%*7.43) + (33.33%*5.13) + (33.33%*6.37) =6.31
Document Page
7
III. Equally Weighted Portfolio Sharpe Ratio (Monthly)
Sharpe Ratio = (Mean Portfolio Return – Risk Free Rate) / Standard Deviation of Portfolio
= (0.95 – 0.3)/0.0631
= 10.30
REGRESSION – BETA ESTIMATION:
Coca Cola Company Exxon Mobil Johnson & Johnson
Coefficient
s
Standard
Error
Coefficient
s
Standard
Error
Coefficient
s
Standard
Error
Intercept (0.08) 0.63 1.11 0.70 0.68 0.55
S & P
500 0.60 0.14 (0.11) 0.16 0.49 0.12
The co-efficient highlighted in yellow represents the Beta for that particular stock.
(a) While Coca Cola Company and Johnson & Johnson has a positive Beta, Exxon Mobile
has a negative Beta. A negative Beta states that the effect of change in market would
impact in opposite direction on the stock.
(b) Stock Coca Cola has the highest Beta and Exxon Mobil has the lowest Beta
(c) Yes the results are surprising especially for Stock Exxon Mobil. It suggests that the
stock in unaffected or least affected by the variation in the stock market.
IMPLEMENTING CAPM:
As per CAPM, R(i) = Rf + Beta (Rm - Rf)
Rf = Risk Free Rate; Rm = Market Rate of Return; Ri = Expected Return from Stock under CAPM
Expected Return Computation (Monthly):
Coca Cola = 0.3 + 0.6 (0.7 - 0.3) = 0.54%
Exxon Mobil = 0.3 + (-0.11) (1.22 - 0.3) = 0.1988%
Johnson & Johnson = 0.3 + 0.49 (1.17 - 0.3) = 0.7263%
Monthly Average as per Mean Return v/s CAPM:
Particulars Coca Cola Exxon Mobil Johnson & Johnson
Average Return
(Mean Return)
0.46 1.22 1.17
Return as per CAPM 0.54 0.1988 0.7263
tabler-icon-diamond-filled.svg

Paraphrase This Document

Need a fresh take? Get an instant paraphrase of this document with our AI Paraphraser
Document Page
8
From the above table, we infer that the Mean Return is higher for Exxon Mobil and Johnson &
Johnson but lower for Coca Cola. This simply means that the most affected stock due to changes in
Market is the stock with highest Beta
OPTIMAL PORTFOLIO:
Portfolio Average
Return (Optimum)
0.8
7
Portfolio Standard
Deviation (Optimum)
8.1
5
Portfolio Sharpe Ratio
(Optimum)
10.6
7
Coca Cola (%) 0%
Exxon Mobil (%) 0%
Johnson & Johnson
(%) 100%
8.15 7.33 6.82 8.03
-
0.20
0.40
0.60
0.80
1.00
1.20
1.40
1.60
Efficient Frontier
Portfolio Average Return
Average Return
Optimum vs Equal Proportion:
Portfolio Average
Return (Optimum)
0.8
7
0.6
5
Portfolio Standard
Deviation (Optimum)
8.1
5
6.3
1
Portfolio Sharpe Ratio
(Optimum)
10.6
7
10.3
0
Coca Cola (%) 0% 33.33%
Exxon Mobil (%) 0% 33.33%
Johnson & Johnson
(%) 100% 33.33%
chevron_up_icon
1 out of 8
circle_padding
hide_on_mobile
zoom_out_icon
logo.png

Your All-in-One AI-Powered Toolkit for Academic Success.

Available 24*7 on WhatsApp / Email

[object Object]