Financial Performance Analysis and Project Report: Elysium Resources
VerifiedAdded on 2020/05/28
|30
|10618
|76
Project
AI Summary
This project report provides a comprehensive financial analysis of Elysium Resources Limited. It begins with a company description and an overview of its ownership and governance structure, followed by a detailed examination of its financial performance using key ratios such as Return on Assets (ROA), Return on Equity (ROE), and debt ratios. The report then delves into the changes in the company's stock price, identifying significant factors influencing these movements, including acquisitions, name changes, and macroeconomic conditions. Furthermore, the report includes calculations of the Capital Asset Pricing Model (CAPM) and beta values to assess risk and return, along with the Weighted Average Cost of Capital (WACC). The analysis also explores the company's dividend policy and concludes with recommendations based on the financial findings. The report utilizes data from financial statements and market information to provide insights into the company's financial health and investment potential.
Running Head: Finance For Business
1
Project Report: Finance for business
1
Project Report: Finance for business
Paraphrase This Document
Need a fresh take? Get an instant paraphrase of this document with our AI Paraphraser
Finance For Business
2
Contents
Introduction.......................................................................................................................3
Company description........................................................................................................3
Ownership governance structure......................................................................................3
Performance ratios............................................................................................................4
Changes in stock price......................................................................................................6
Significant factors.............................................................................................................7
Calculation of CAPM and beta values..............................................................................7
WACC calculations..........................................................................................................8
Debt ratios.........................................................................................................................9
Dividend policy..............................................................................................................10
Recommendation and Conclusion..................................................................................11
References.......................................................................................................................12
Appendix.........................................................................................................................14
Finance For Business
3
Introduction:
Evaluating over the financial aspects and the figures of an organization is required to
make an improved conclusion about the situation of the company. Financial analysis is the
field which express about the stability, volatility, profitability etc. It is mainly performed by
the professionals to evaluate the financial position of business through evaluating the
financial statements of the company, market stock price of the company, changes in the
ordinary share price etc (Phillips and Stawarski, 2016).
This report has been prepared to evaluate the financial position and the performance
of Elysium resources limited. For evaluating the financial position and investment
opportunity in the company, performance ratios have been calculated. Further, stock price has
been calculated and changes have been identified. In addition, significant factors of changes
in the stock price have been evaluated and lastly, the WACC has been calculated to reach
over an improved conclusion.
Company description:
Elysium Resources Limited is a mineral resource company which is focusing on
development and exploration of numerous material and commodities. This company holds
the interest in various metal projects as well which offers high return to the company. This
company is registered in the security market of Australia by the name of EYM. Currently,
this company is recognized as Hardey resources limited. The main project of the company is
Burraga copper gold project which is covering around 221 square kilometre of the East
Lachlan in Central Western South Wales. Current financial position of the company is quite
strong. Mainly this company is situated in West Perth, Australia (Reports, 2018).
The mineral industry of Australia has been evaluated and it has been found that there
is huge competition of Elysium Resources Limited in the market. Though, the industry is
performing too well and the company is suggested to grab the opportunities to enhance the
market share.
Ownership governance structure:
Further, the study has been conducted over corporate governance and the board of
members of the comapny to identify the stakeholders of the comapny and the main people
⊘ This is a preview!⊘
Do you want full access?
Subscribe today to unlock all pages.
Trusted by 1+ million students worldwide
Finance For Business
4
which are involved in managing the operations and the performance of the company (Nobes,
and Parker, 2008).
Substantial stakeholders:
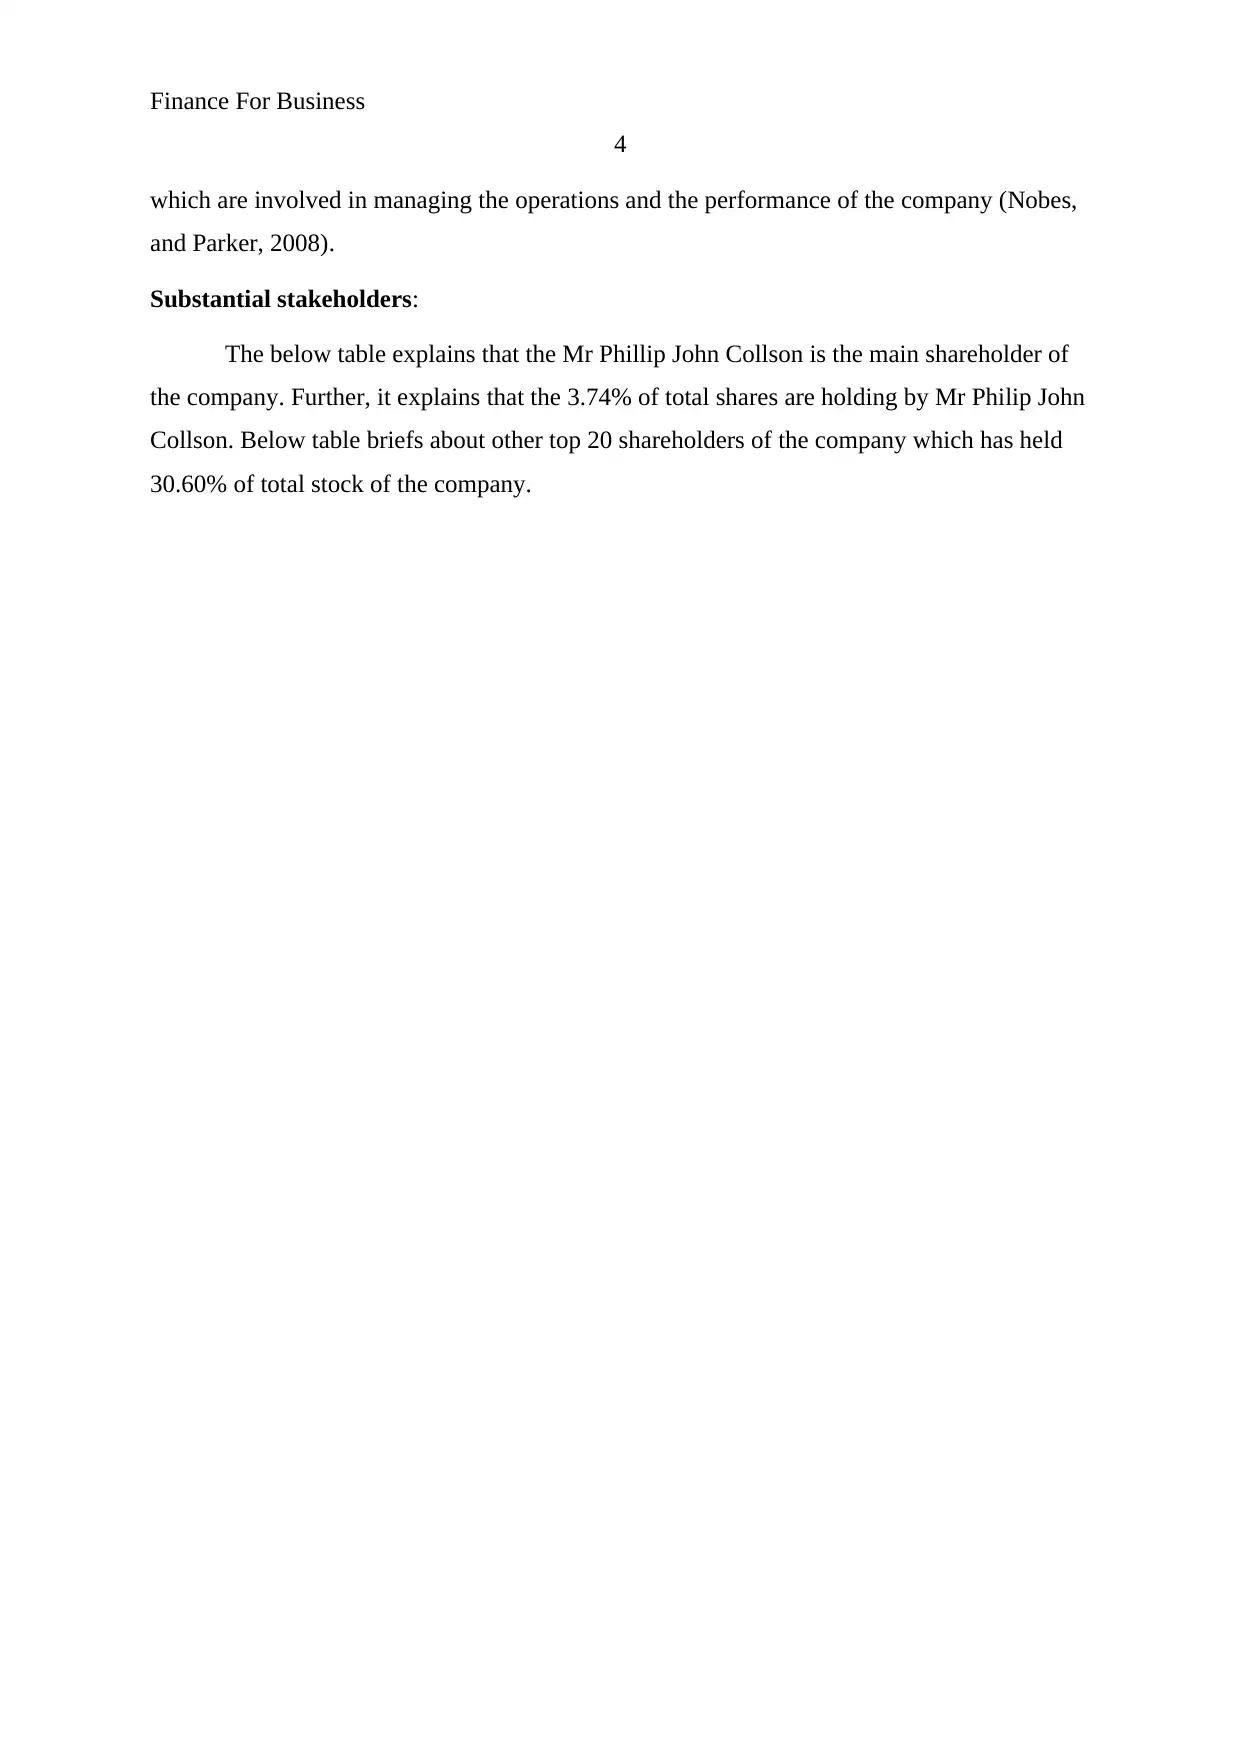
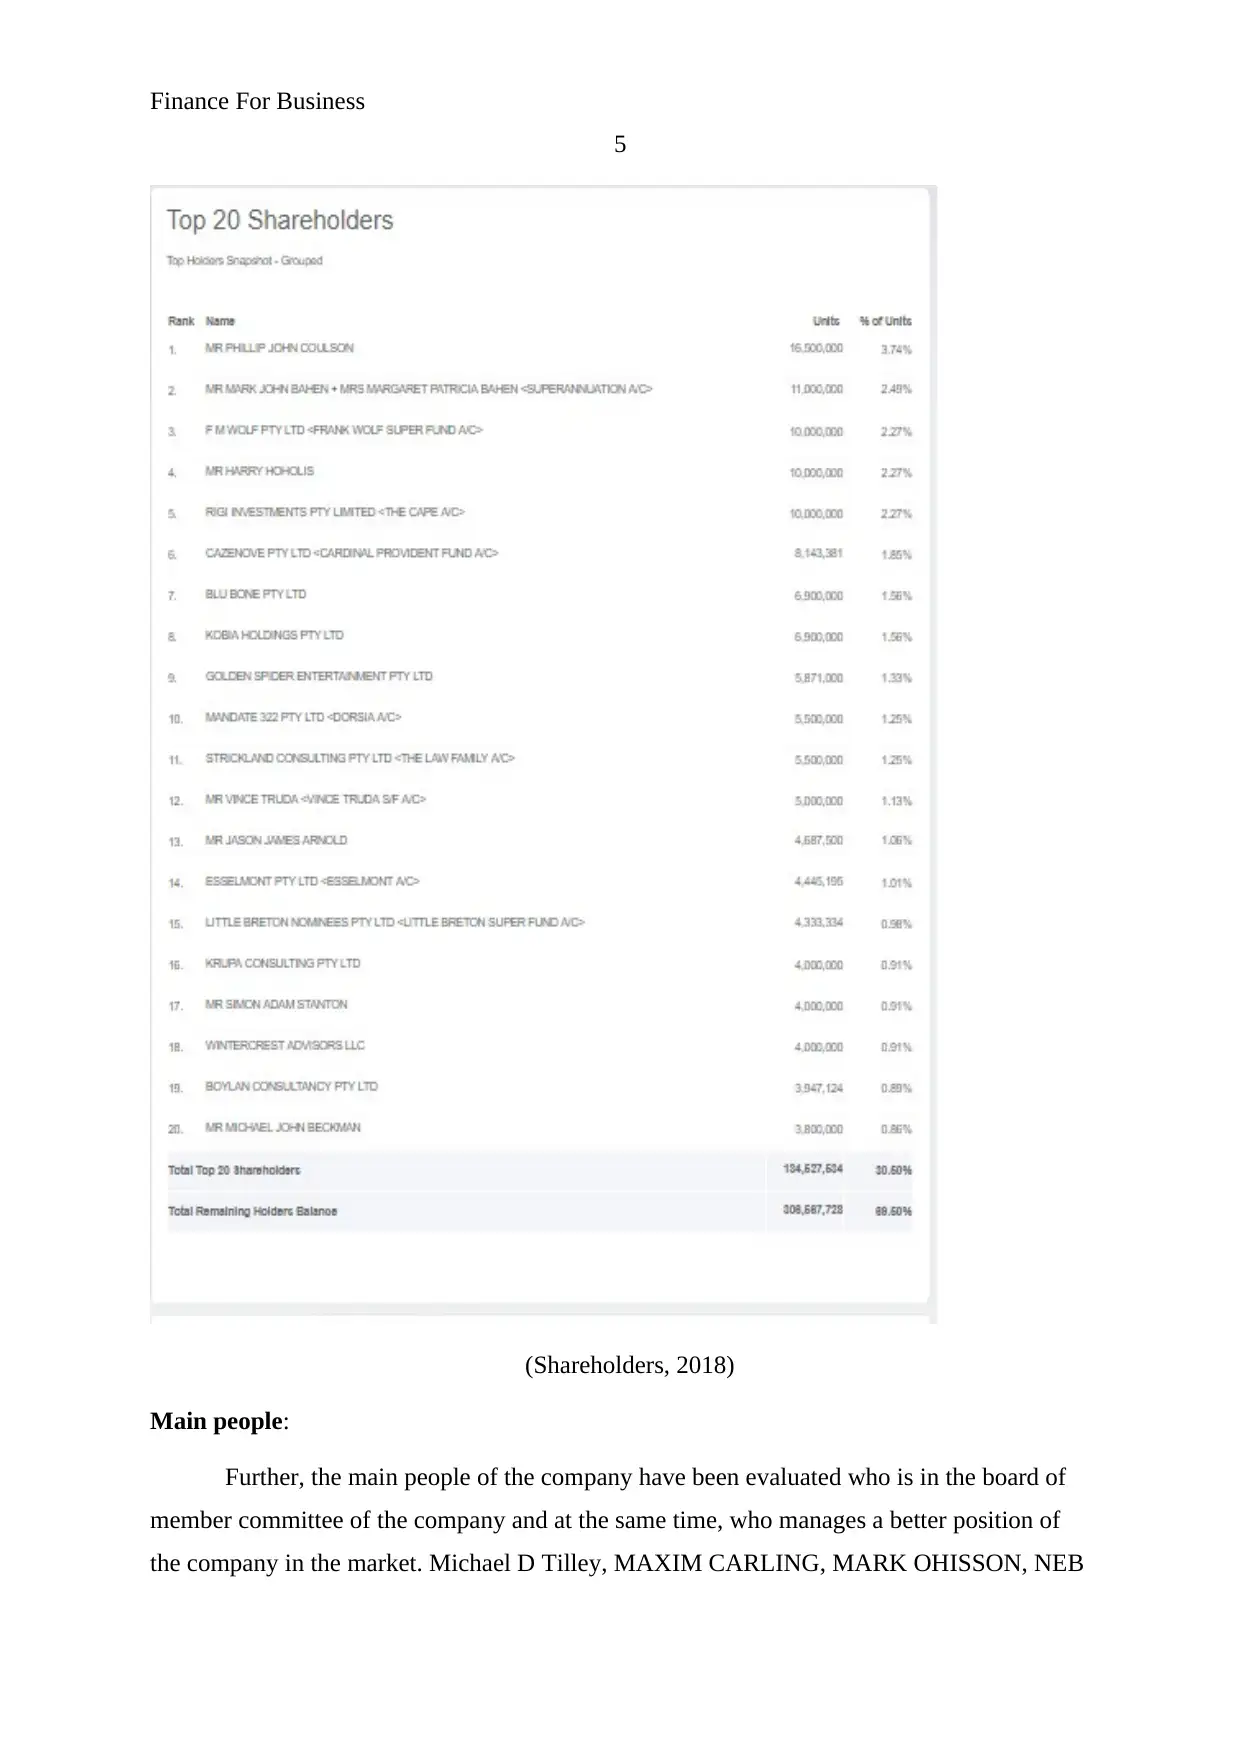
The below table explains that the Mr Phillip John Collson is the main shareholder of
the company. Further, it explains that the 3.74% of total shares are holding by Mr Philip John
Collson. Below table briefs about other top 20 shareholders of the company which has held
30.60% of total stock of the company.
4
which are involved in managing the operations and the performance of the company (Nobes,
and Parker, 2008).
Substantial stakeholders:
The below table explains that the Mr Phillip John Collson is the main shareholder of
the company. Further, it explains that the 3.74% of total shares are holding by Mr Philip John
Collson. Below table briefs about other top 20 shareholders of the company which has held
30.60% of total stock of the company.
Paraphrase This Document
Need a fresh take? Get an instant paraphrase of this document with our AI Paraphraser
Finance For Business
5
(Shareholders, 2018)
Main people:
Further, the main people of the company have been evaluated who is in the board of
member committee of the company and at the same time, who manages a better position of
the company in the market. Michael D Tilley, MAXIM CARLING, MARK OHISSON, NEB
5
(Shareholders, 2018)
Main people:
Further, the main people of the company have been evaluated who is in the board of
member committee of the company and at the same time, who manages a better position of
the company in the market. Michael D Tilley, MAXIM CARLING, MARK OHISSON, NEB
Finance For Business
6
ZURKIC, Dean Pantin are the main executive and non executive directors of the company
who manages the better position and the performance of the company in market. MAXIM
CARLING is the CEO of the company and manages the operations of the company (Annual
report, 2015).
Further, the share in the company’s stock has been evaluated and it has been analyzed
that no executive and non executive members have the ownership more than 20% and not
even 5% in the total shares of the company (Niu, 2006).
Performance ratios:
Performance ratios are analysis method which is calculated to investigate over the
performance of an organization. Performance ratios are calculated by the professionals to
evaluate the operating performance of the company. Mainly, return on assets, return on equity
and debt ratios is included in the performance ratios (Moles, Parrino and Kidwekk, 2011).
These ratios have been calculated over Elysium Resources Limited to evaluate the financial
position of the company. Following is the study of performance ratios of Elysium resources
limited:
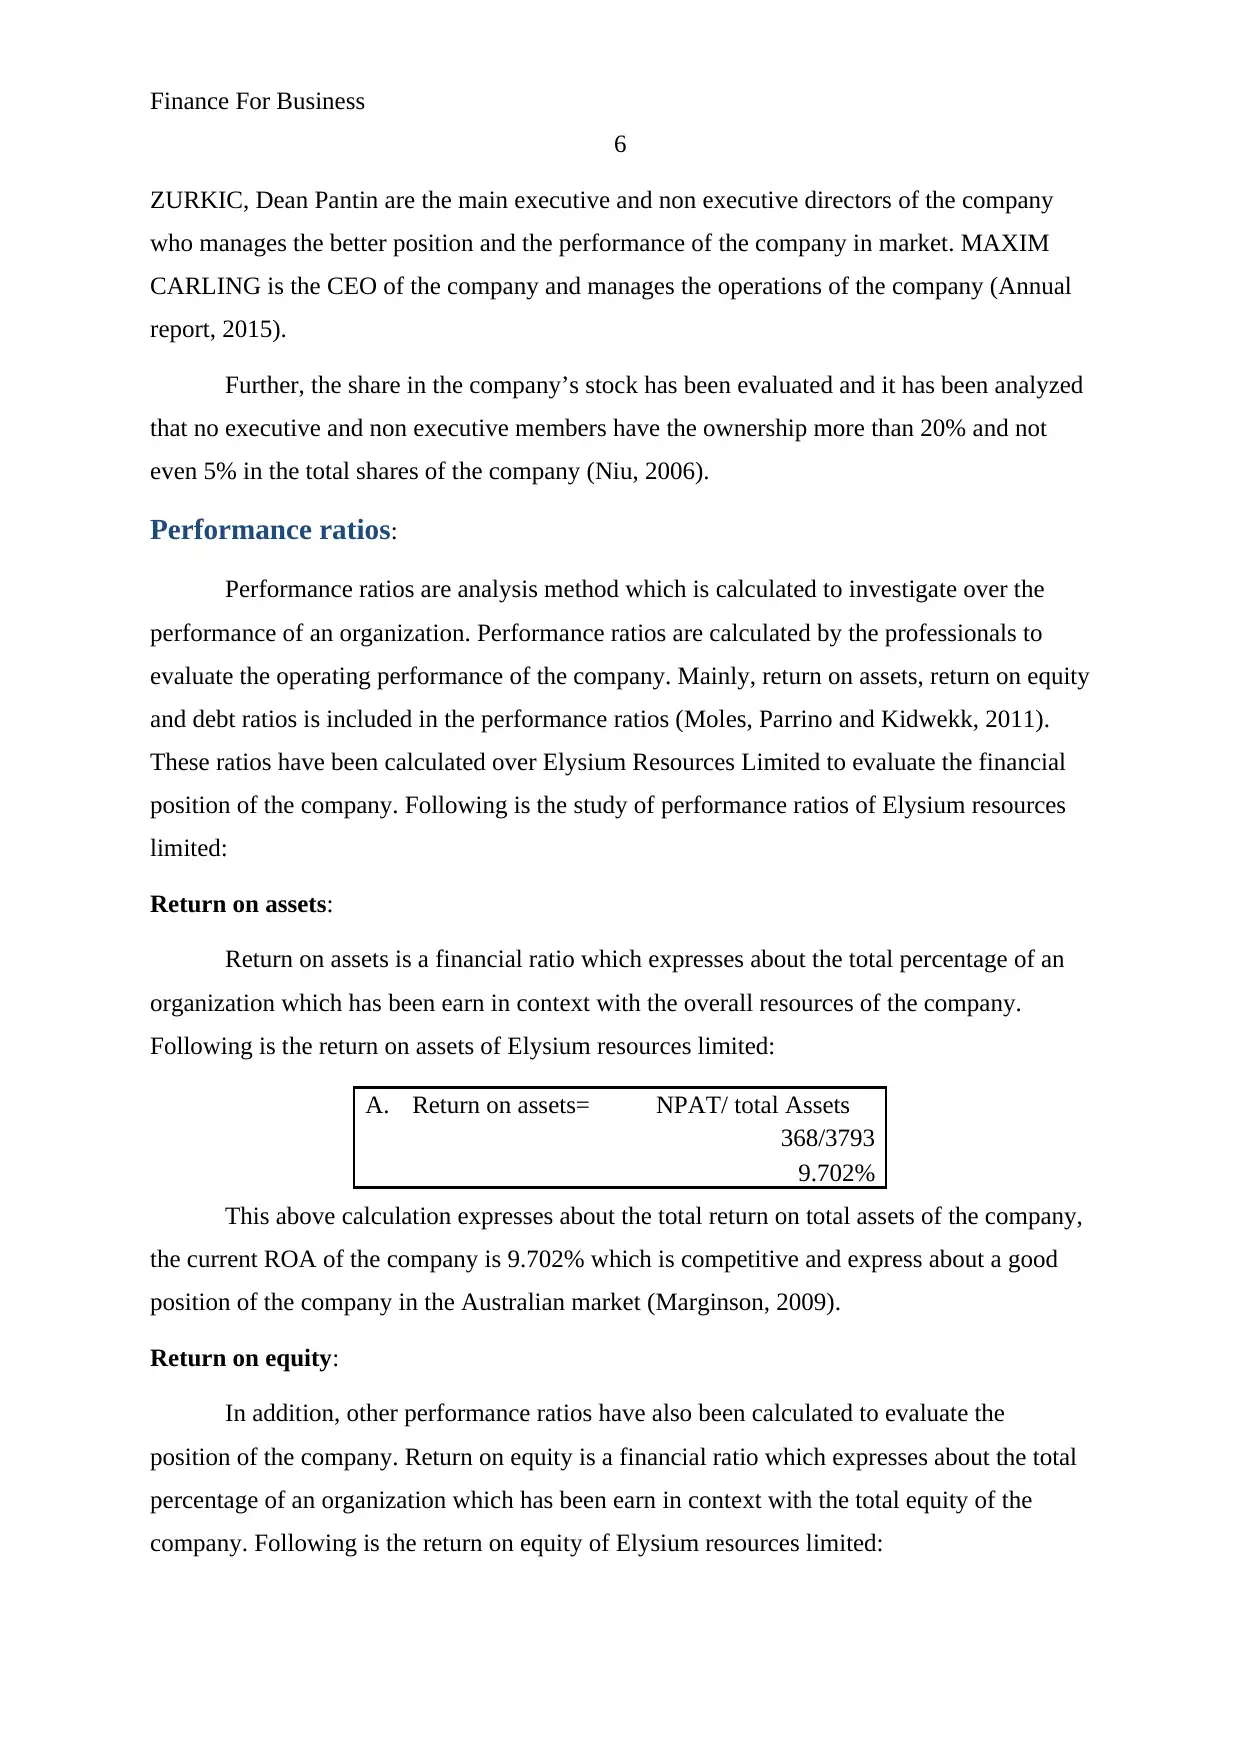
Return on assets:
Return on assets is a financial ratio which expresses about the total percentage of an
organization which has been earn in context with the overall resources of the company.
Following is the return on assets of Elysium resources limited:
A. Return on assets= NPAT/ total Assets
368/3793
9.702%
This above calculation expresses about the total return on total assets of the company,
the current ROA of the company is 9.702% which is competitive and express about a good
position of the company in the Australian market (Marginson, 2009).
Return on equity:
In addition, other performance ratios have also been calculated to evaluate the
position of the company. Return on equity is a financial ratio which expresses about the total
percentage of an organization which has been earn in context with the total equity of the
company. Following is the return on equity of Elysium resources limited:
6
ZURKIC, Dean Pantin are the main executive and non executive directors of the company
who manages the better position and the performance of the company in market. MAXIM
CARLING is the CEO of the company and manages the operations of the company (Annual
report, 2015).
Further, the share in the company’s stock has been evaluated and it has been analyzed
that no executive and non executive members have the ownership more than 20% and not
even 5% in the total shares of the company (Niu, 2006).
Performance ratios:
Performance ratios are analysis method which is calculated to investigate over the
performance of an organization. Performance ratios are calculated by the professionals to
evaluate the operating performance of the company. Mainly, return on assets, return on equity
and debt ratios is included in the performance ratios (Moles, Parrino and Kidwekk, 2011).
These ratios have been calculated over Elysium Resources Limited to evaluate the financial
position of the company. Following is the study of performance ratios of Elysium resources
limited:
Return on assets:
Return on assets is a financial ratio which expresses about the total percentage of an
organization which has been earn in context with the overall resources of the company.
Following is the return on assets of Elysium resources limited:
A. Return on assets= NPAT/ total Assets
368/3793
9.702%
This above calculation expresses about the total return on total assets of the company,
the current ROA of the company is 9.702% which is competitive and express about a good
position of the company in the Australian market (Marginson, 2009).
Return on equity:
In addition, other performance ratios have also been calculated to evaluate the
position of the company. Return on equity is a financial ratio which expresses about the total
percentage of an organization which has been earn in context with the total equity of the
company. Following is the return on equity of Elysium resources limited:
⊘ This is a preview!⊘
Do you want full access?
Subscribe today to unlock all pages.
Trusted by 1+ million students worldwide
Finance For Business
7
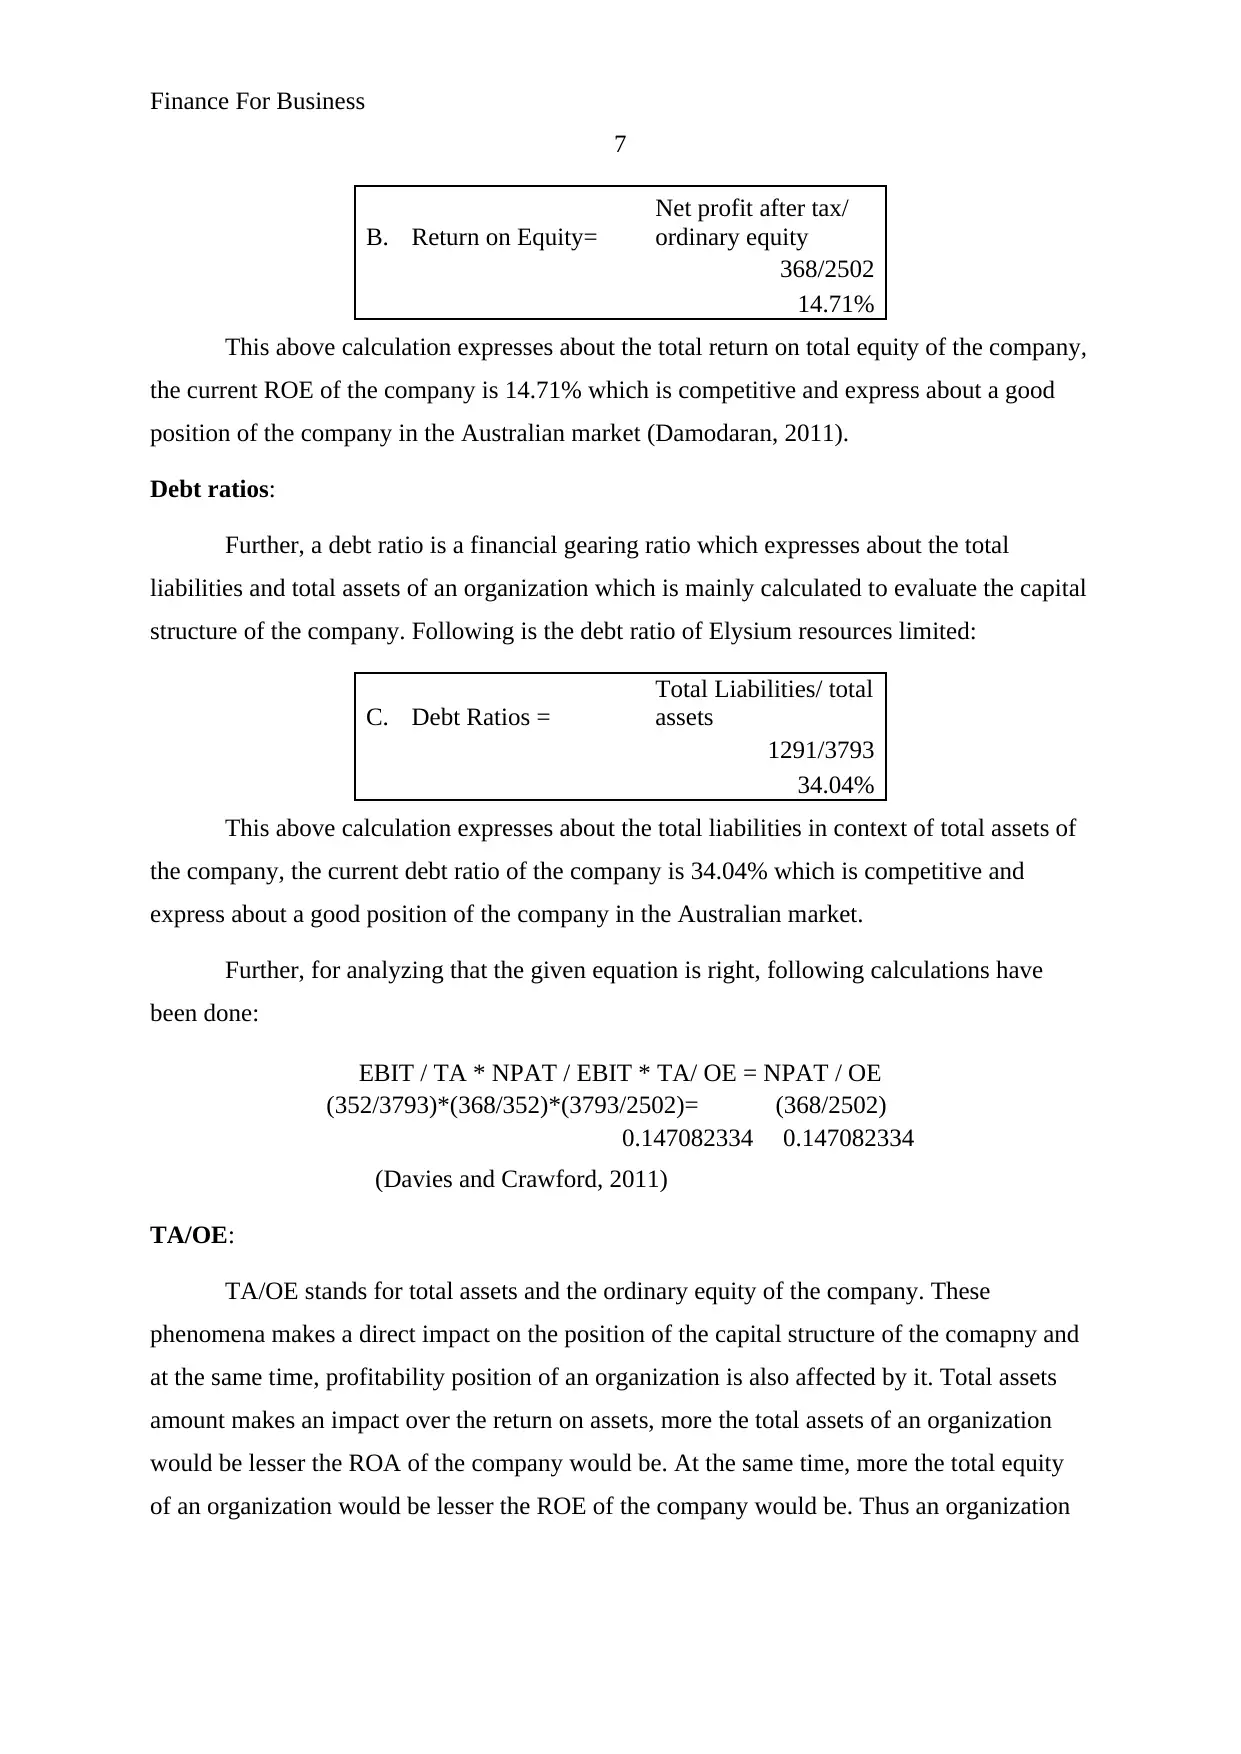
B. Return on Equity=
Net profit after tax/
ordinary equity
368/2502
14.71%
This above calculation expresses about the total return on total equity of the company,
the current ROE of the company is 14.71% which is competitive and express about a good
position of the company in the Australian market (Damodaran, 2011).
Debt ratios:
Further, a debt ratio is a financial gearing ratio which expresses about the total
liabilities and total assets of an organization which is mainly calculated to evaluate the capital
structure of the company. Following is the debt ratio of Elysium resources limited:
C. Debt Ratios =
Total Liabilities/ total
assets
1291/3793
34.04%
This above calculation expresses about the total liabilities in context of total assets of
the company, the current debt ratio of the company is 34.04% which is competitive and
express about a good position of the company in the Australian market.
Further, for analyzing that the given equation is right, following calculations have
been done:
EBIT / TA * NPAT / EBIT * TA/ OE = NPAT / OE
(352/3793)*(368/352)*(3793/2502)= (368/2502)
0.147082334 0.147082334
(Davies and Crawford, 2011)
TA/OE:
TA/OE stands for total assets and the ordinary equity of the company. These
phenomena makes a direct impact on the position of the capital structure of the comapny and
at the same time, profitability position of an organization is also affected by it. Total assets
amount makes an impact over the return on assets, more the total assets of an organization
would be lesser the ROA of the company would be. At the same time, more the total equity
of an organization would be lesser the ROE of the company would be. Thus an organization
7
B. Return on Equity=
Net profit after tax/
ordinary equity
368/2502
14.71%
This above calculation expresses about the total return on total equity of the company,
the current ROE of the company is 14.71% which is competitive and express about a good
position of the company in the Australian market (Damodaran, 2011).
Debt ratios:
Further, a debt ratio is a financial gearing ratio which expresses about the total
liabilities and total assets of an organization which is mainly calculated to evaluate the capital
structure of the company. Following is the debt ratio of Elysium resources limited:
C. Debt Ratios =
Total Liabilities/ total
assets
1291/3793
34.04%
This above calculation expresses about the total liabilities in context of total assets of
the company, the current debt ratio of the company is 34.04% which is competitive and
express about a good position of the company in the Australian market.
Further, for analyzing that the given equation is right, following calculations have
been done:
EBIT / TA * NPAT / EBIT * TA/ OE = NPAT / OE
(352/3793)*(368/352)*(3793/2502)= (368/2502)
0.147082334 0.147082334
(Davies and Crawford, 2011)
TA/OE:
TA/OE stands for total assets and the ordinary equity of the company. These
phenomena makes a direct impact on the position of the capital structure of the comapny and
at the same time, profitability position of an organization is also affected by it. Total assets
amount makes an impact over the return on assets, more the total assets of an organization
would be lesser the ROA of the company would be. At the same time, more the total equity
of an organization would be lesser the ROE of the company would be. Thus an organization
Paraphrase This Document
Need a fresh take? Get an instant paraphrase of this document with our AI Paraphraser
Finance For Business
8
should manage the level of total assets and total equity accoridng to the profitability level of
the company.
ROA and ROE:
Accoridng to the above evaluation over ROA and ROE of the company, it has been
found that ROE of the company is quite higher than the ROA of the company. These
differences have mainly occurred due to higher level of assets in comparisons with the total
equity of the company. In most of the cases, ROE is always higher than the ROA of the
company as total assets level of an organization is always higher.
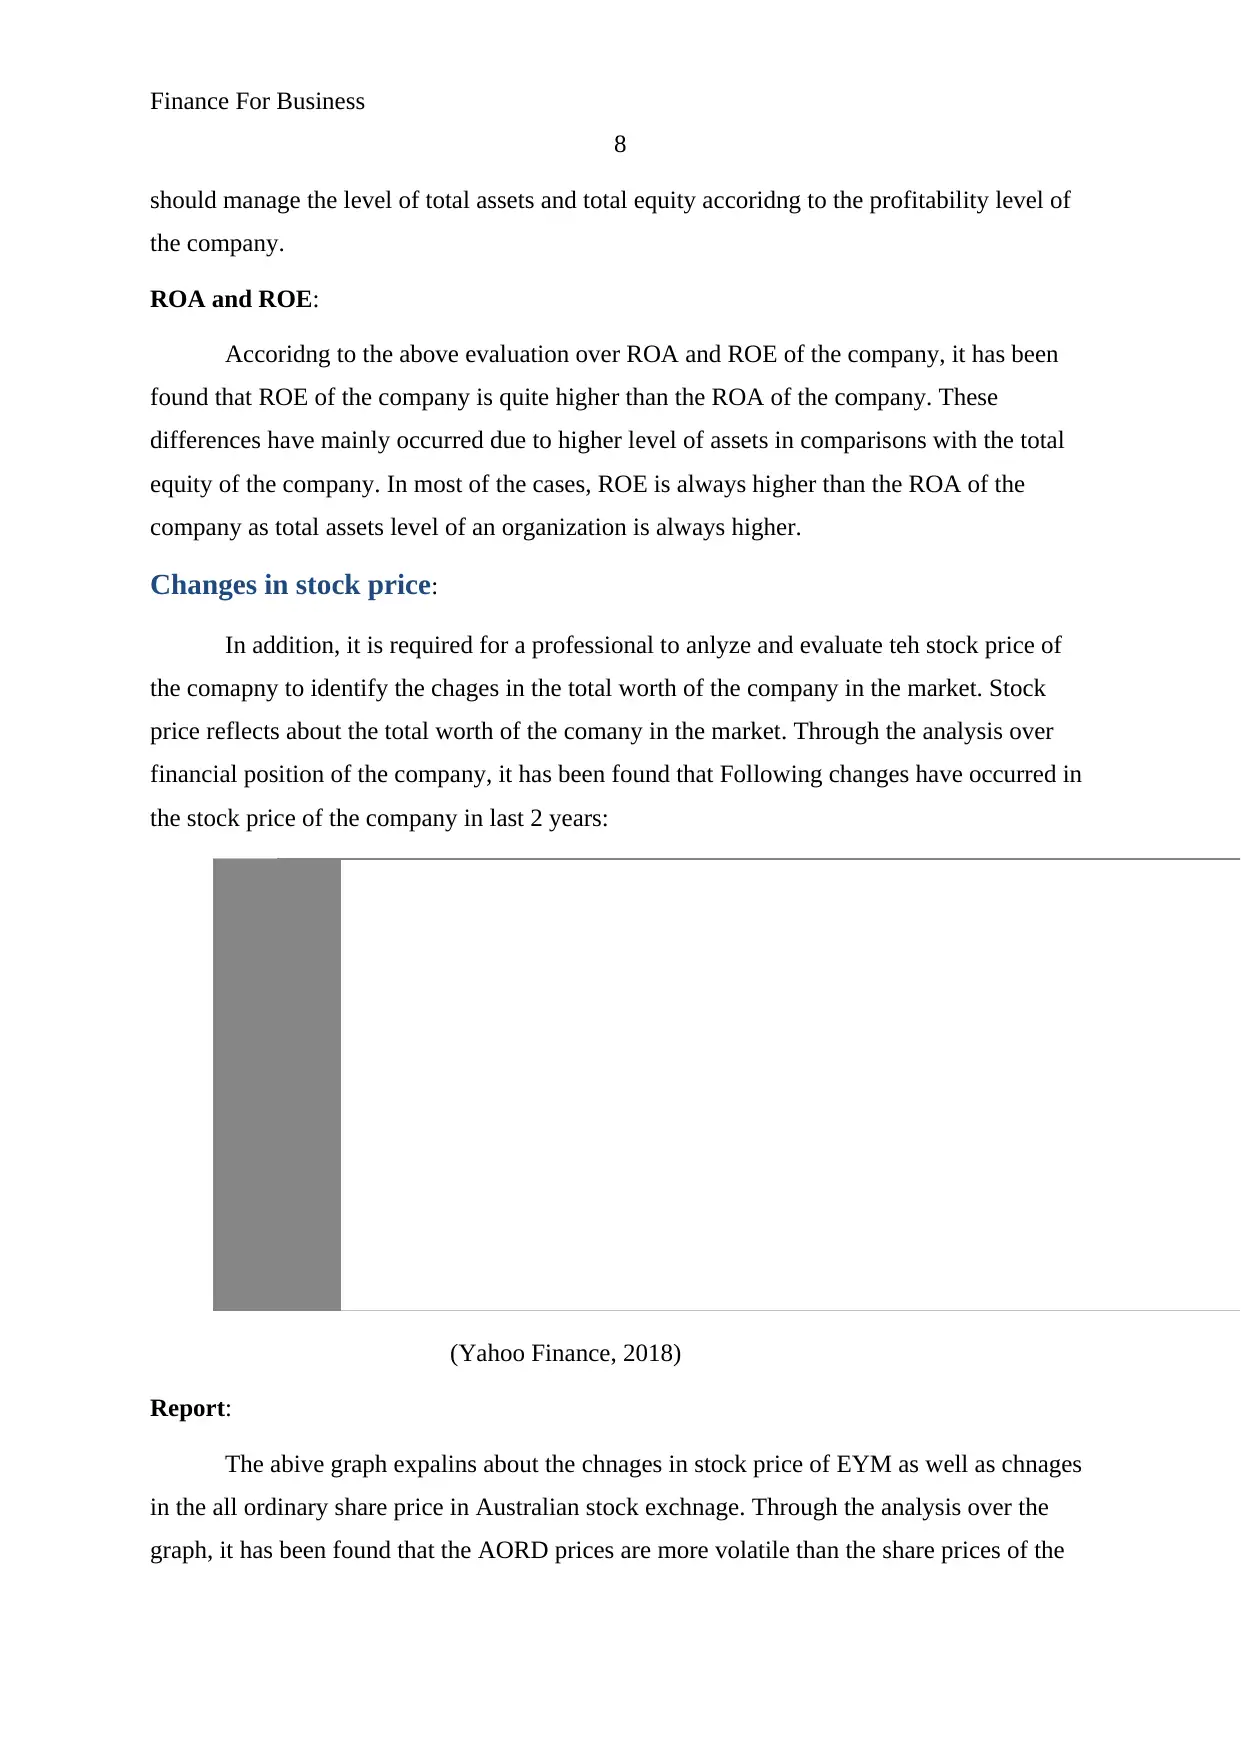
Changes in stock price:
In addition, it is required for a professional to anlyze and evaluate teh stock price of
the comapny to identify the chages in the total worth of the company in the market. Stock
price reflects about the total worth of the comany in the market. Through the analysis over
financial position of the company, it has been found that Following changes have occurred in
the stock price of the company in last 2 years:
(Yahoo Finance, 2018)
Report:
The abive graph expalins about the chnages in stock price of EYM as well as chnages
in the all ordinary share price in Australian stock exchnage. Through the analysis over the
graph, it has been found that the AORD prices are more volatile than the share prices of the
8
should manage the level of total assets and total equity accoridng to the profitability level of
the company.
ROA and ROE:
Accoridng to the above evaluation over ROA and ROE of the company, it has been
found that ROE of the company is quite higher than the ROA of the company. These
differences have mainly occurred due to higher level of assets in comparisons with the total
equity of the company. In most of the cases, ROE is always higher than the ROA of the
company as total assets level of an organization is always higher.
Changes in stock price:
In addition, it is required for a professional to anlyze and evaluate teh stock price of
the comapny to identify the chages in the total worth of the company in the market. Stock
price reflects about the total worth of the comany in the market. Through the analysis over
financial position of the company, it has been found that Following changes have occurred in
the stock price of the company in last 2 years:
(Yahoo Finance, 2018)
Report:
The abive graph expalins about the chnages in stock price of EYM as well as chnages
in the all ordinary share price in Australian stock exchnage. Through the analysis over the
graph, it has been found that the AORD prices are more volatile than the share prices of the
Finance For Business
9
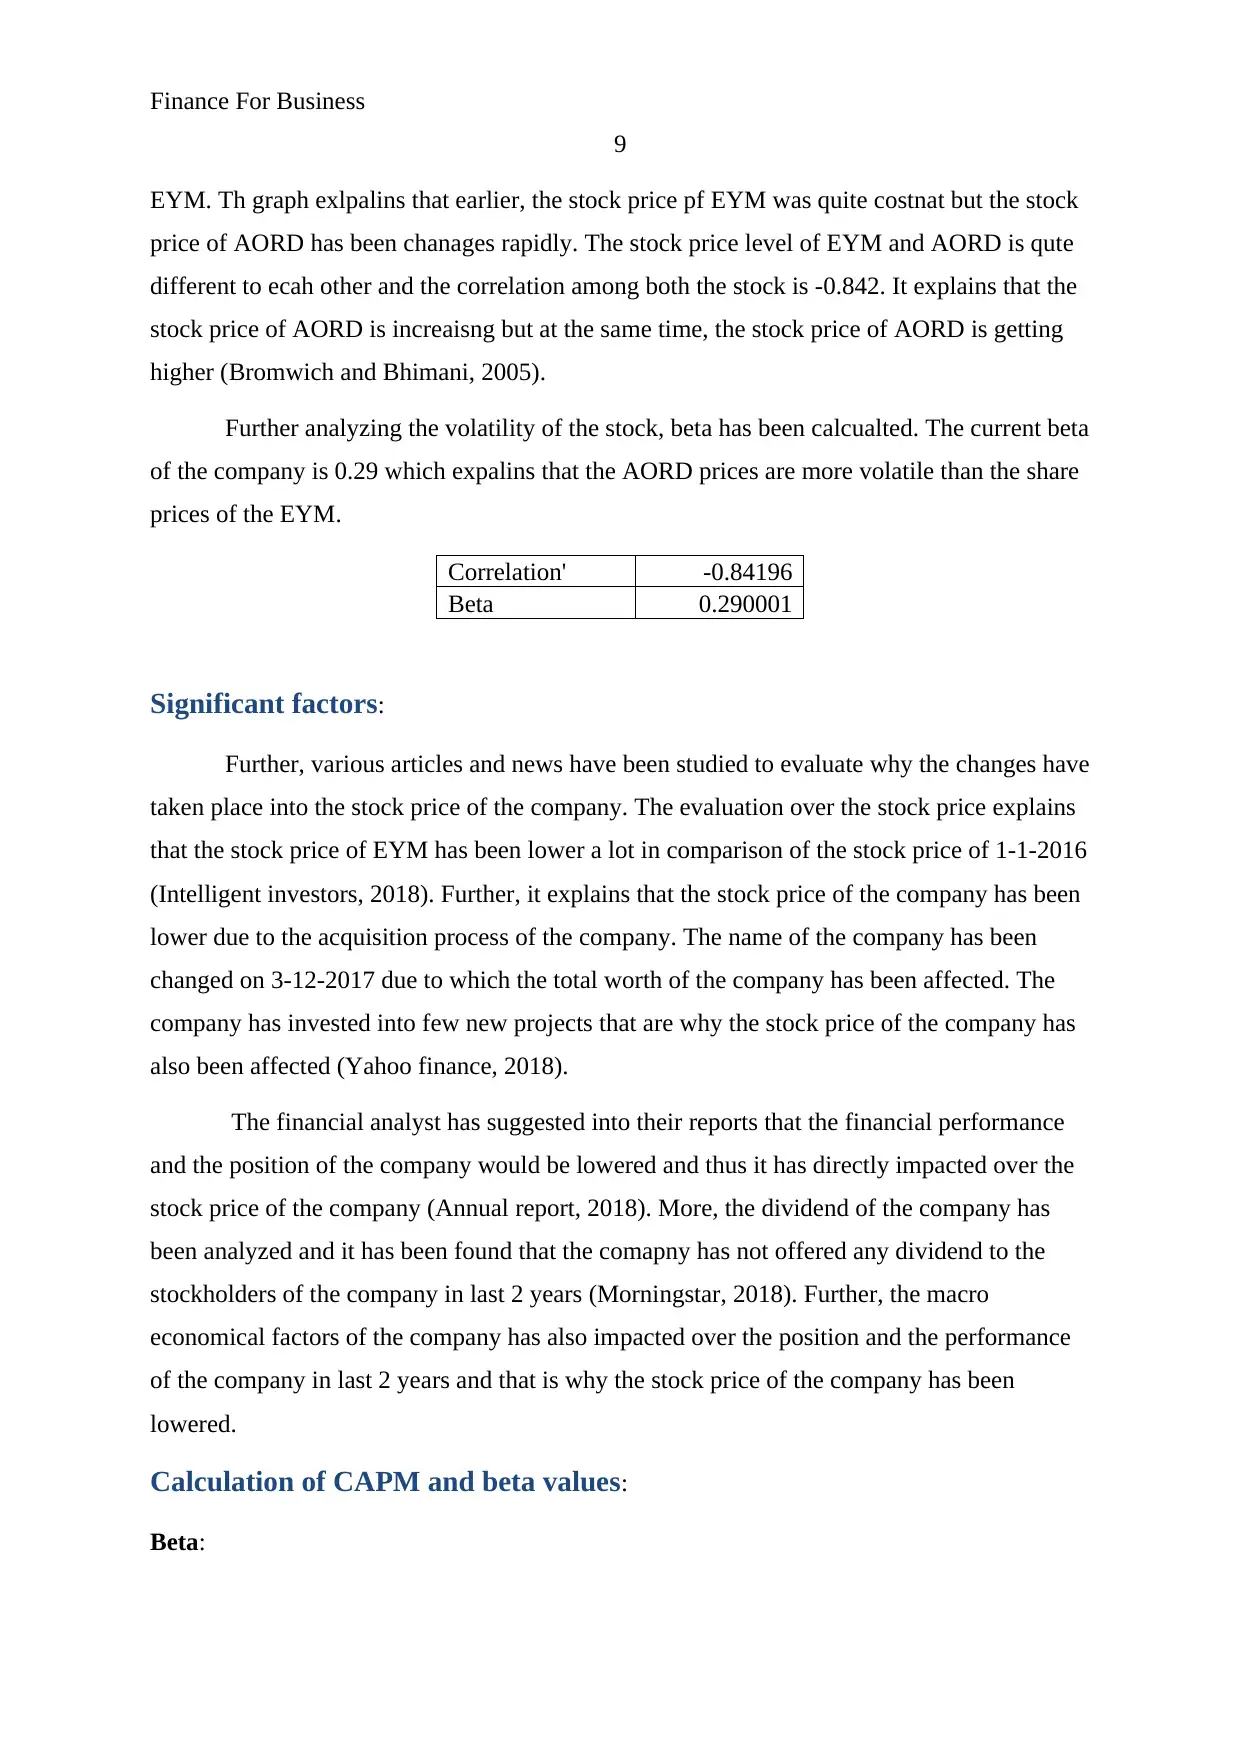
EYM. Th graph exlpalins that earlier, the stock price pf EYM was quite costnat but the stock
price of AORD has been chanages rapidly. The stock price level of EYM and AORD is qute
different to ecah other and the correlation among both the stock is -0.842. It explains that the
stock price of AORD is increaisng but at the same time, the stock price of AORD is getting
higher (Bromwich and Bhimani, 2005).
Further analyzing the volatility of the stock, beta has been calcualted. The current beta
of the company is 0.29 which expalins that the AORD prices are more volatile than the share
prices of the EYM.
Correlation' -0.84196
Beta 0.290001
Significant factors:
Further, various articles and news have been studied to evaluate why the changes have
taken place into the stock price of the company. The evaluation over the stock price explains
that the stock price of EYM has been lower a lot in comparison of the stock price of 1-1-2016
(Intelligent investors, 2018). Further, it explains that the stock price of the company has been
lower due to the acquisition process of the company. The name of the company has been
changed on 3-12-2017 due to which the total worth of the company has been affected. The
company has invested into few new projects that are why the stock price of the company has
also been affected (Yahoo finance, 2018).
The financial analyst has suggested into their reports that the financial performance
and the position of the company would be lowered and thus it has directly impacted over the
stock price of the company (Annual report, 2018). More, the dividend of the company has
been analyzed and it has been found that the comapny has not offered any dividend to the
stockholders of the company in last 2 years (Morningstar, 2018). Further, the macro
economical factors of the company has also impacted over the position and the performance
of the company in last 2 years and that is why the stock price of the company has been
lowered.
Calculation of CAPM and beta values:
Beta:
9
EYM. Th graph exlpalins that earlier, the stock price pf EYM was quite costnat but the stock
price of AORD has been chanages rapidly. The stock price level of EYM and AORD is qute
different to ecah other and the correlation among both the stock is -0.842. It explains that the
stock price of AORD is increaisng but at the same time, the stock price of AORD is getting
higher (Bromwich and Bhimani, 2005).
Further analyzing the volatility of the stock, beta has been calcualted. The current beta
of the company is 0.29 which expalins that the AORD prices are more volatile than the share
prices of the EYM.
Correlation' -0.84196
Beta 0.290001
Significant factors:
Further, various articles and news have been studied to evaluate why the changes have
taken place into the stock price of the company. The evaluation over the stock price explains
that the stock price of EYM has been lower a lot in comparison of the stock price of 1-1-2016
(Intelligent investors, 2018). Further, it explains that the stock price of the company has been
lower due to the acquisition process of the company. The name of the company has been
changed on 3-12-2017 due to which the total worth of the company has been affected. The
company has invested into few new projects that are why the stock price of the company has
also been affected (Yahoo finance, 2018).
The financial analyst has suggested into their reports that the financial performance
and the position of the company would be lowered and thus it has directly impacted over the
stock price of the company (Annual report, 2018). More, the dividend of the company has
been analyzed and it has been found that the comapny has not offered any dividend to the
stockholders of the company in last 2 years (Morningstar, 2018). Further, the macro
economical factors of the company has also impacted over the position and the performance
of the company in last 2 years and that is why the stock price of the company has been
lowered.
Calculation of CAPM and beta values:
Beta:
⊘ This is a preview!⊘
Do you want full access?
Subscribe today to unlock all pages.
Trusted by 1+ million students worldwide
Finance For Business
10
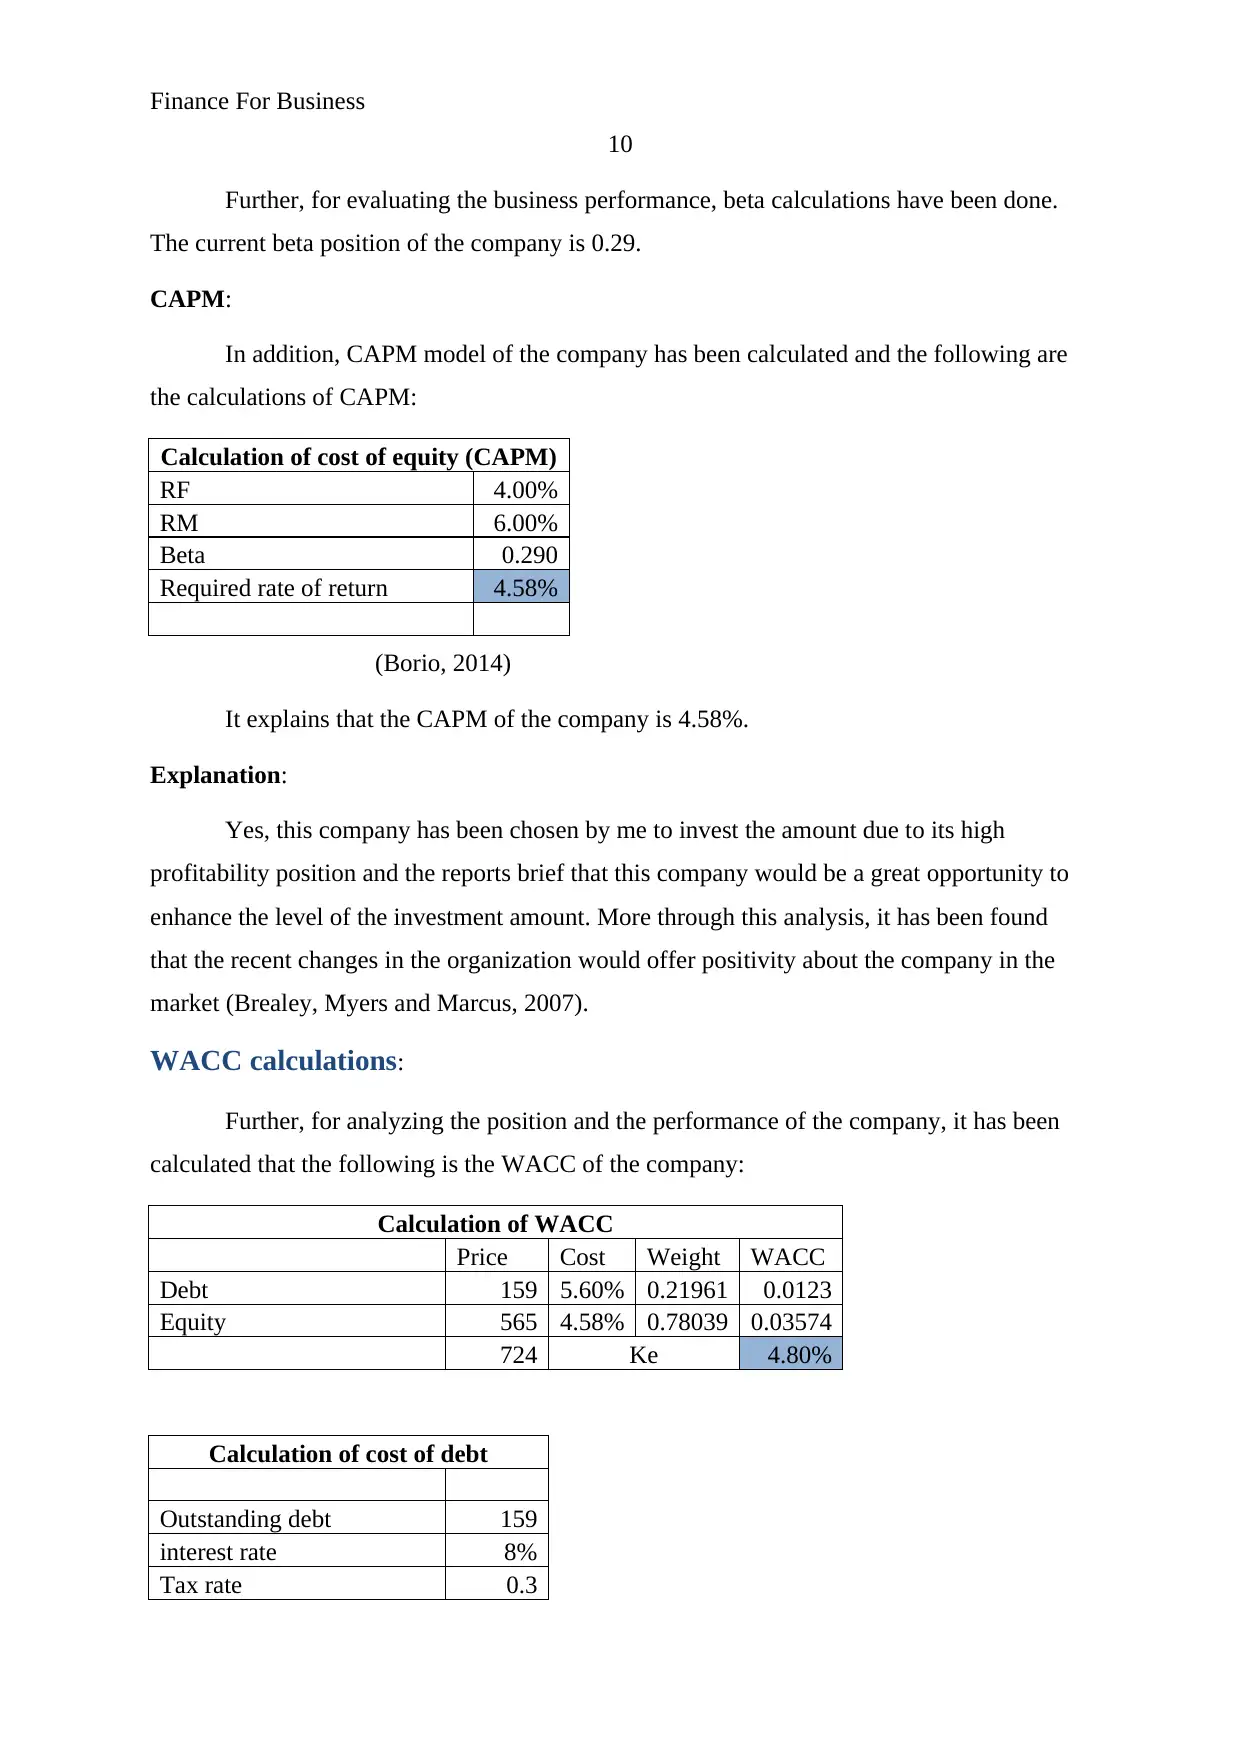
Further, for evaluating the business performance, beta calculations have been done.
The current beta position of the company is 0.29.
CAPM:
In addition, CAPM model of the company has been calculated and the following are
the calculations of CAPM:
Calculation of cost of equity (CAPM)
RF 4.00%
RM 6.00%
Beta 0.290
Required rate of return 4.58%
(Borio, 2014)
It explains that the CAPM of the company is 4.58%.
Explanation:
Yes, this company has been chosen by me to invest the amount due to its high
profitability position and the reports brief that this company would be a great opportunity to
enhance the level of the investment amount. More through this analysis, it has been found
that the recent changes in the organization would offer positivity about the company in the
market (Brealey, Myers and Marcus, 2007).
WACC calculations:
Further, for analyzing the position and the performance of the company, it has been
calculated that the following is the WACC of the company:
Calculation of WACC
Price Cost Weight WACC
Debt 159 5.60% 0.21961 0.0123
Equity 565 4.58% 0.78039 0.03574
724 Ke 4.80%
Calculation of cost of debt
Outstanding debt 159
interest rate 8%
Tax rate 0.3
10
Further, for evaluating the business performance, beta calculations have been done.
The current beta position of the company is 0.29.
CAPM:
In addition, CAPM model of the company has been calculated and the following are
the calculations of CAPM:
Calculation of cost of equity (CAPM)
RF 4.00%
RM 6.00%
Beta 0.290
Required rate of return 4.58%
(Borio, 2014)
It explains that the CAPM of the company is 4.58%.
Explanation:
Yes, this company has been chosen by me to invest the amount due to its high
profitability position and the reports brief that this company would be a great opportunity to
enhance the level of the investment amount. More through this analysis, it has been found
that the recent changes in the organization would offer positivity about the company in the
market (Brealey, Myers and Marcus, 2007).
WACC calculations:
Further, for analyzing the position and the performance of the company, it has been
calculated that the following is the WACC of the company:
Calculation of WACC
Price Cost Weight WACC
Debt 159 5.60% 0.21961 0.0123
Equity 565 4.58% 0.78039 0.03574
724 Ke 4.80%
Calculation of cost of debt
Outstanding debt 159
interest rate 8%
Tax rate 0.3
Paraphrase This Document
Need a fresh take? Get an instant paraphrase of this document with our AI Paraphraser
Finance For Business
11
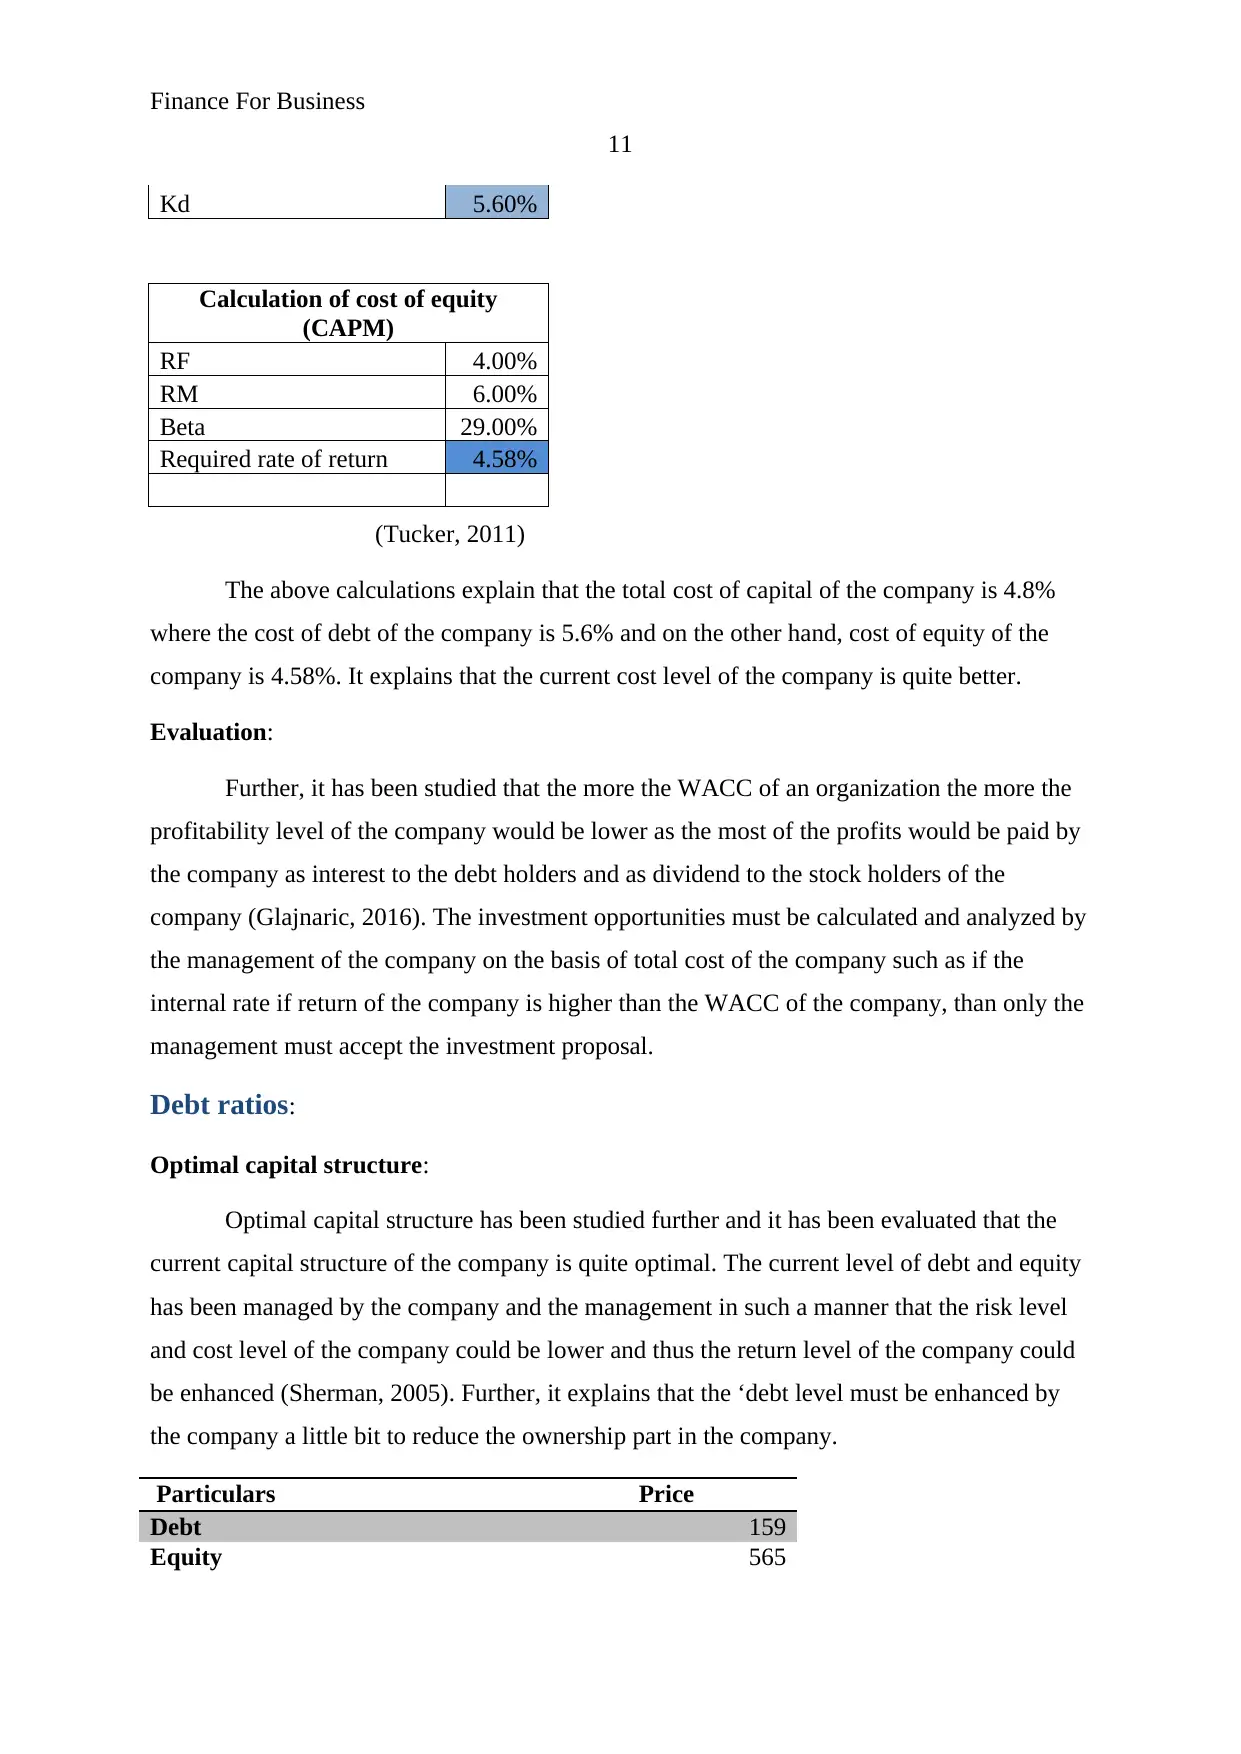
Kd 5.60%
Calculation of cost of equity
(CAPM)
RF 4.00%
RM 6.00%
Beta 29.00%
Required rate of return 4.58%
(Tucker, 2011)
The above calculations explain that the total cost of capital of the company is 4.8%
where the cost of debt of the company is 5.6% and on the other hand, cost of equity of the
company is 4.58%. It explains that the current cost level of the company is quite better.
Evaluation:
Further, it has been studied that the more the WACC of an organization the more the
profitability level of the company would be lower as the most of the profits would be paid by
the company as interest to the debt holders and as dividend to the stock holders of the
company (Glajnaric, 2016). The investment opportunities must be calculated and analyzed by
the management of the company on the basis of total cost of the company such as if the
internal rate if return of the company is higher than the WACC of the company, than only the
management must accept the investment proposal.
Debt ratios:
Optimal capital structure:
Optimal capital structure has been studied further and it has been evaluated that the
current capital structure of the company is quite optimal. The current level of debt and equity
has been managed by the company and the management in such a manner that the risk level
and cost level of the company could be lower and thus the return level of the company could
be enhanced (Sherman, 2005). Further, it explains that the ‘debt level must be enhanced by
the company a little bit to reduce the ownership part in the company.
Particulars Price
Debt 159
Equity 565
11
Kd 5.60%
Calculation of cost of equity
(CAPM)
RF 4.00%
RM 6.00%
Beta 29.00%
Required rate of return 4.58%
(Tucker, 2011)
The above calculations explain that the total cost of capital of the company is 4.8%
where the cost of debt of the company is 5.6% and on the other hand, cost of equity of the
company is 4.58%. It explains that the current cost level of the company is quite better.
Evaluation:
Further, it has been studied that the more the WACC of an organization the more the
profitability level of the company would be lower as the most of the profits would be paid by
the company as interest to the debt holders and as dividend to the stock holders of the
company (Glajnaric, 2016). The investment opportunities must be calculated and analyzed by
the management of the company on the basis of total cost of the company such as if the
internal rate if return of the company is higher than the WACC of the company, than only the
management must accept the investment proposal.
Debt ratios:
Optimal capital structure:
Optimal capital structure has been studied further and it has been evaluated that the
current capital structure of the company is quite optimal. The current level of debt and equity
has been managed by the company and the management in such a manner that the risk level
and cost level of the company could be lower and thus the return level of the company could
be enhanced (Sherman, 2005). Further, it explains that the ‘debt level must be enhanced by
the company a little bit to reduce the ownership part in the company.
Particulars Price
Debt 159
Equity 565
Finance For Business
12
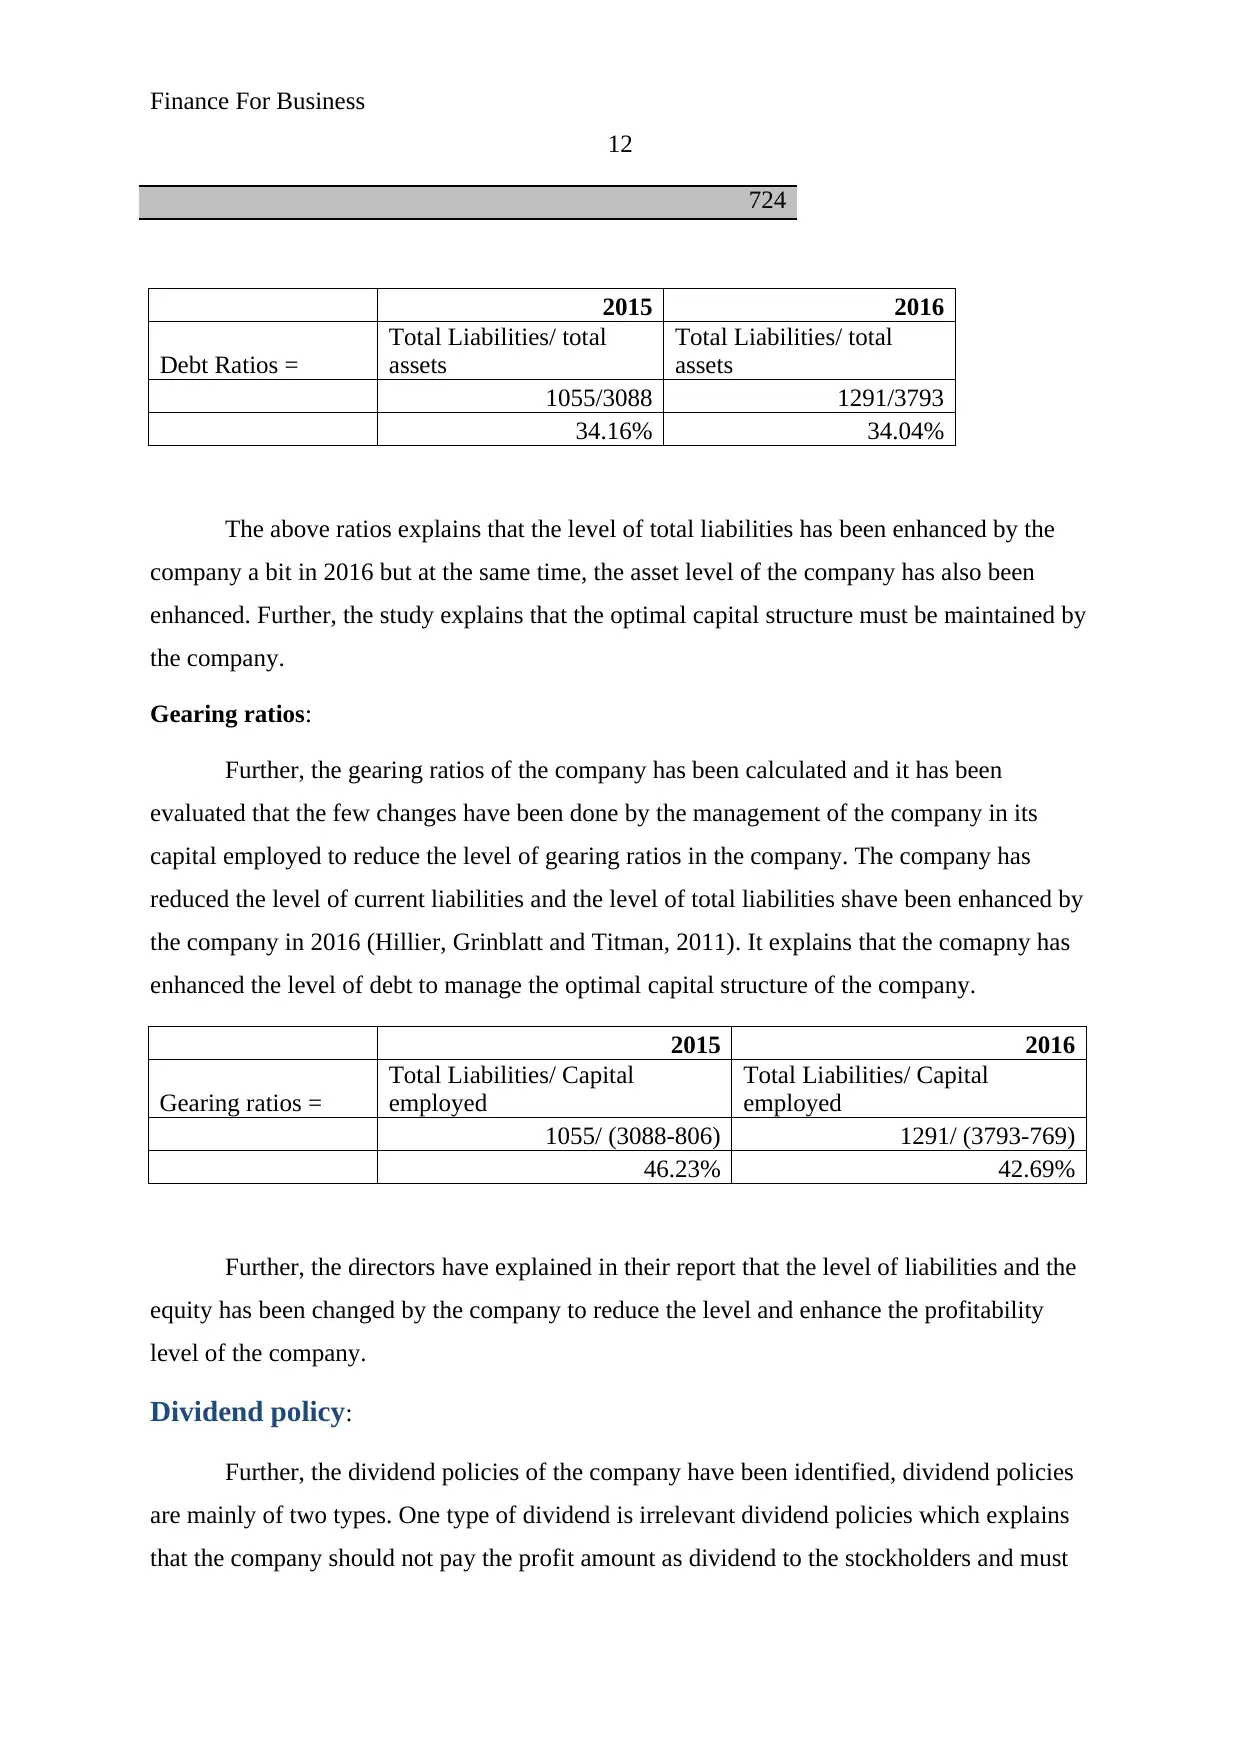
724
2015 2016
Debt Ratios =
Total Liabilities/ total
assets
Total Liabilities/ total
assets
1055/3088 1291/3793
34.16% 34.04%
The above ratios explains that the level of total liabilities has been enhanced by the
company a bit in 2016 but at the same time, the asset level of the company has also been
enhanced. Further, the study explains that the optimal capital structure must be maintained by
the company.
Gearing ratios:
Further, the gearing ratios of the company has been calculated and it has been
evaluated that the few changes have been done by the management of the company in its
capital employed to reduce the level of gearing ratios in the company. The company has
reduced the level of current liabilities and the level of total liabilities shave been enhanced by
the company in 2016 (Hillier, Grinblatt and Titman, 2011). It explains that the comapny has
enhanced the level of debt to manage the optimal capital structure of the company.
2015 2016
Gearing ratios =
Total Liabilities/ Capital
employed
Total Liabilities/ Capital
employed
1055/ (3088-806) 1291/ (3793-769)
46.23% 42.69%
Further, the directors have explained in their report that the level of liabilities and the
equity has been changed by the company to reduce the level and enhance the profitability
level of the company.
Dividend policy:
Further, the dividend policies of the company have been identified, dividend policies
are mainly of two types. One type of dividend is irrelevant dividend policies which explains
that the company should not pay the profit amount as dividend to the stockholders and must
12
724
2015 2016
Debt Ratios =
Total Liabilities/ total
assets
Total Liabilities/ total
assets
1055/3088 1291/3793
34.16% 34.04%
The above ratios explains that the level of total liabilities has been enhanced by the
company a bit in 2016 but at the same time, the asset level of the company has also been
enhanced. Further, the study explains that the optimal capital structure must be maintained by
the company.
Gearing ratios:
Further, the gearing ratios of the company has been calculated and it has been
evaluated that the few changes have been done by the management of the company in its
capital employed to reduce the level of gearing ratios in the company. The company has
reduced the level of current liabilities and the level of total liabilities shave been enhanced by
the company in 2016 (Hillier, Grinblatt and Titman, 2011). It explains that the comapny has
enhanced the level of debt to manage the optimal capital structure of the company.
2015 2016
Gearing ratios =
Total Liabilities/ Capital
employed
Total Liabilities/ Capital
employed
1055/ (3088-806) 1291/ (3793-769)
46.23% 42.69%
Further, the directors have explained in their report that the level of liabilities and the
equity has been changed by the company to reduce the level and enhance the profitability
level of the company.
Dividend policy:
Further, the dividend policies of the company have been identified, dividend policies
are mainly of two types. One type of dividend is irrelevant dividend policies which explains
that the company should not pay the profit amount as dividend to the stockholders and must
⊘ This is a preview!⊘
Do you want full access?
Subscribe today to unlock all pages.
Trusted by 1+ million students worldwide
1 out of 30
Related Documents


Your All-in-One AI-Powered Toolkit for Academic Success.
+13062052269
info@desklib.com
Available 24*7 on WhatsApp / Email
![[object Object]](/_next/static/media/star-bottom.7253800d.svg)
Unlock your academic potential
Copyright © 2020–2026 A2Z Services. All Rights Reserved. Developed and managed by ZUCOL.