Financial Management: Project and Bond Analysis Assignment Solution

Verified

Added on  2019/10/31

|6
|778
|184
Homework Assignment
AI Summary
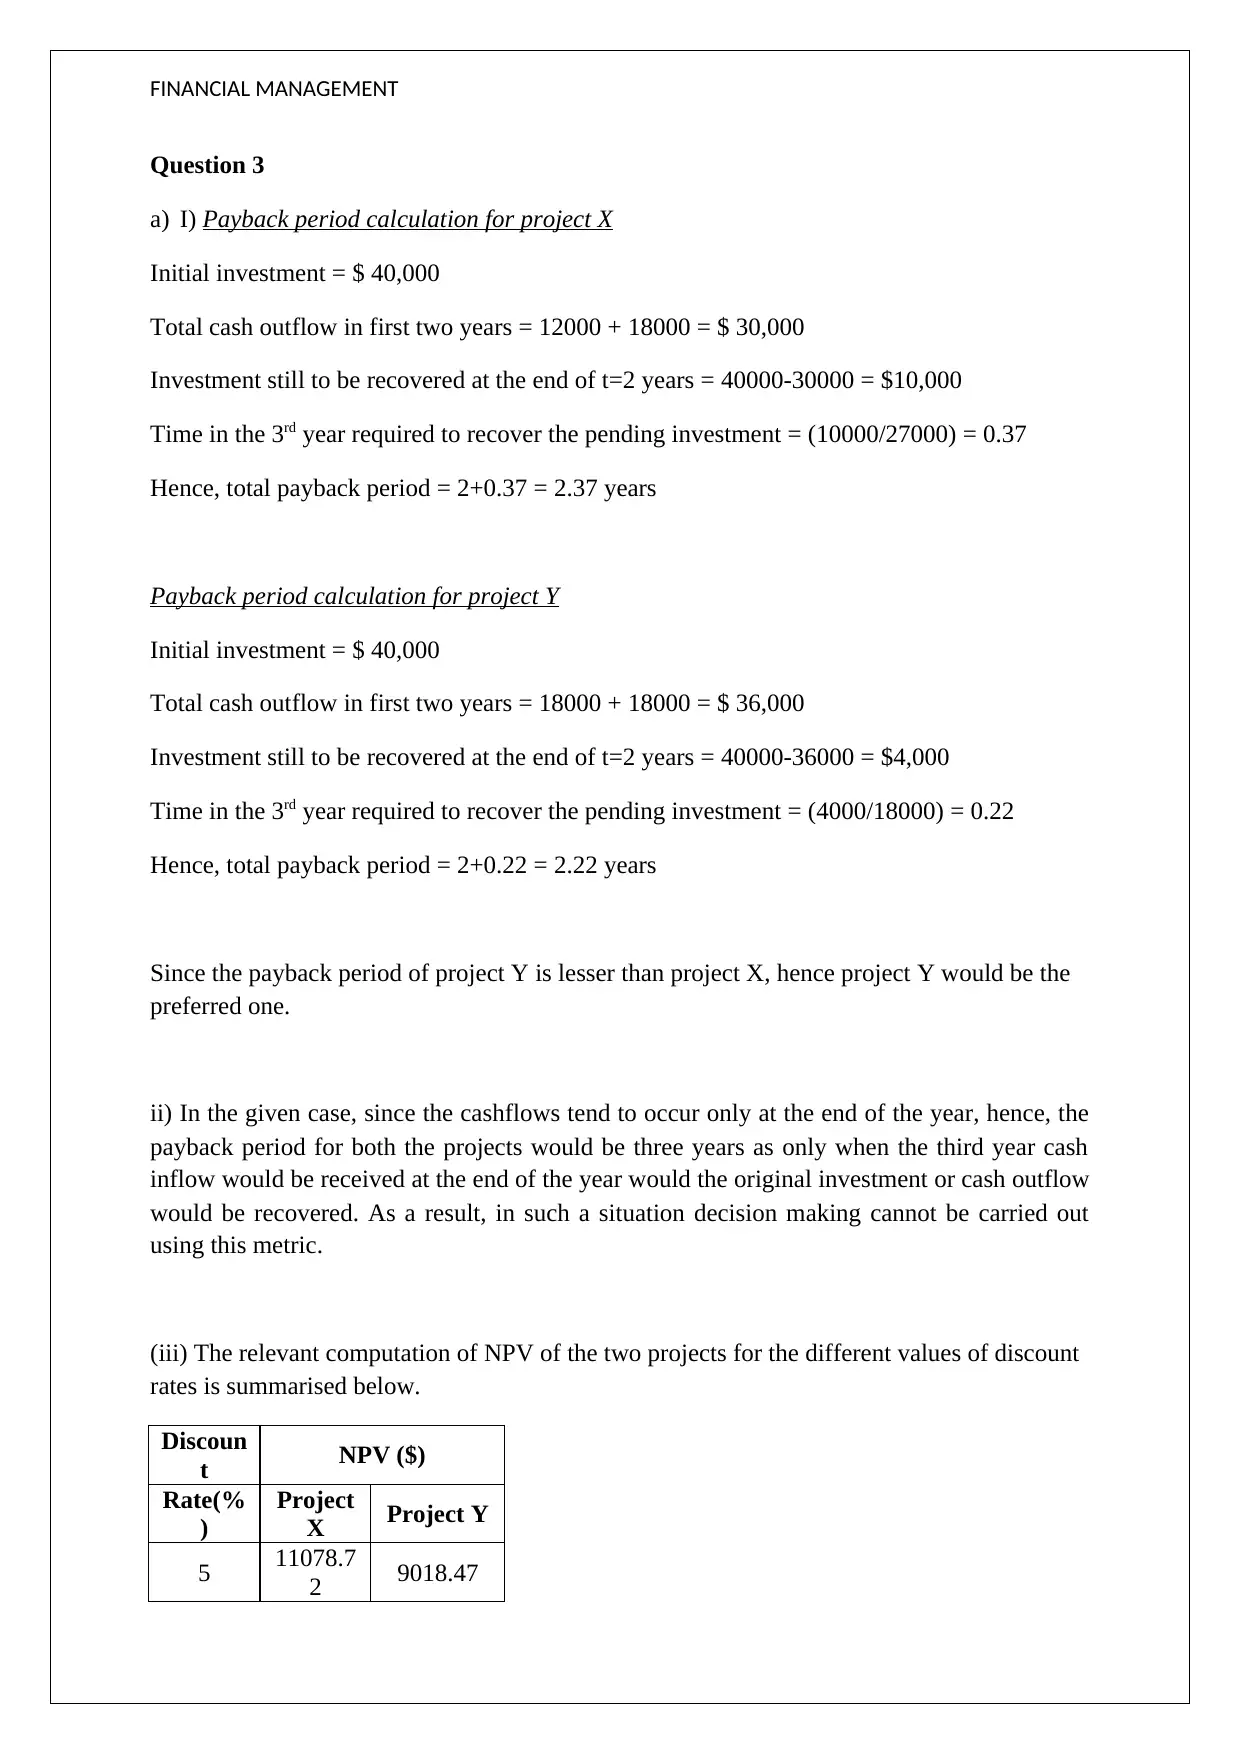
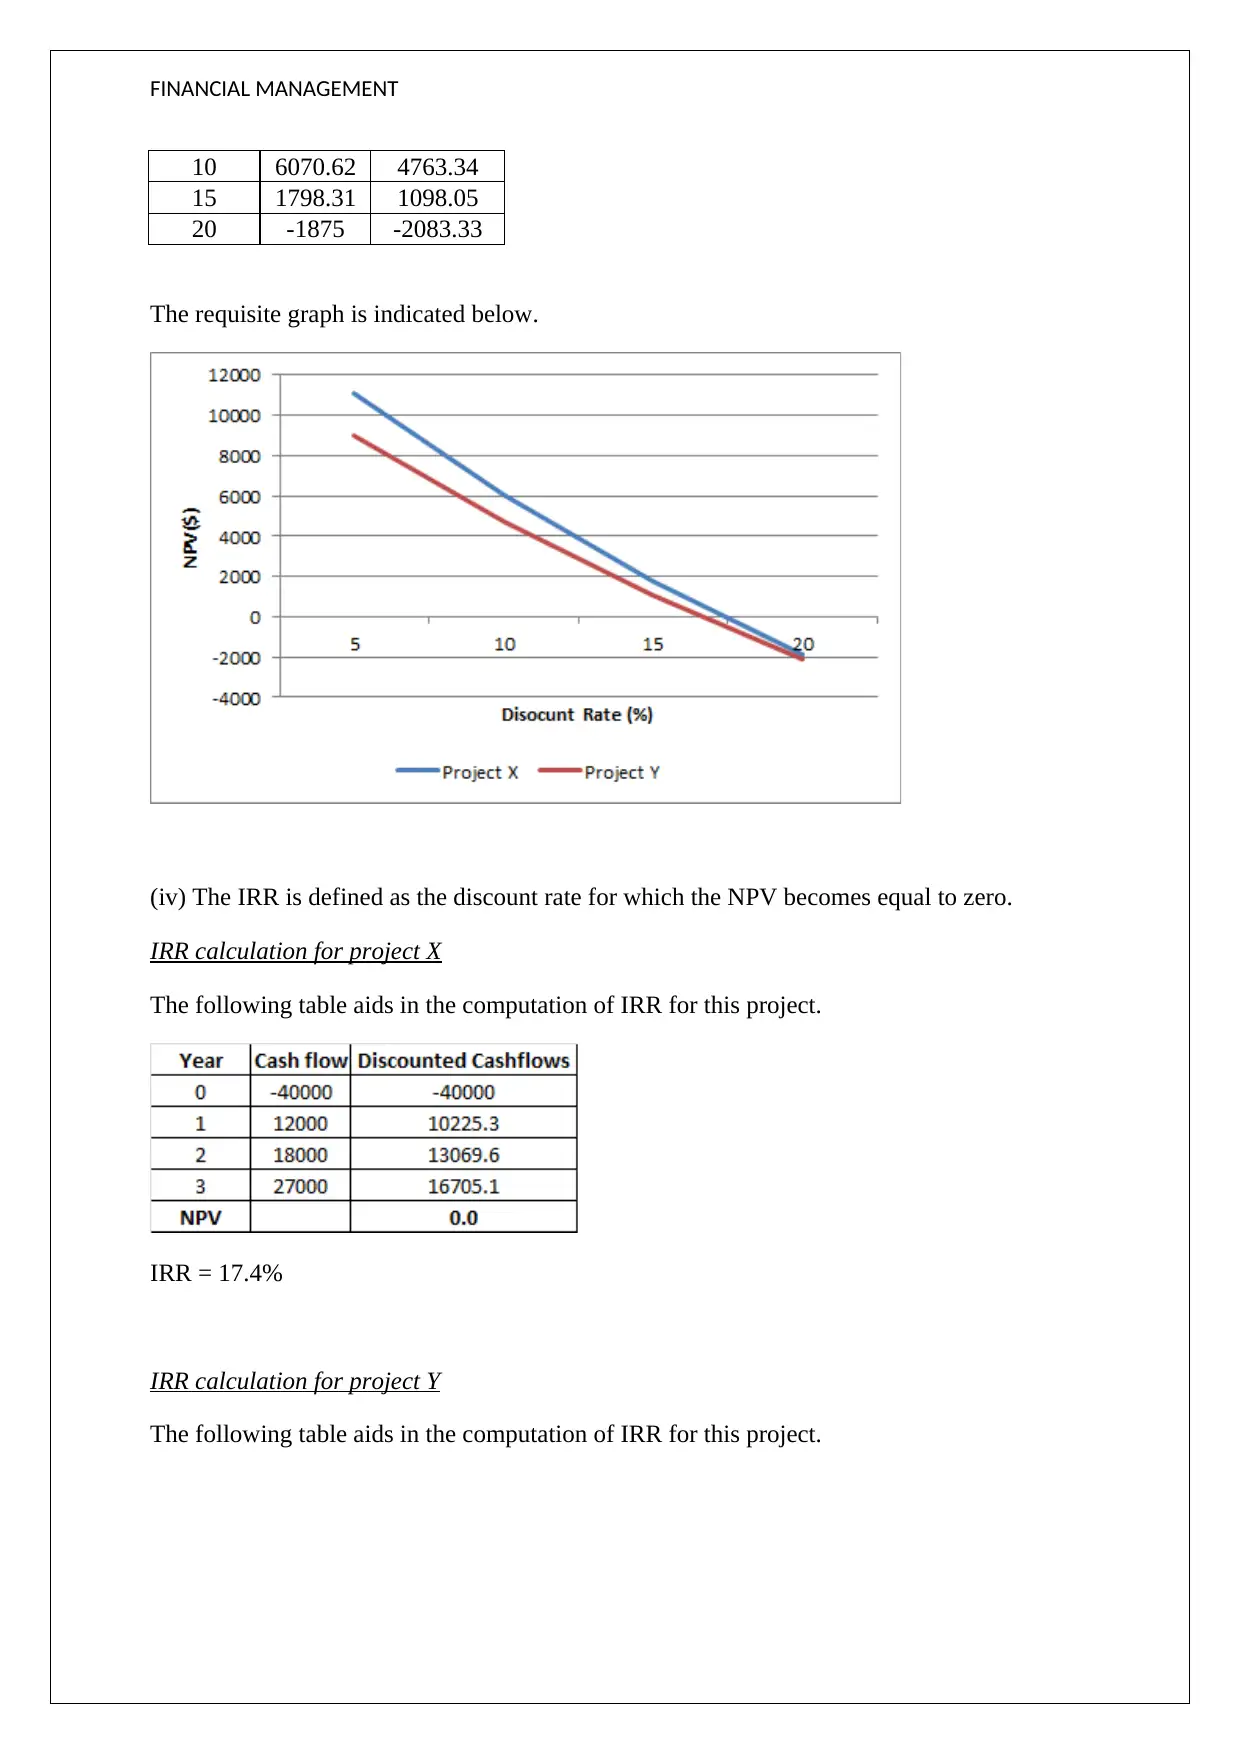
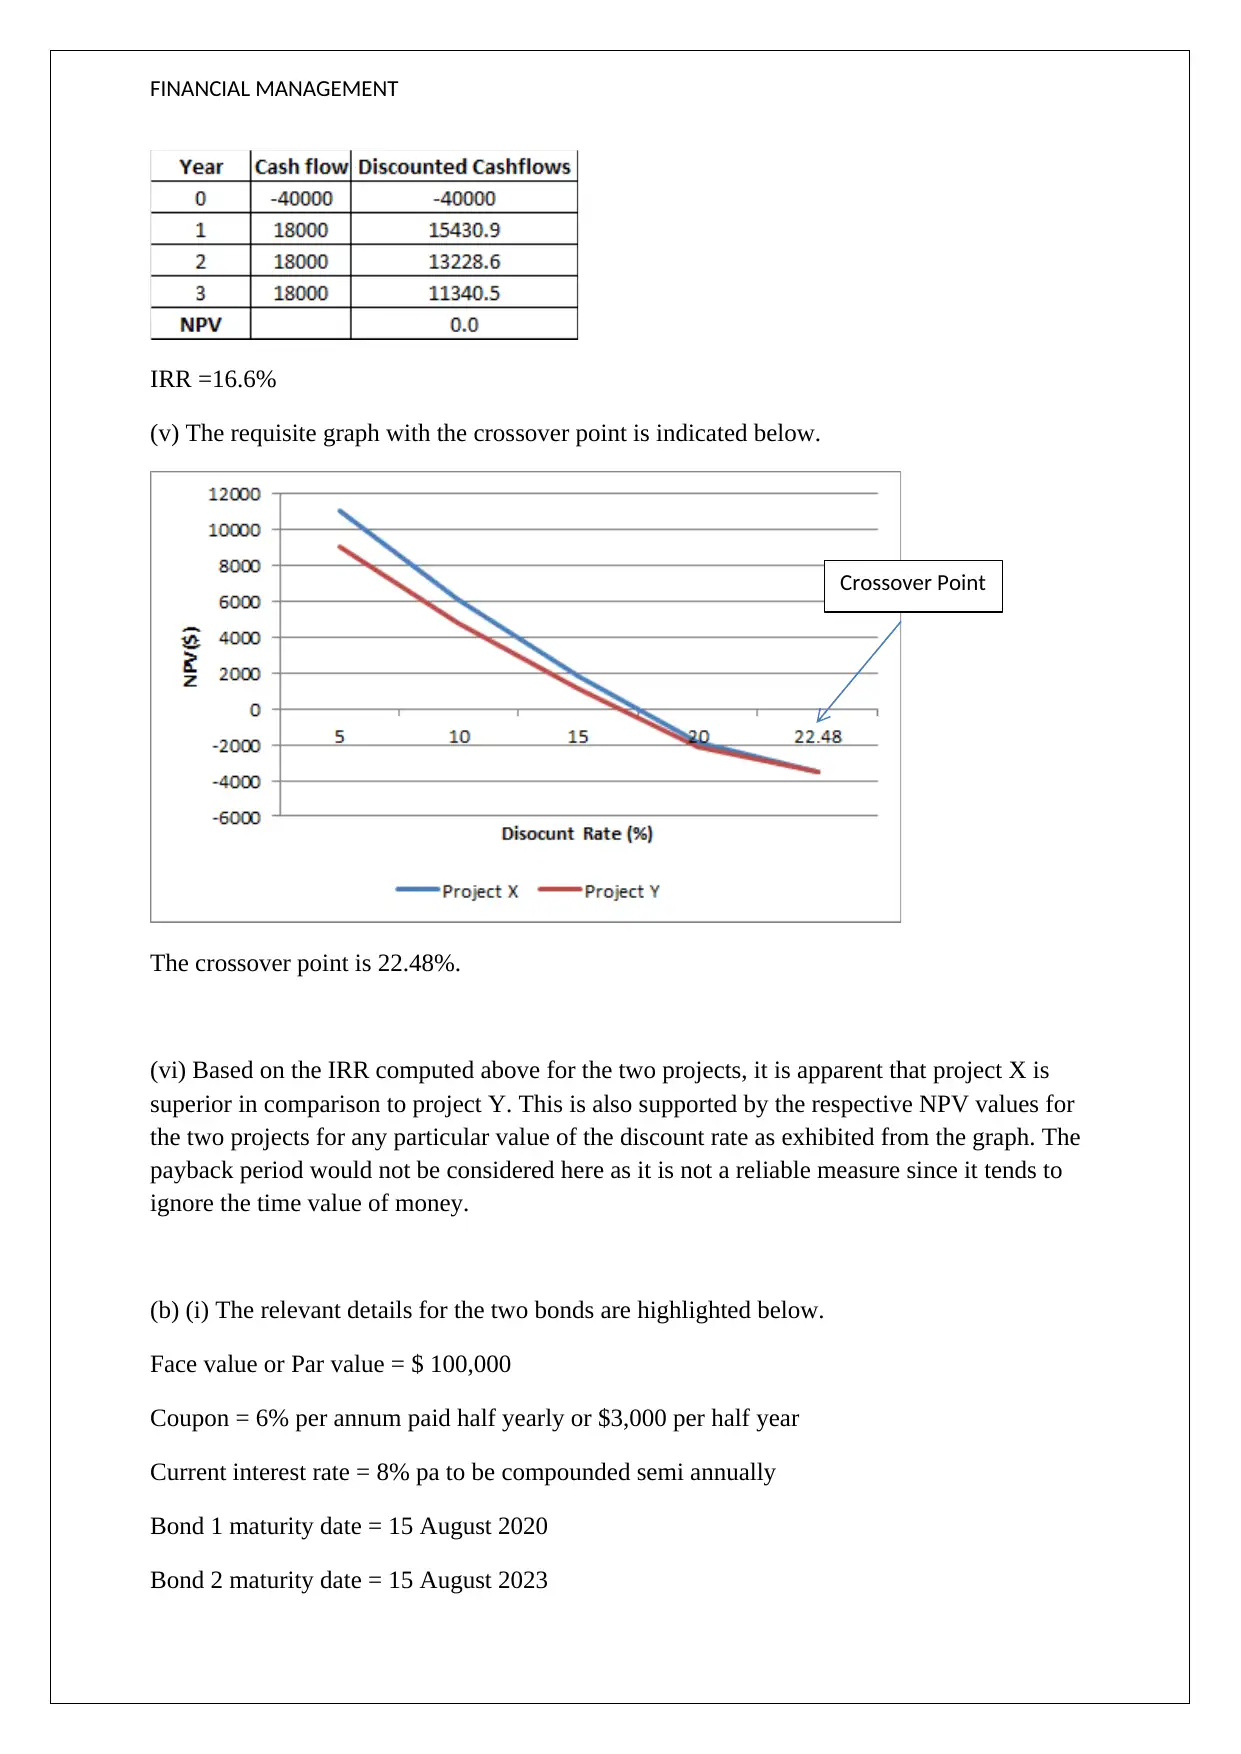
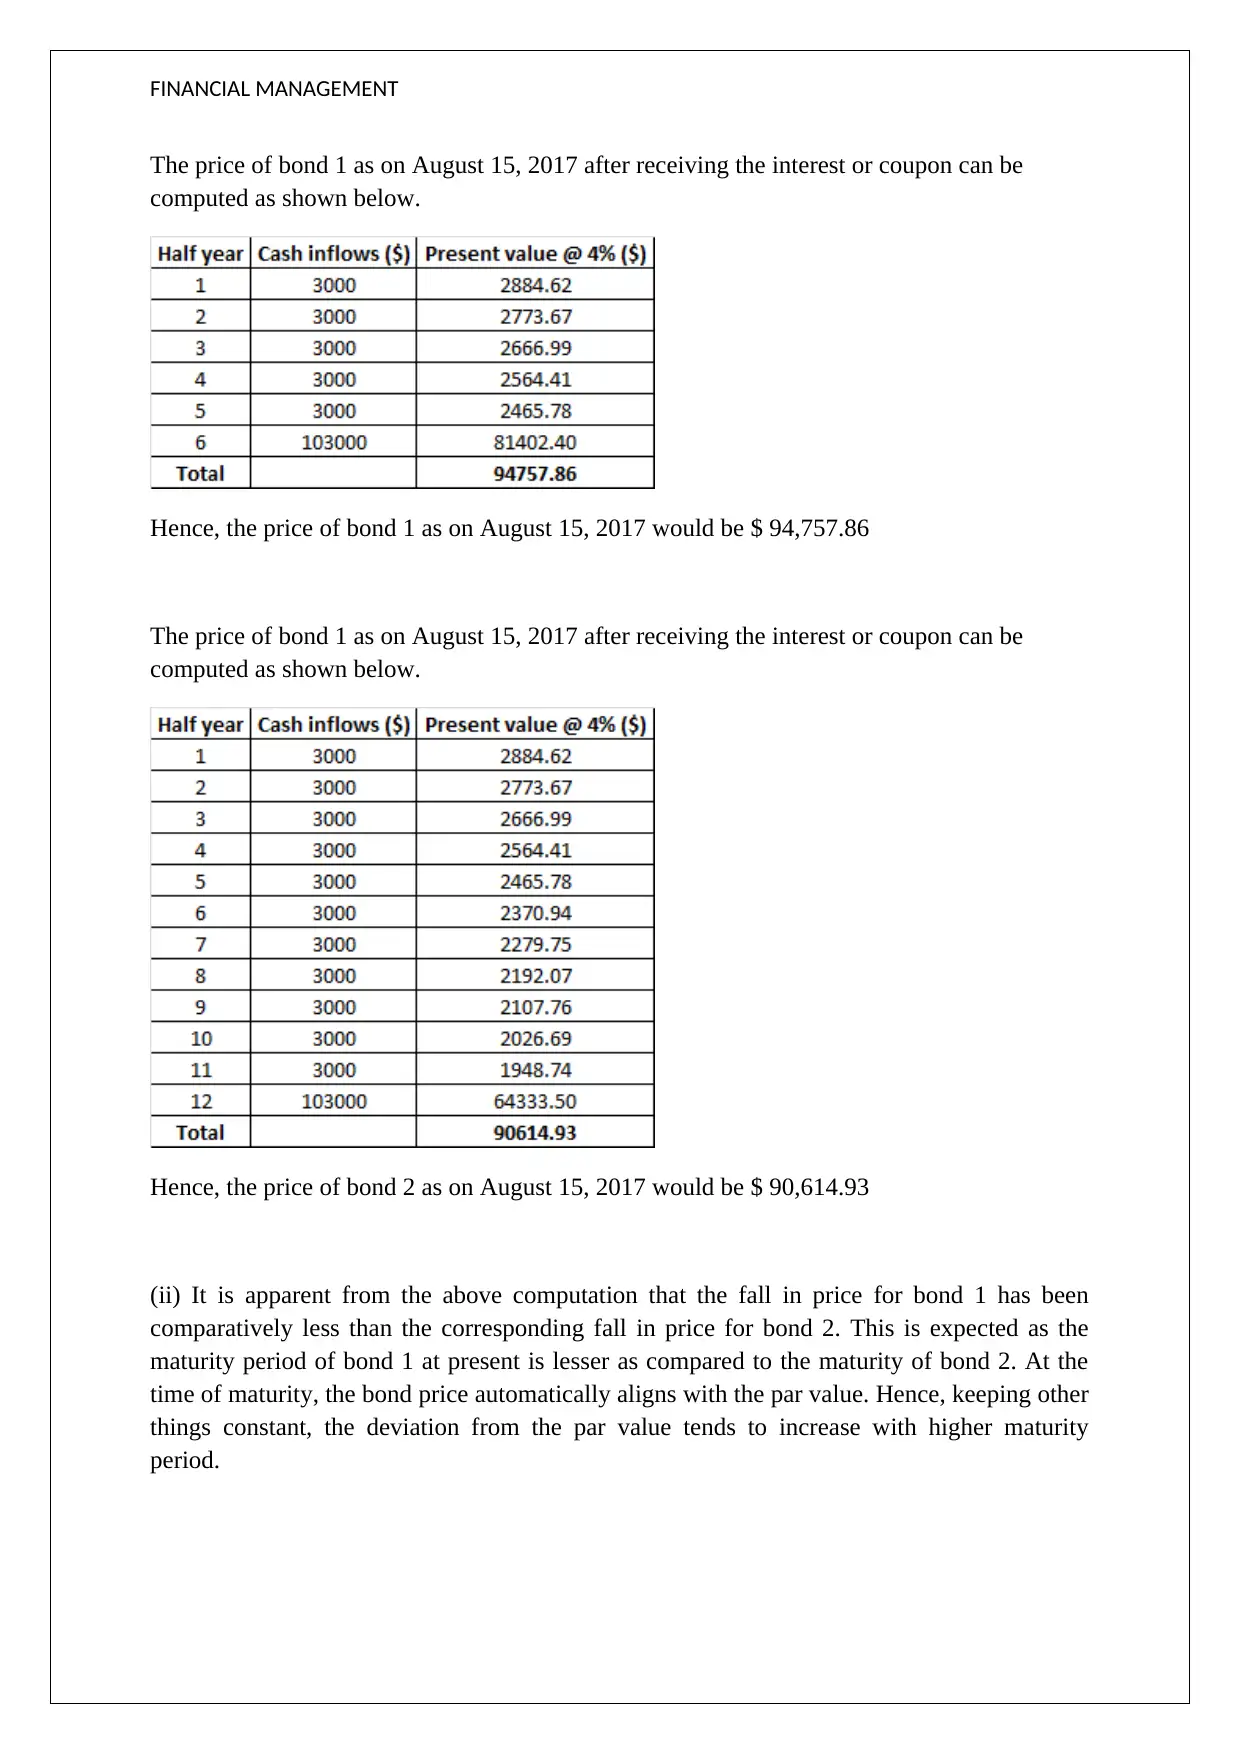
This assignment solution addresses a financial management problem, focusing on project and bond analysis. The solution begins with the calculation of the payback period for two projects, Project X and Project Y, comparing their investment recovery times. It then explores the limitations of the payback period, emphasizing the importance of considering the time value of money. The solution proceeds with the computation of the Net Present Value (NPV) for both projects at varying discount rates, supported by a graphical representation. It then delves into the Internal Rate of Return (IRR) calculation for each project, determining the discount rate at which the NPV equals zero, and includes a graph showing the crossover point. Based on IRR and NPV, the solution recommends Project X over Project Y. The assignment also covers bond valuation, calculating the prices of two bonds with differing maturity dates. The solution explains the inverse relationship between bond prices and interest rates, demonstrating how changes in interest rates impact bond values. It also illustrates the effect of maturity period on bond price fluctuations.
Document Page
FINANCIAL MANAGEMENT
STUDENT ID:
[Pick the date]
tabler-icon-diamond-filled.svg

Paraphrase This Document

Need a fresh take? Get an instant paraphrase of this document with our AI Paraphraser
Document Page
FINANCIAL MANAGEMENT
Question 3
a) I) Payback period calculation for project X
Initial investment = $ 40,000
Total cash outflow in first two years = 12000 + 18000 = $ 30,000
Investment still to be recovered at the end of t=2 years = 40000-30000 = $10,000
Time in the 3rd year required to recover the pending investment = (10000/27000) = 0.37
Hence, total payback period = 2+0.37 = 2.37 years
Payback period calculation for project Y
Initial investment = $ 40,000
Total cash outflow in first two years = 18000 + 18000 = $ 36,000
Investment still to be recovered at the end of t=2 years = 40000-36000 = $4,000
Time in the 3rd year required to recover the pending investment = (4000/18000) = 0.22
Hence, total payback period = 2+0.22 = 2.22 years
Since the payback period of project Y is lesser than project X, hence project Y would be the
preferred one.
ii) In the given case, since the cashflows tend to occur only at the end of the year, hence, the
payback period for both the projects would be three years as only when the third year cash
inflow would be received at the end of the year would the original investment or cash outflow
would be recovered. As a result, in such a situation decision making cannot be carried out
using this metric.
(iii) The relevant computation of NPV of the two projects for the different values of discount
rates is summarised below.
Discoun
t NPV ($)
Rate(%
)
Project
X Project Y
5 11078.7
2 9018.47
Document Page
FINANCIAL MANAGEMENT
10 6070.62 4763.34
15 1798.31 1098.05
20 -1875 -2083.33
The requisite graph is indicated below.
(iv) The IRR is defined as the discount rate for which the NPV becomes equal to zero.
IRR calculation for project X
The following table aids in the computation of IRR for this project.
IRR = 17.4%
IRR calculation for project Y
The following table aids in the computation of IRR for this project.
Document Page
FINANCIAL MANAGEMENT
IRR =16.6%
(v) The requisite graph with the crossover point is indicated below.
The crossover point is 22.48%.
(vi) Based on the IRR computed above for the two projects, it is apparent that project X is
superior in comparison to project Y. This is also supported by the respective NPV values for
the two projects for any particular value of the discount rate as exhibited from the graph. The
payback period would not be considered here as it is not a reliable measure since it tends to
ignore the time value of money.
(b) (i) The relevant details for the two bonds are highlighted below.
Face value or Par value = $ 100,000
Coupon = 6% per annum paid half yearly or $3,000 per half year
Current interest rate = 8% pa to be compounded semi annually
Bond 1 maturity date = 15 August 2020
Bond 2 maturity date = 15 August 2023
Crossover Point
tabler-icon-diamond-filled.svg

Paraphrase This Document

Need a fresh take? Get an instant paraphrase of this document with our AI Paraphraser
Document Page
FINANCIAL MANAGEMENT
The price of bond 1 as on August 15, 2017 after receiving the interest or coupon can be
computed as shown below.
Hence, the price of bond 1 as on August 15, 2017 would be $ 94,757.86
The price of bond 1 as on August 15, 2017 after receiving the interest or coupon can be
computed as shown below.
Hence, the price of bond 2 as on August 15, 2017 would be $ 90,614.93
(ii) It is apparent from the above computation that the fall in price for bond 1 has been
comparatively less than the corresponding fall in price for bond 2. This is expected as the
maturity period of bond 1 at present is lesser as compared to the maturity of bond 2. At the
time of maturity, the bond price automatically aligns with the par value. Hence, keeping other
things constant, the deviation from the par value tends to increase with higher maturity
period.
Document Page
FINANCIAL MANAGEMENT
(iii) It is apparent that the price for the bonds would be higher than their corresponding price
on August 15, 2017
= $ 2,935.5
Price of bond 1= 94,757.86*(1+(4/18400))84 = $96,503.93
Price of bond 2= 90,614.93*(1+(4/18400))84 = $ 92,284.65
chevron_up_icon
1 out of 6
circle_padding
hide_on_mobile
zoom_out_icon
[object Object]