SBM3108 Financial Accounting Assignment 2: Ratio Analysis of Companies

Verified

Added on  2023/02/03

|13
|369
|84
Report
AI Summary
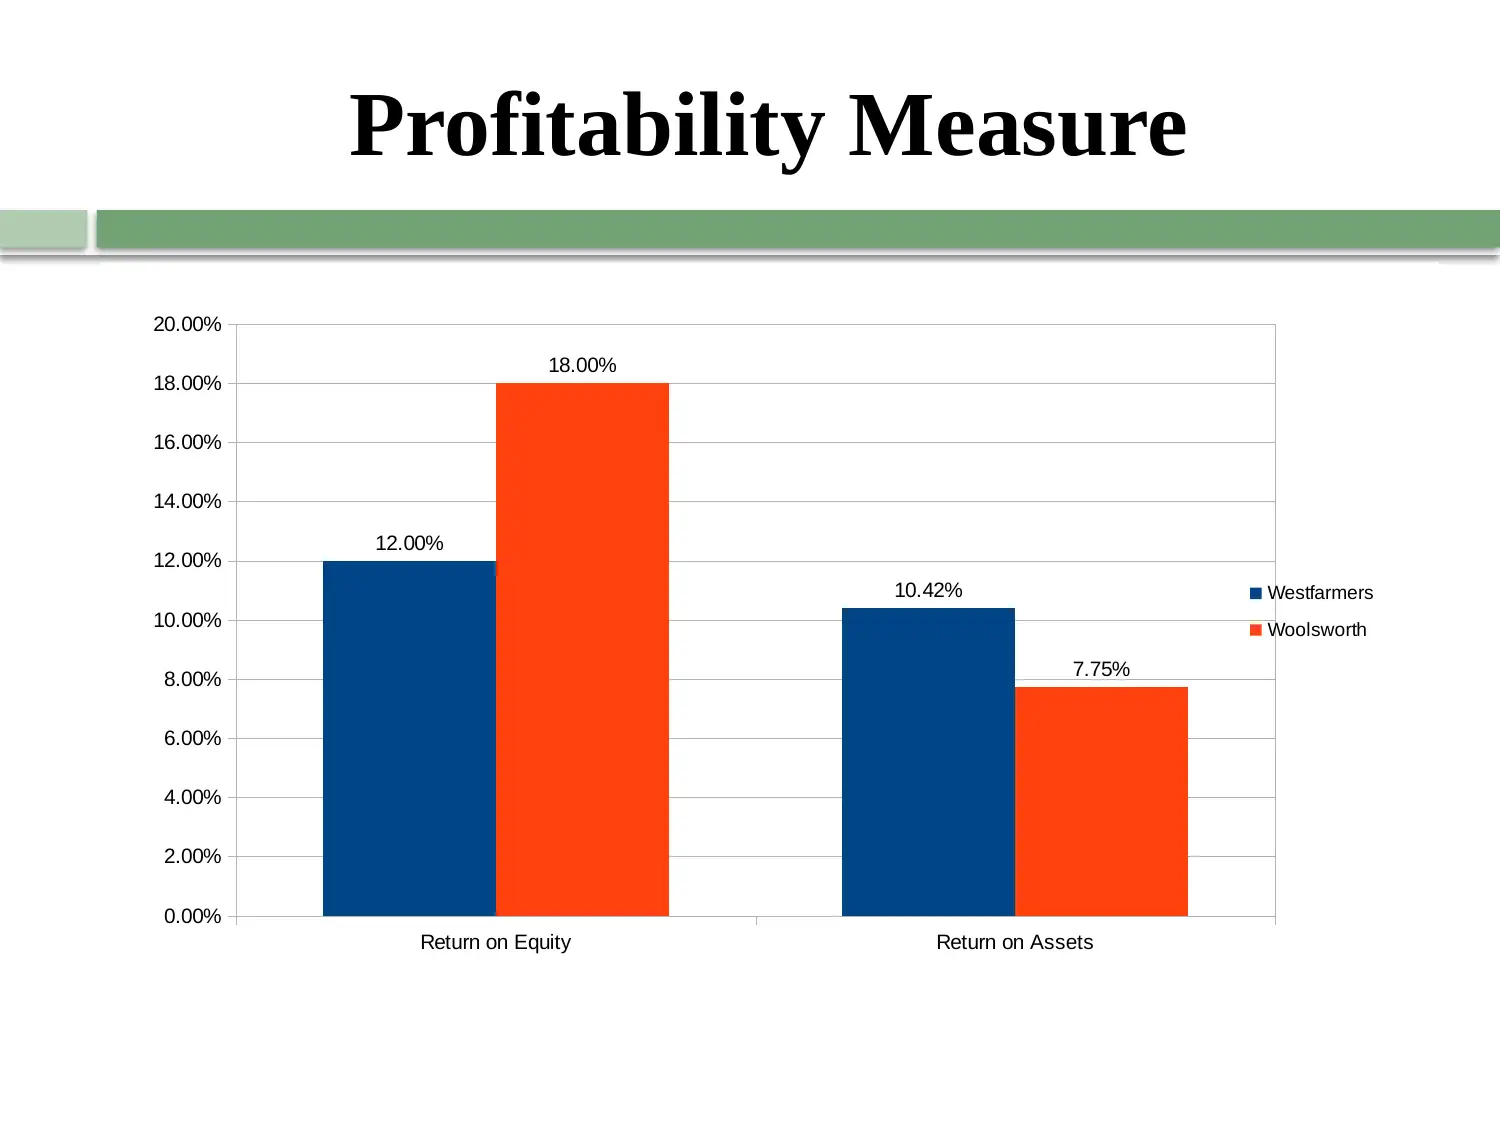
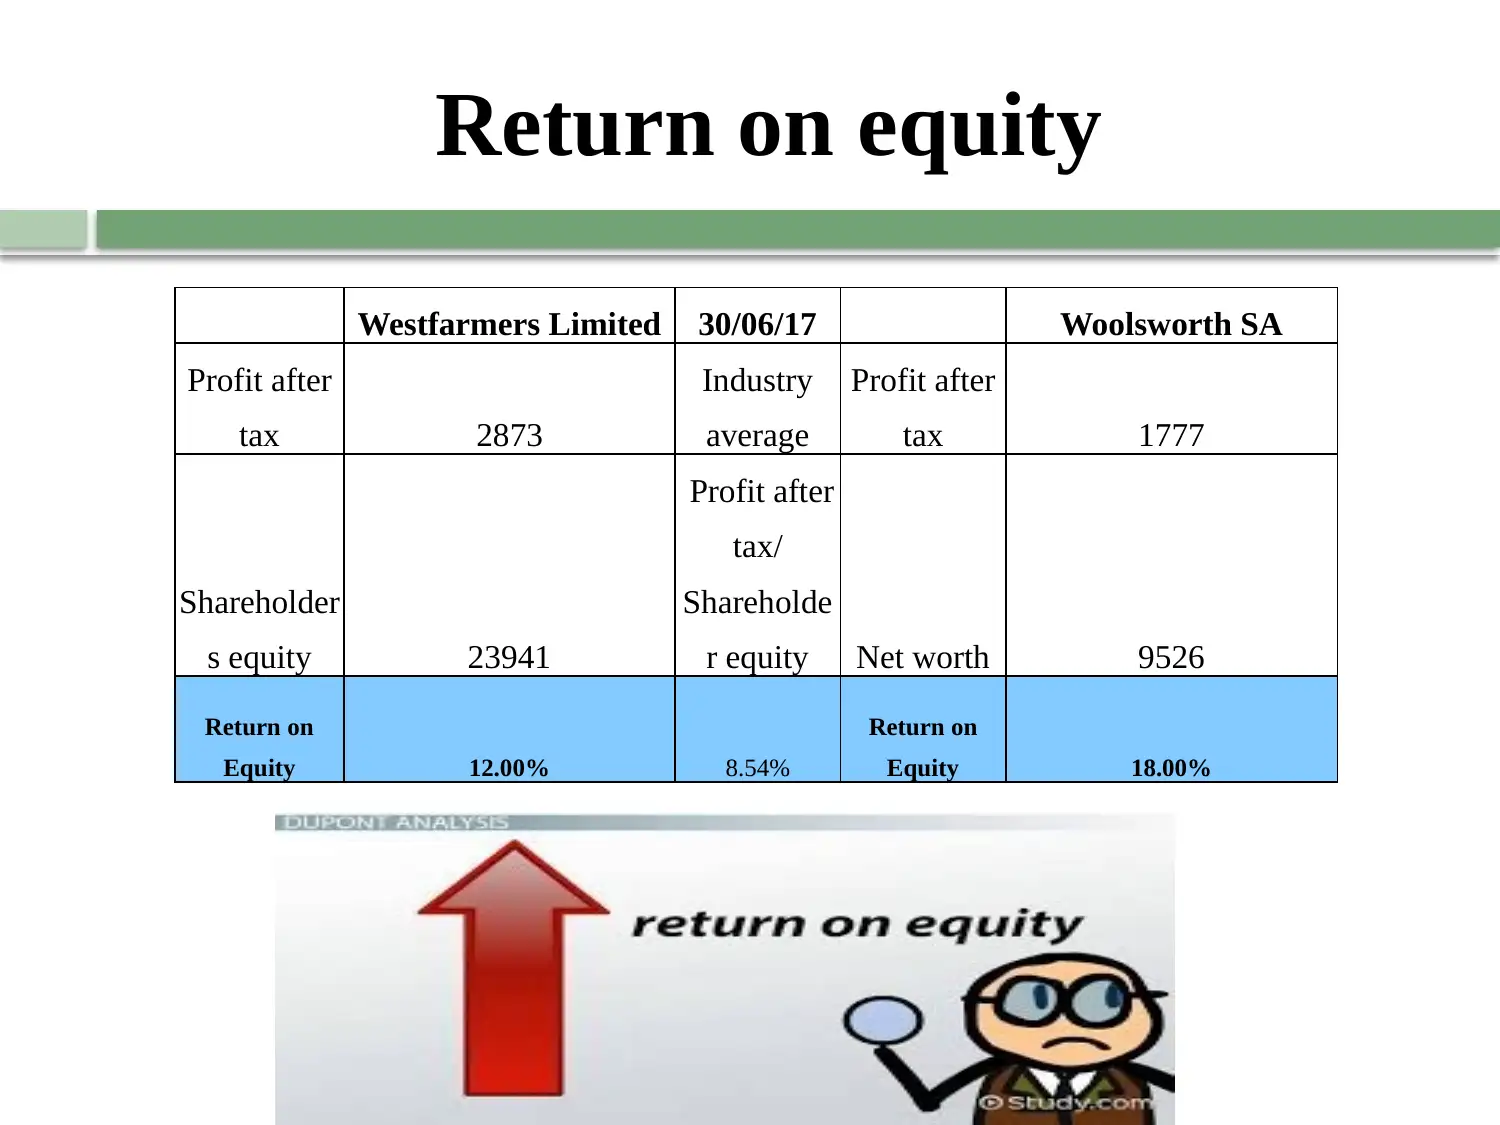
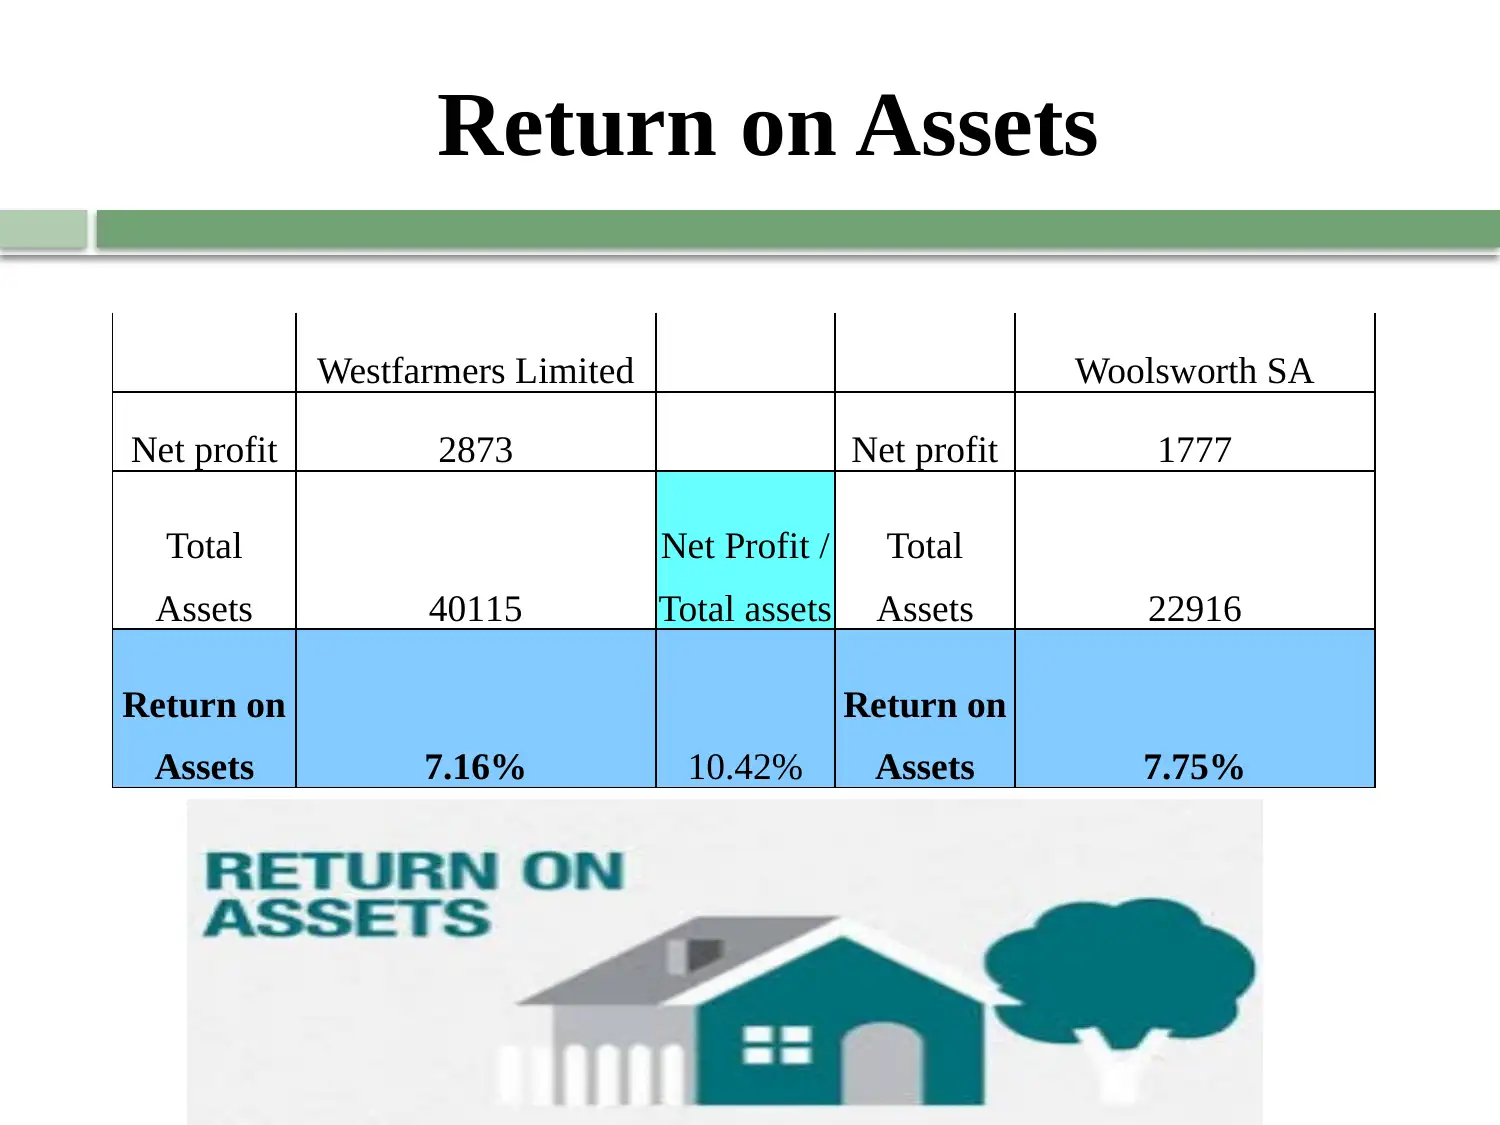
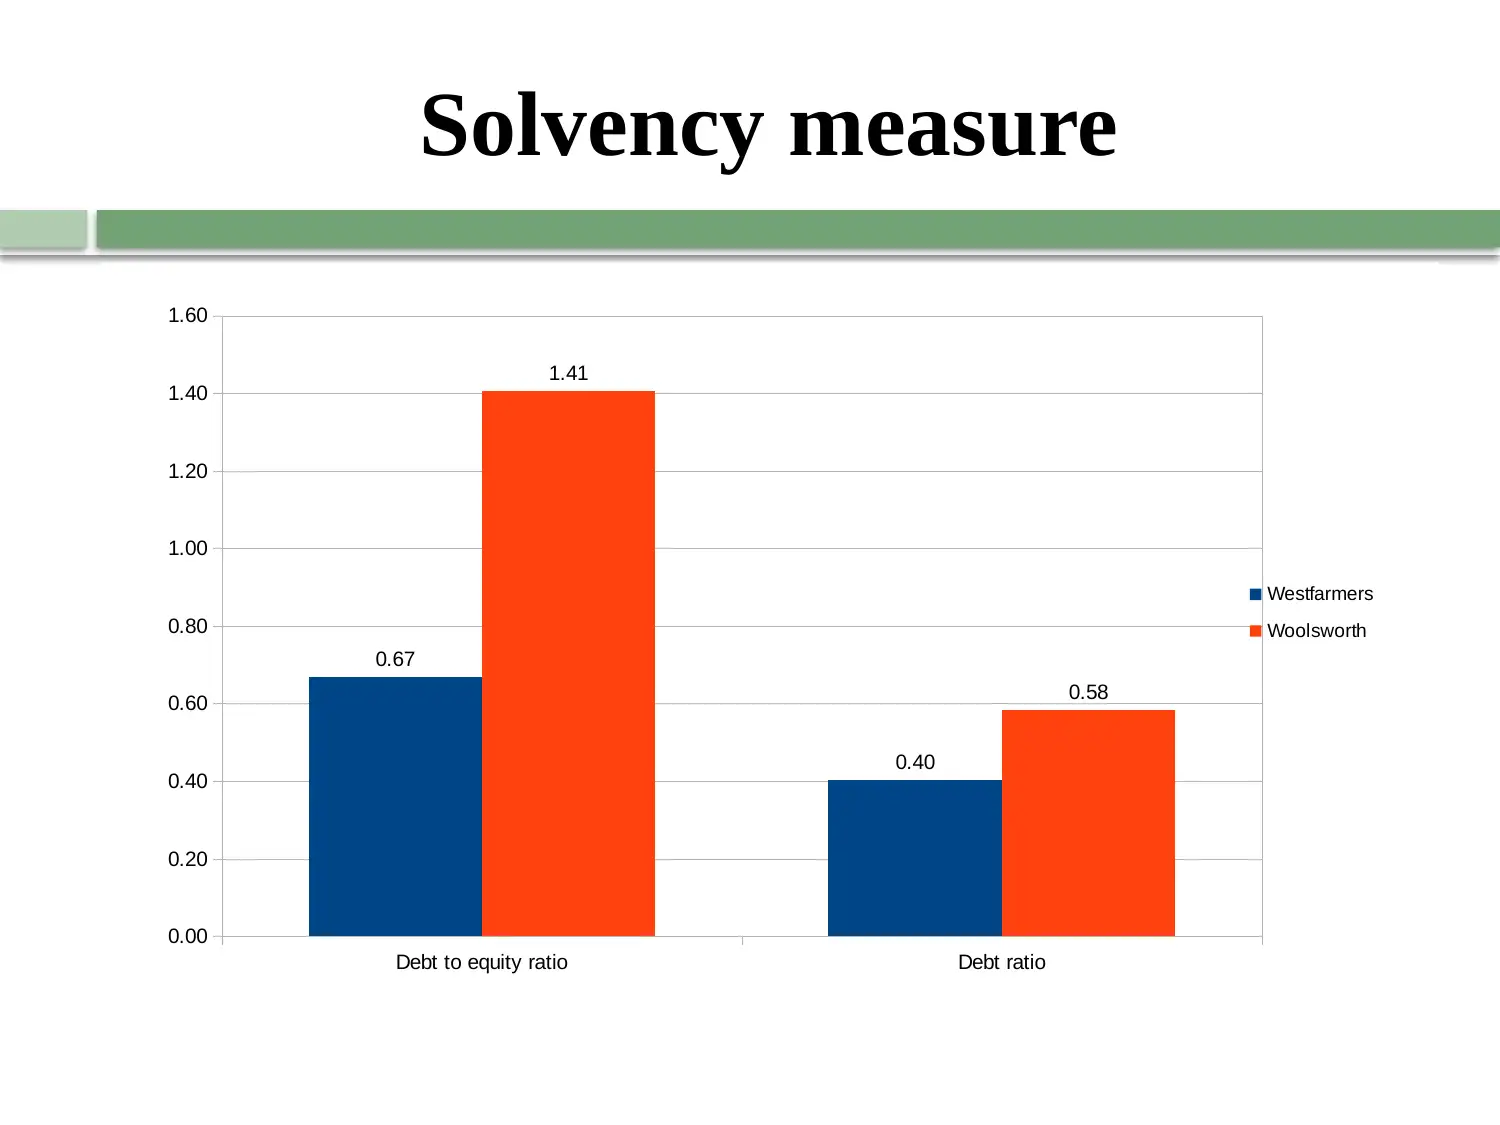
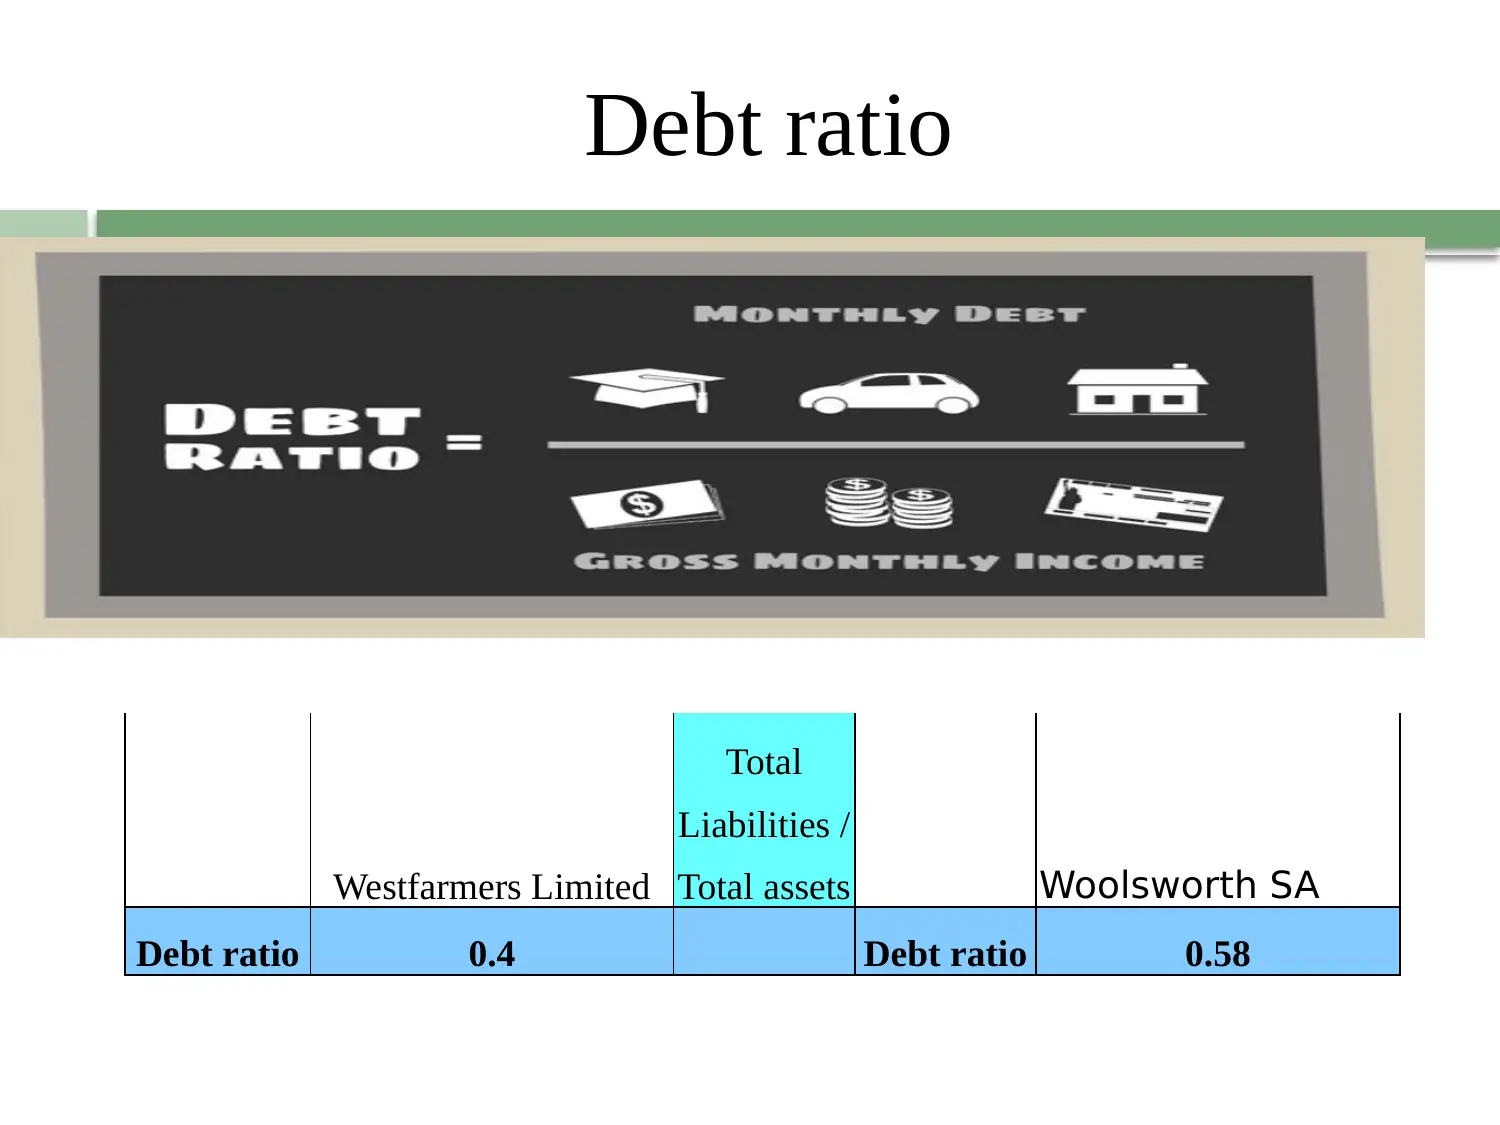
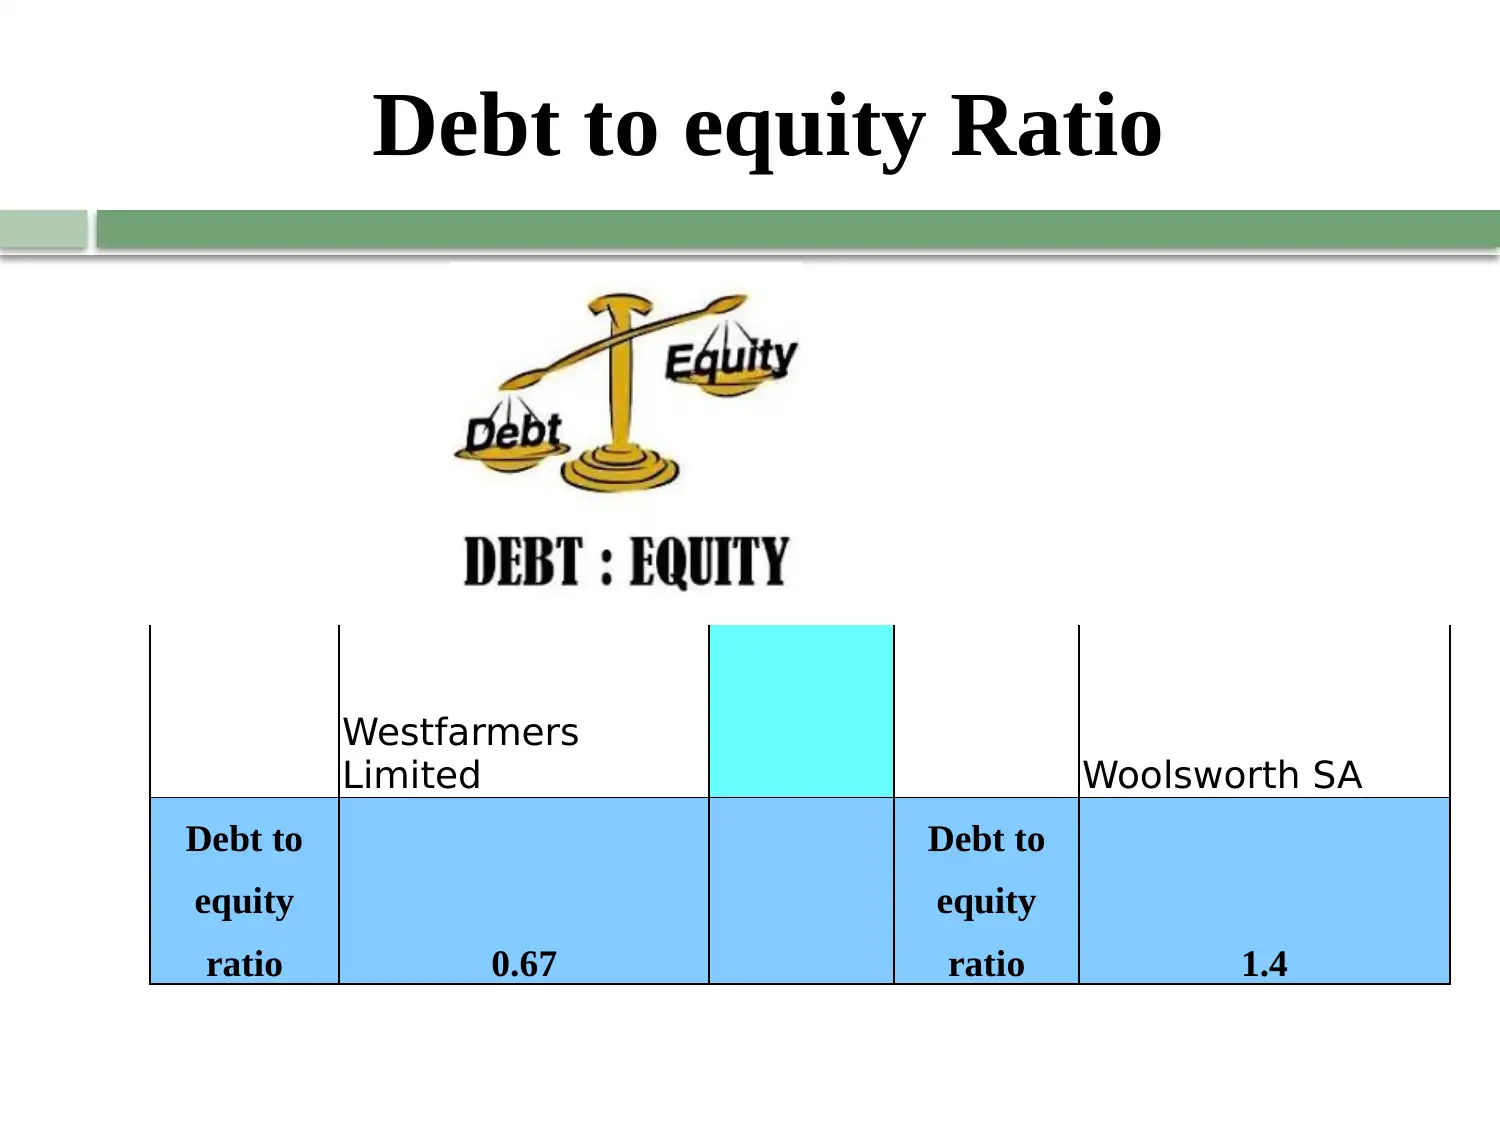
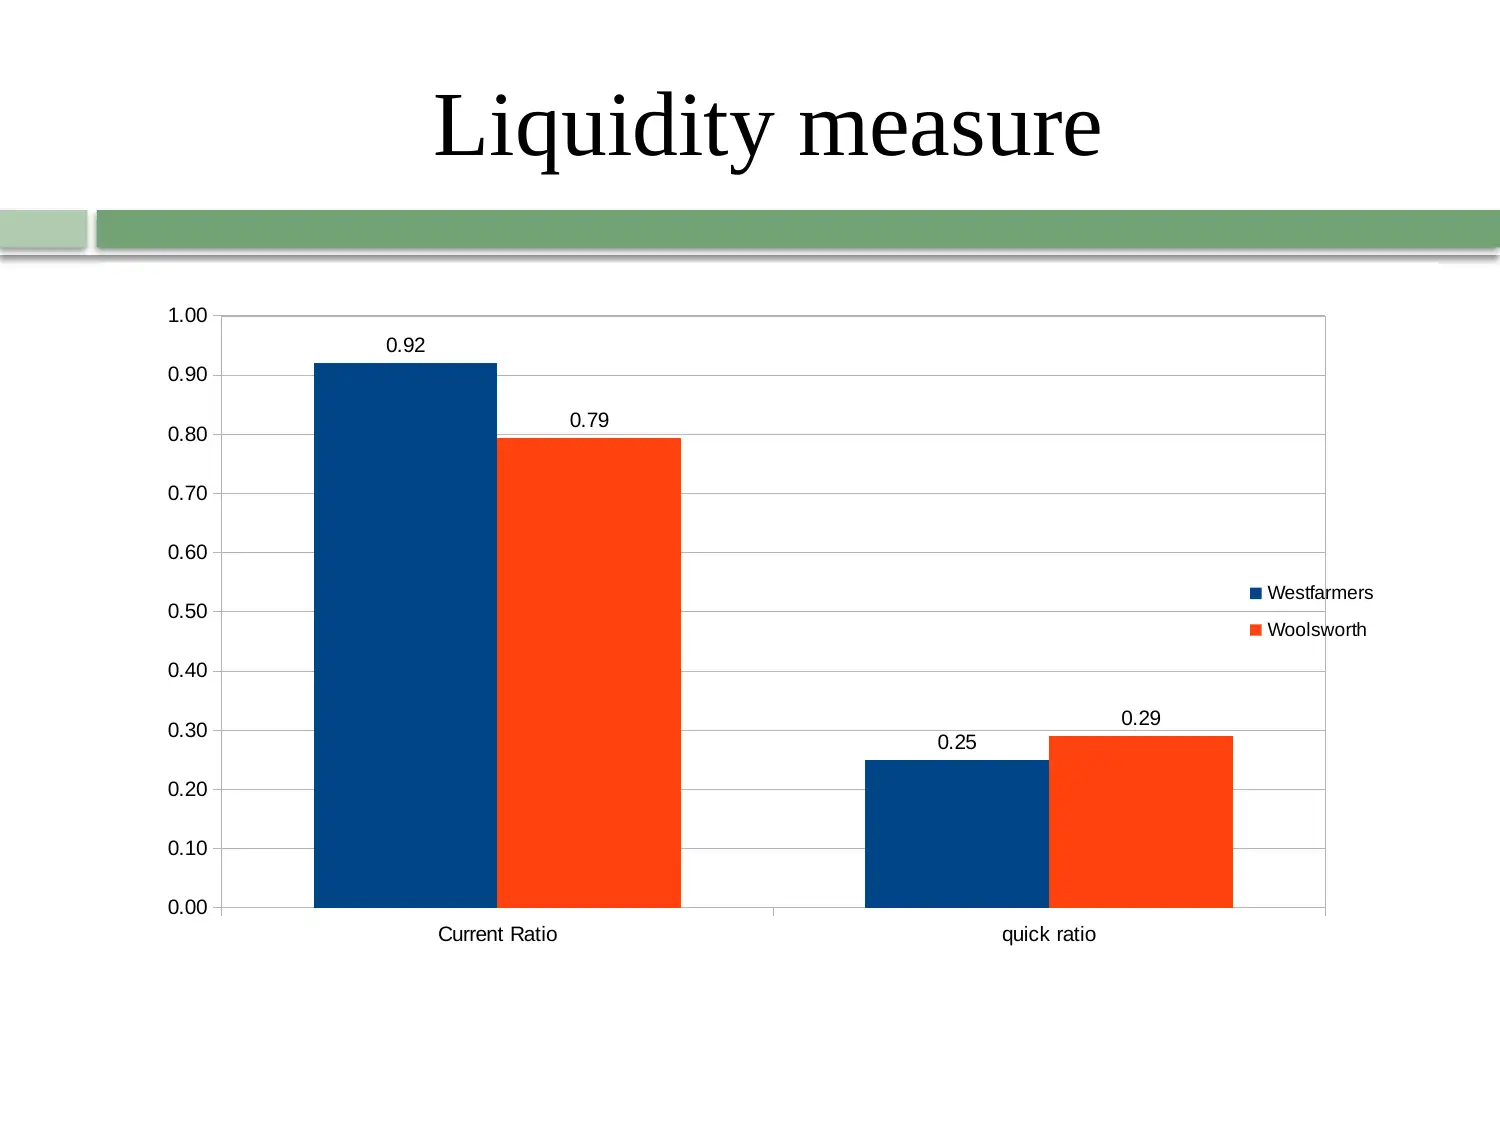
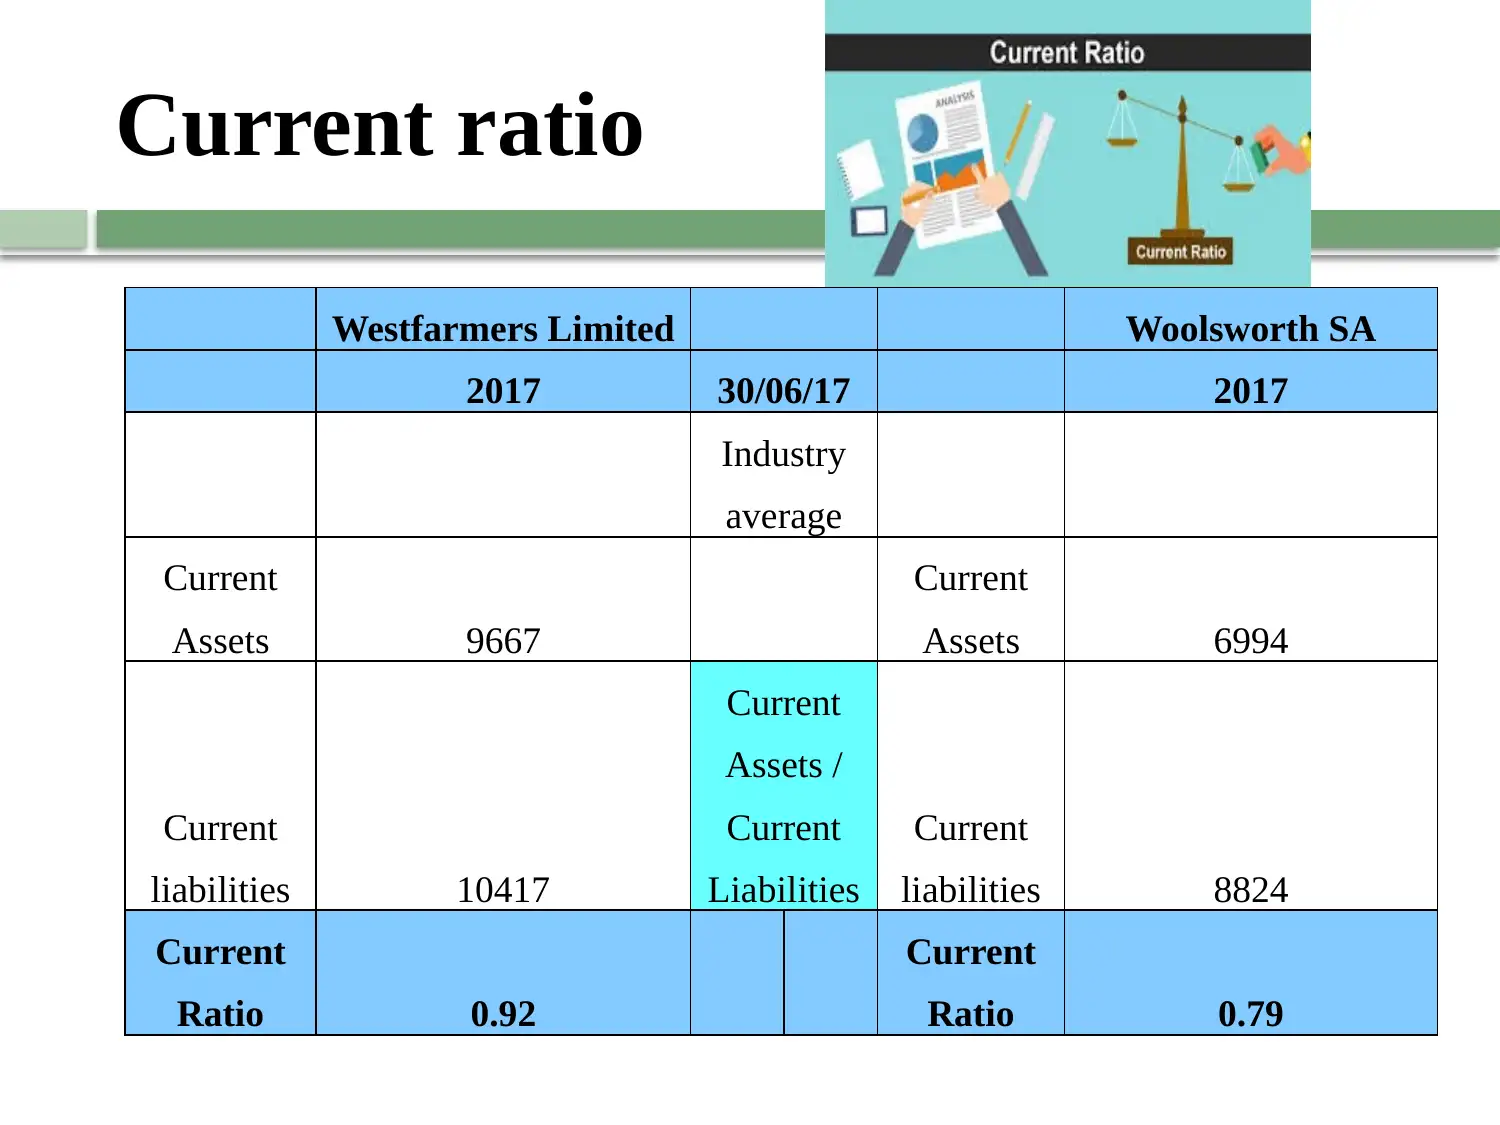
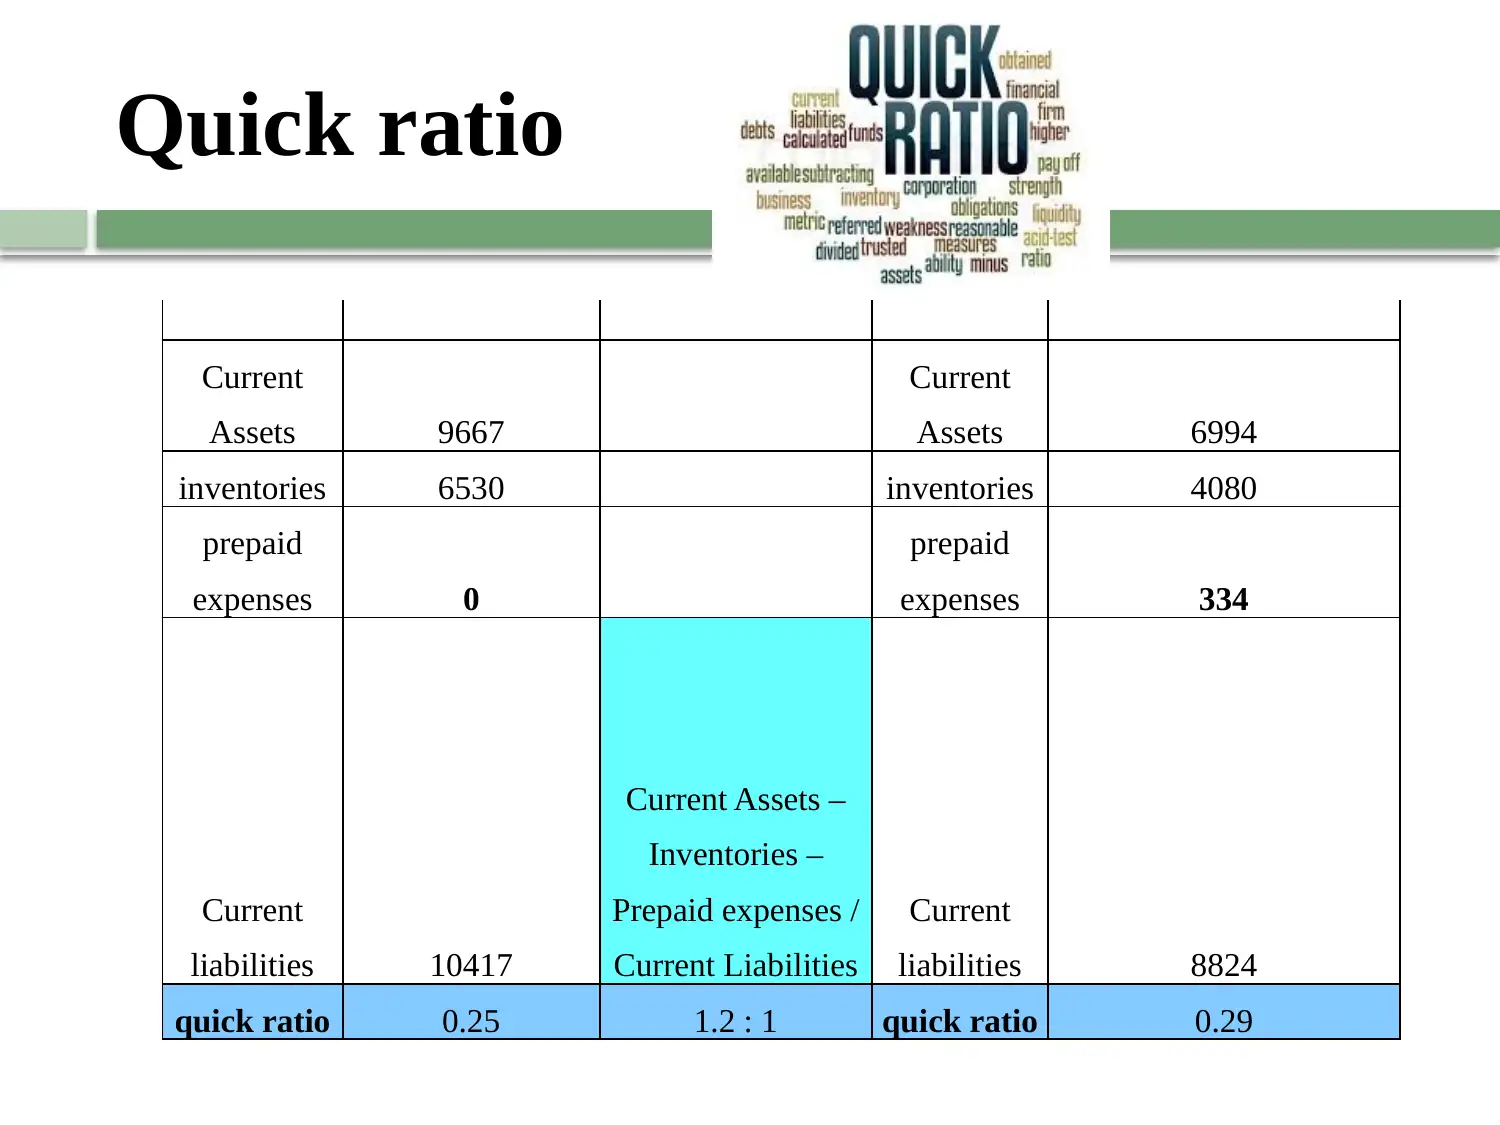
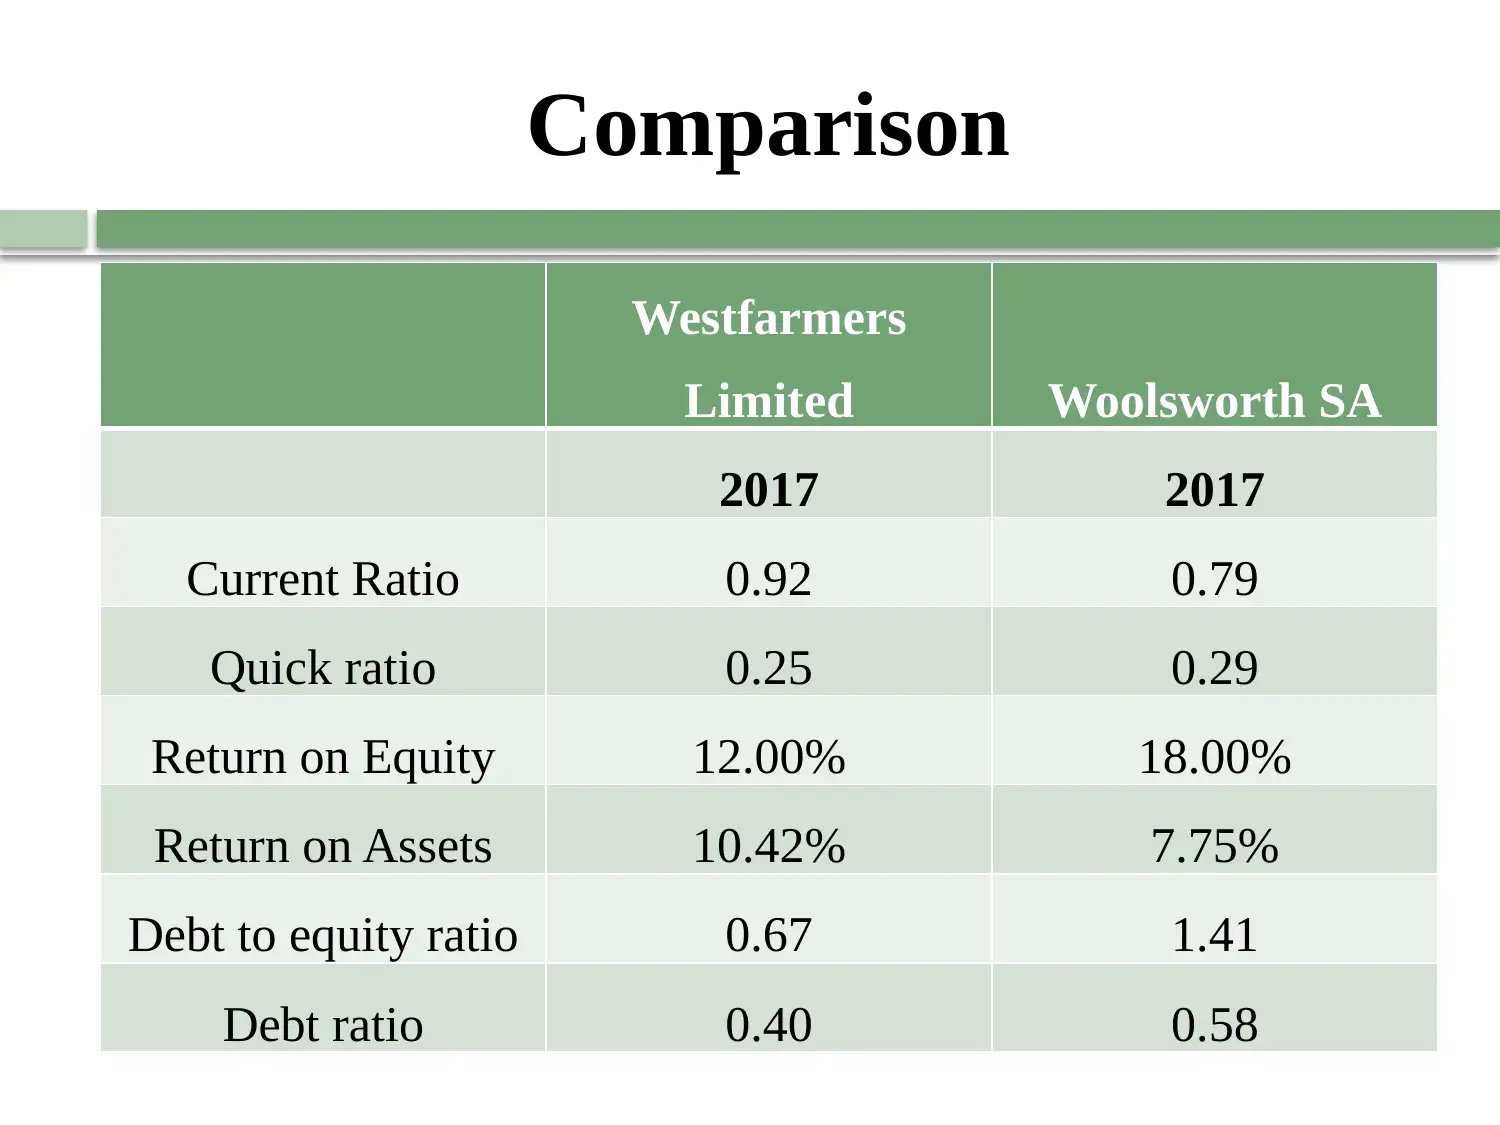
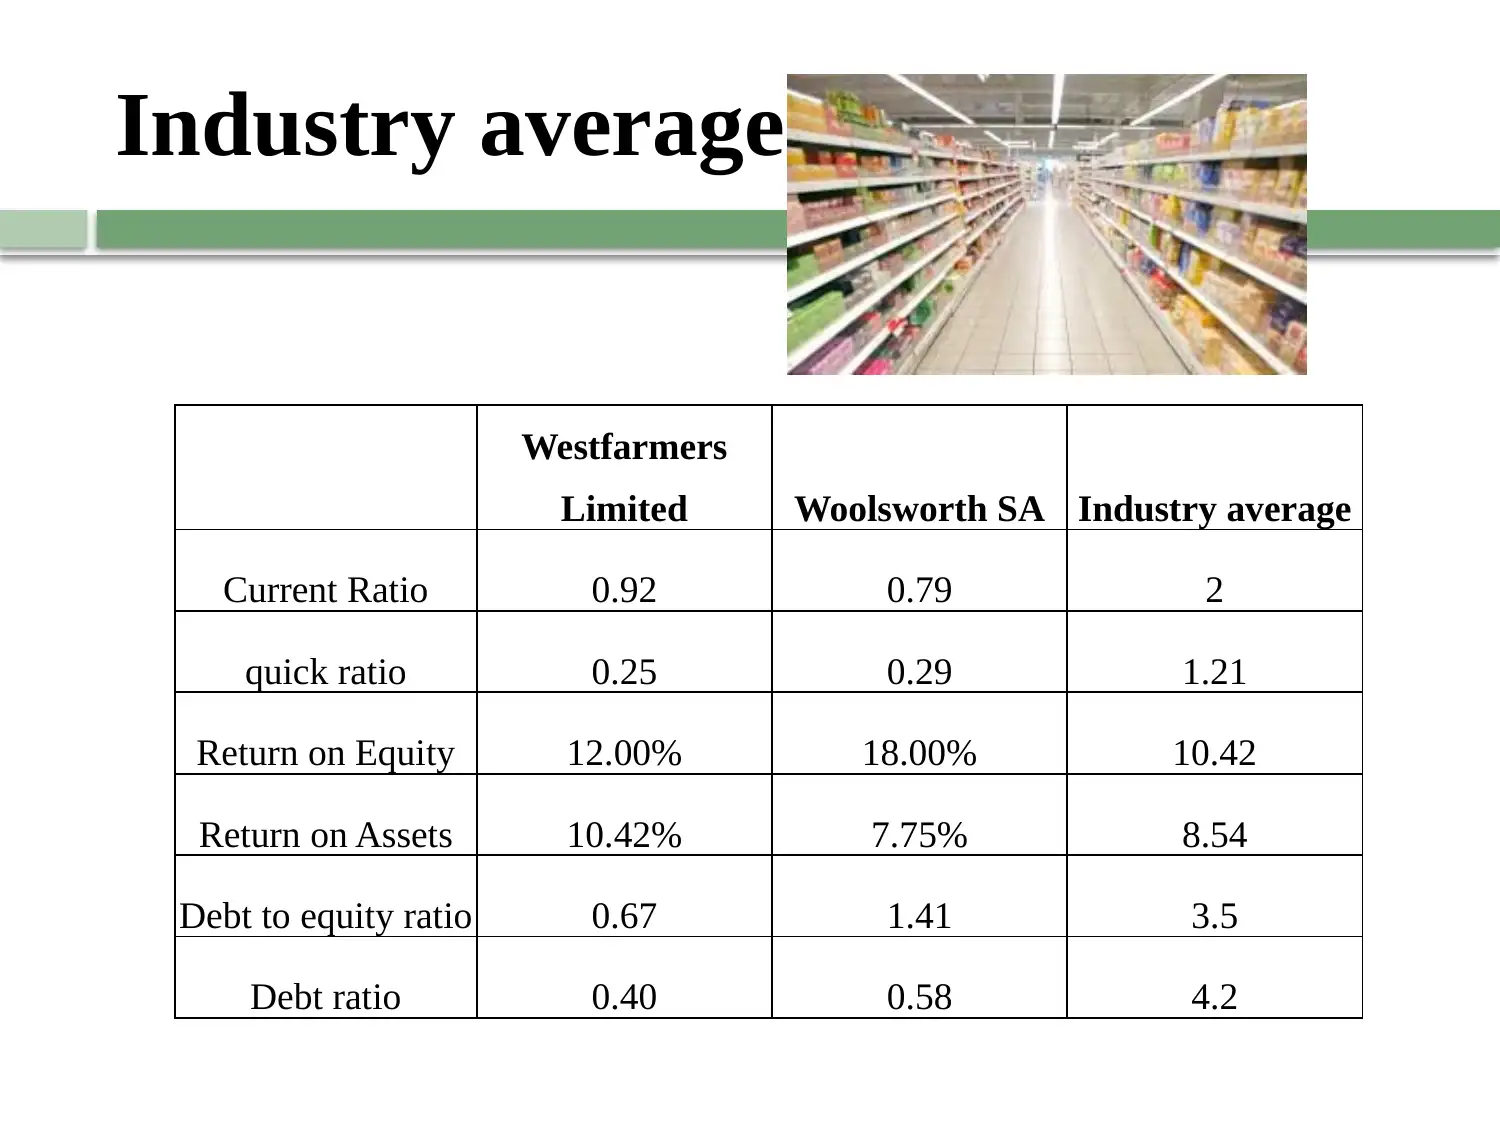
This report presents a financial ratio analysis of Woolsworth and Westfarmers, based on their 2017 annual reports, as required by the SBM3108 Financial Accounting assignment. The analysis includes the calculation and comparison of profitability ratios (Return on Equity and Return on Assets), liquidity ratios (Current Ratio and Quick Ratio), and debt ratios (Debt Ratio and Debt-to-Equity Ratio) for both companies. The report also compares these ratios against industry averages to assess the companies' relative performance. Furthermore, the report provides a comparative analysis of the two companies to determine which is a better choice for investment, considering the calculated ratios and industry benchmarks. The findings highlight each company's strengths and weaknesses, providing insights into their financial health and performance within the competitive landscape.
Document Page
FINANCIAL
ACCOUNTING
Woolsworth SA and Westfarmers
Limited
tabler-icon-diamond-filled.svg

Paraphrase This Document

Need a fresh take? Get an instant paraphrase of this document with our AI Paraphraser
Document Page
Profitability Measure
Return on Equity Return on Assets
0.00%
2.00%
4.00%
6.00%
8.00%
10.00%
12.00%
14.00%
16.00%
18.00%
20.00%
12.00%
10.42%
18.00%
7.75%
Westfarmers
Woolsworth
Document Page
Return on equity
Westfarmers Limited 30/06/17 Woolsworth SA
Profit after
tax 2873
Industry
average
Profit after
tax 1777
Shareholder
s equity 23941
Profit after
tax/
Shareholde
r equity Net worth 9526
Return on
Equity 12.00% 8.54%
Return on
Equity 18.00%
Document Page
Return on Assets
Westfarmers Limited Woolsworth SA
Net profit 2873 Net profit 1777
Total
Assets 40115
Net Profit /
Total assets
Total
Assets 22916
Return on
Assets 7.16% 10.42%
Return on
Assets 7.75%
tabler-icon-diamond-filled.svg

Paraphrase This Document

Need a fresh take? Get an instant paraphrase of this document with our AI Paraphraser
Document Page
Solvency measure
Debt to equity ratio Debt ratio
0.00
0.20
0.40
0.60
0.80
1.00
1.20
1.40
1.60
0.67
0.40
1.41
0.58
Westfarmers
Woolsworth
Document Page
Debt ratio
Westfarmers Limited
Total
Liabilities /
Total assets Woolsworth SA
Debt ratio 0.4 Debt ratio 0.58
Document Page
Debt to equity Ratio
Westfarmers
Limited Woolsworth SA
Debt to
equity
ratio 0.67
Debt to
equity
ratio 1.4
tabler-icon-diamond-filled.svg

Paraphrase This Document

Need a fresh take? Get an instant paraphrase of this document with our AI Paraphraser
Document Page
Liquidity measure
Current Ratio quick ratio
0.00
0.10
0.20
0.30
0.40
0.50
0.60
0.70
0.80
0.90
1.00
0.92
0.25
0.79
0.29
Westfarmers
Woolsworth
Document Page
Current ratio
Westfarmers Limited Woolsworth SA
2017 30/06/17 2017
Industry
average
Current
Assets 9667
Current
Assets 6994
Current
liabilities 10417
Current
Assets /
Current
Liabilities
Current
liabilities 8824
Current
Ratio 0.92
Current
Ratio 0.79
Document Page
Quick ratio
Current
Assets 9667
Current
Assets 6994
inventories 6530 inventories 4080
prepaid
expenses 0
prepaid
expenses 334
Current
liabilities 10417
Current Assets –
Inventories –
Prepaid expenses /
Current Liabilities
Current
liabilities 8824
quick ratio 0.25 1.2 : 1 quick ratio 0.29
tabler-icon-diamond-filled.svg

Paraphrase This Document

Need a fresh take? Get an instant paraphrase of this document with our AI Paraphraser
Document Page
Comparison
Westfarmers
Limited Woolsworth SA
2017 2017
Current Ratio 0.92 0.79
Quick ratio 0.25 0.29
Return on Equity 12.00% 18.00%
Return on Assets 10.42% 7.75%
Debt to equity ratio 0.67 1.41
Debt ratio 0.40 0.58
Document Page
Industry average
Westfarmers
Limited Woolsworth SA Industry average
Current Ratio 0.92 0.79 2
quick ratio 0.25 0.29 1.21
Return on Equity 12.00% 18.00% 10.42
Return on Assets 10.42% 7.75% 8.54
Debt to equity ratio 0.67 1.41 3.5
Debt ratio 0.40 0.58 4.2
chevron_up_icon
1 out of 13
circle_padding
hide_on_mobile
zoom_out_icon