A Comparative Financial Analysis of Tesco and Sainsbury's Performance
VerifiedAdded on 2023/01/06
|22
|4069
|1
Report
AI Summary
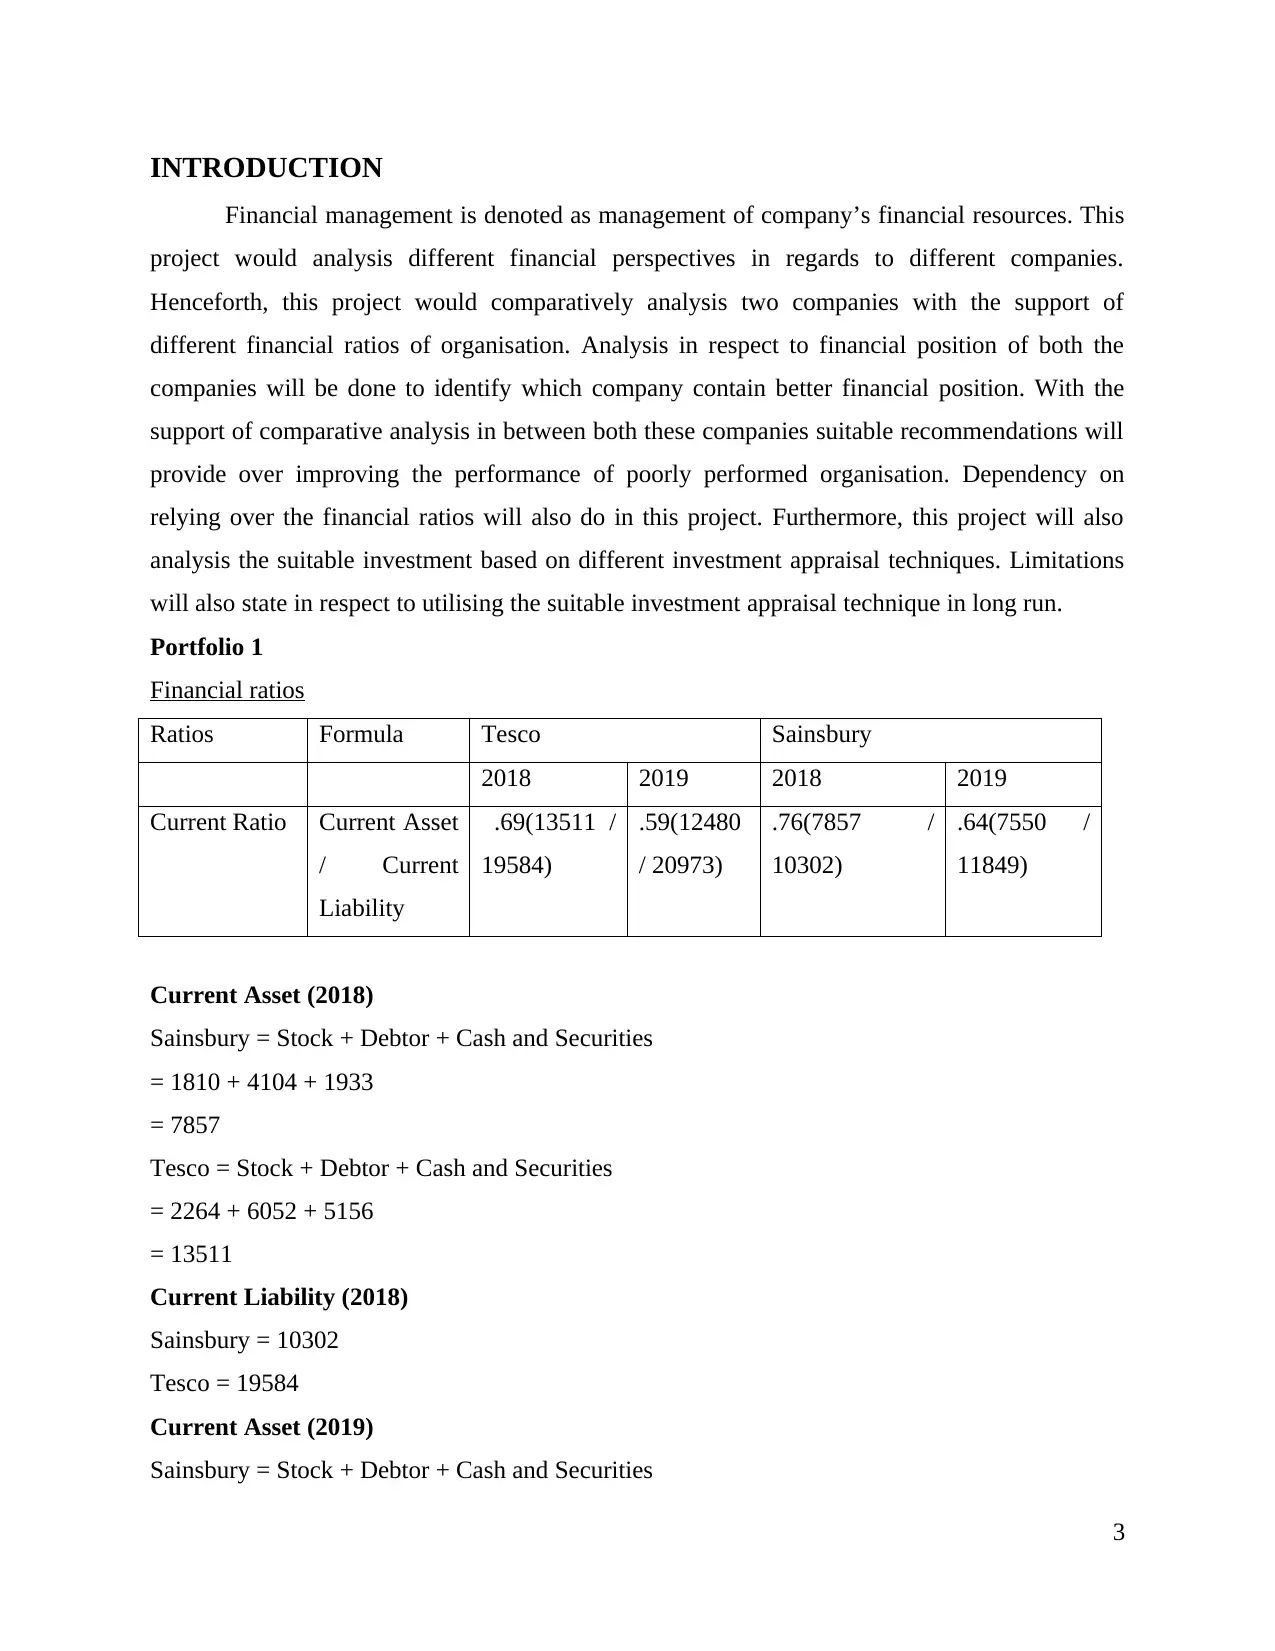
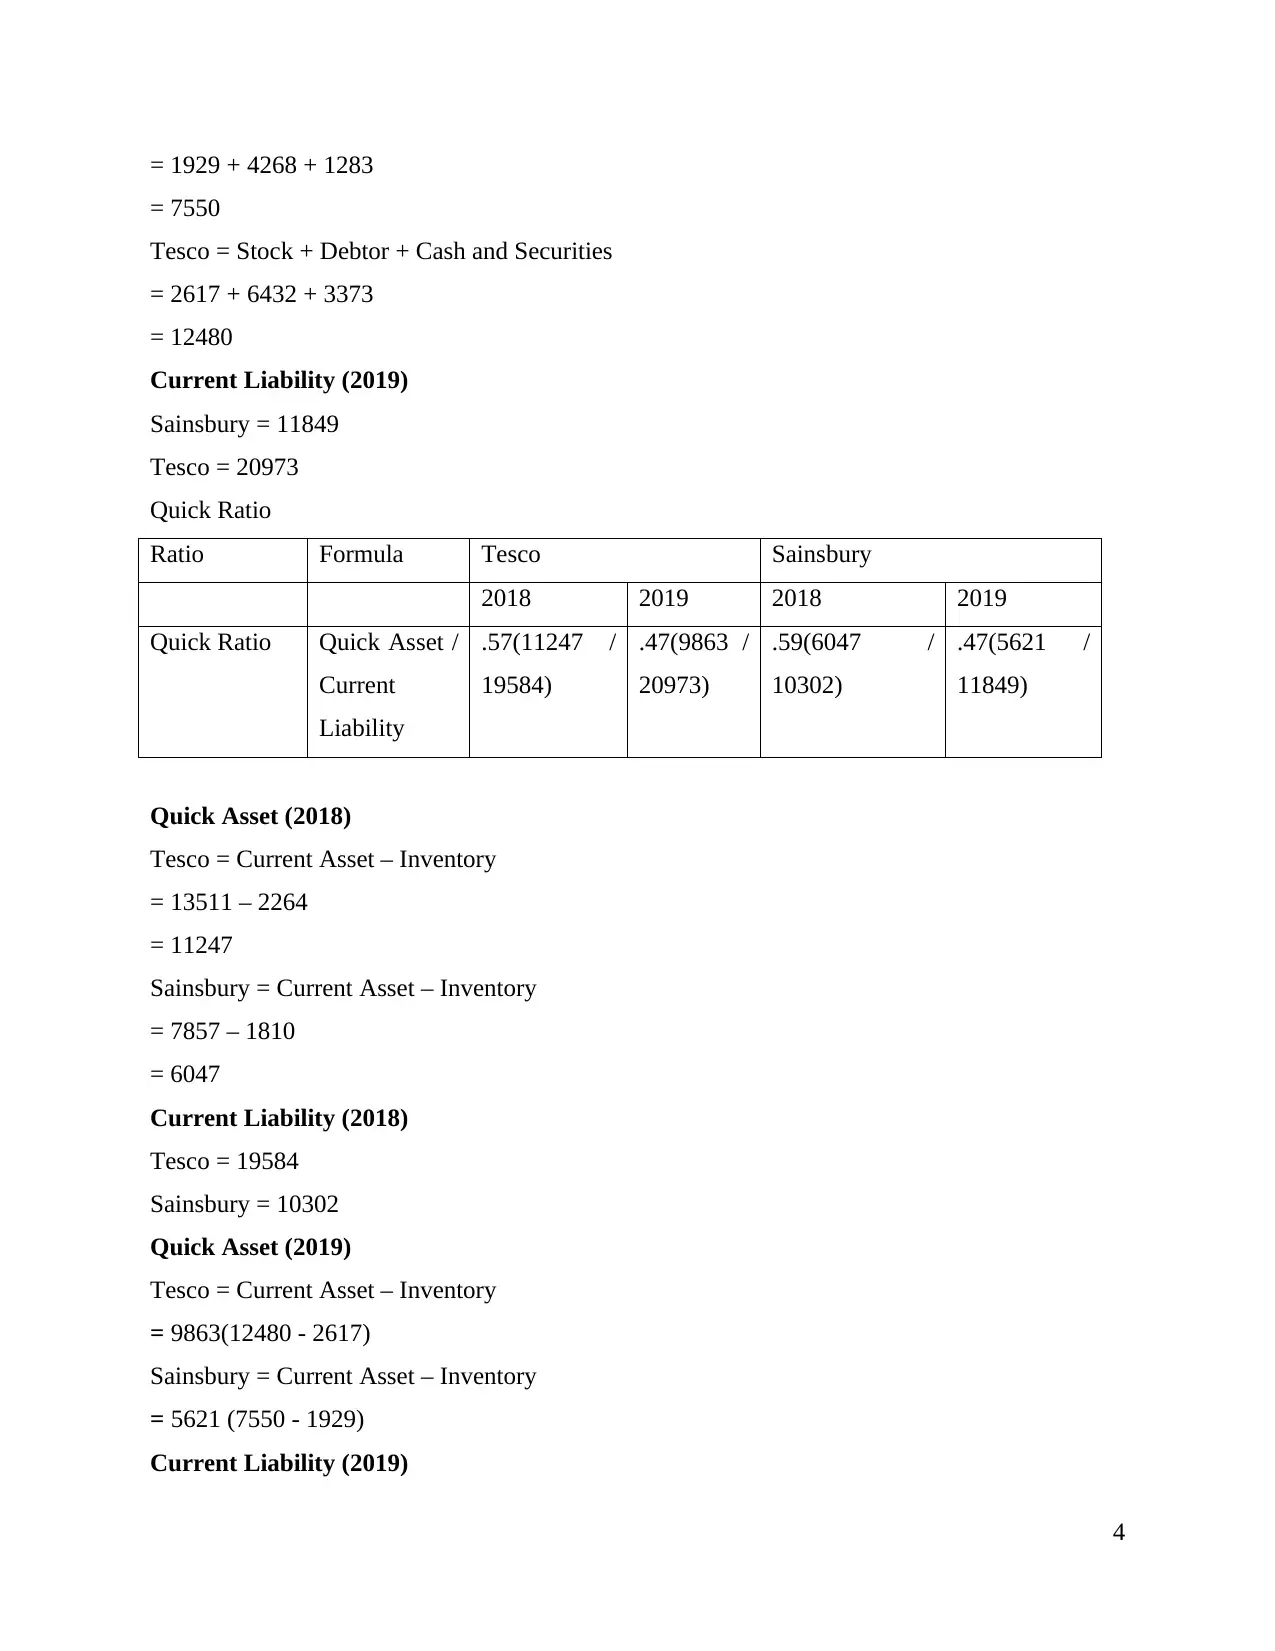
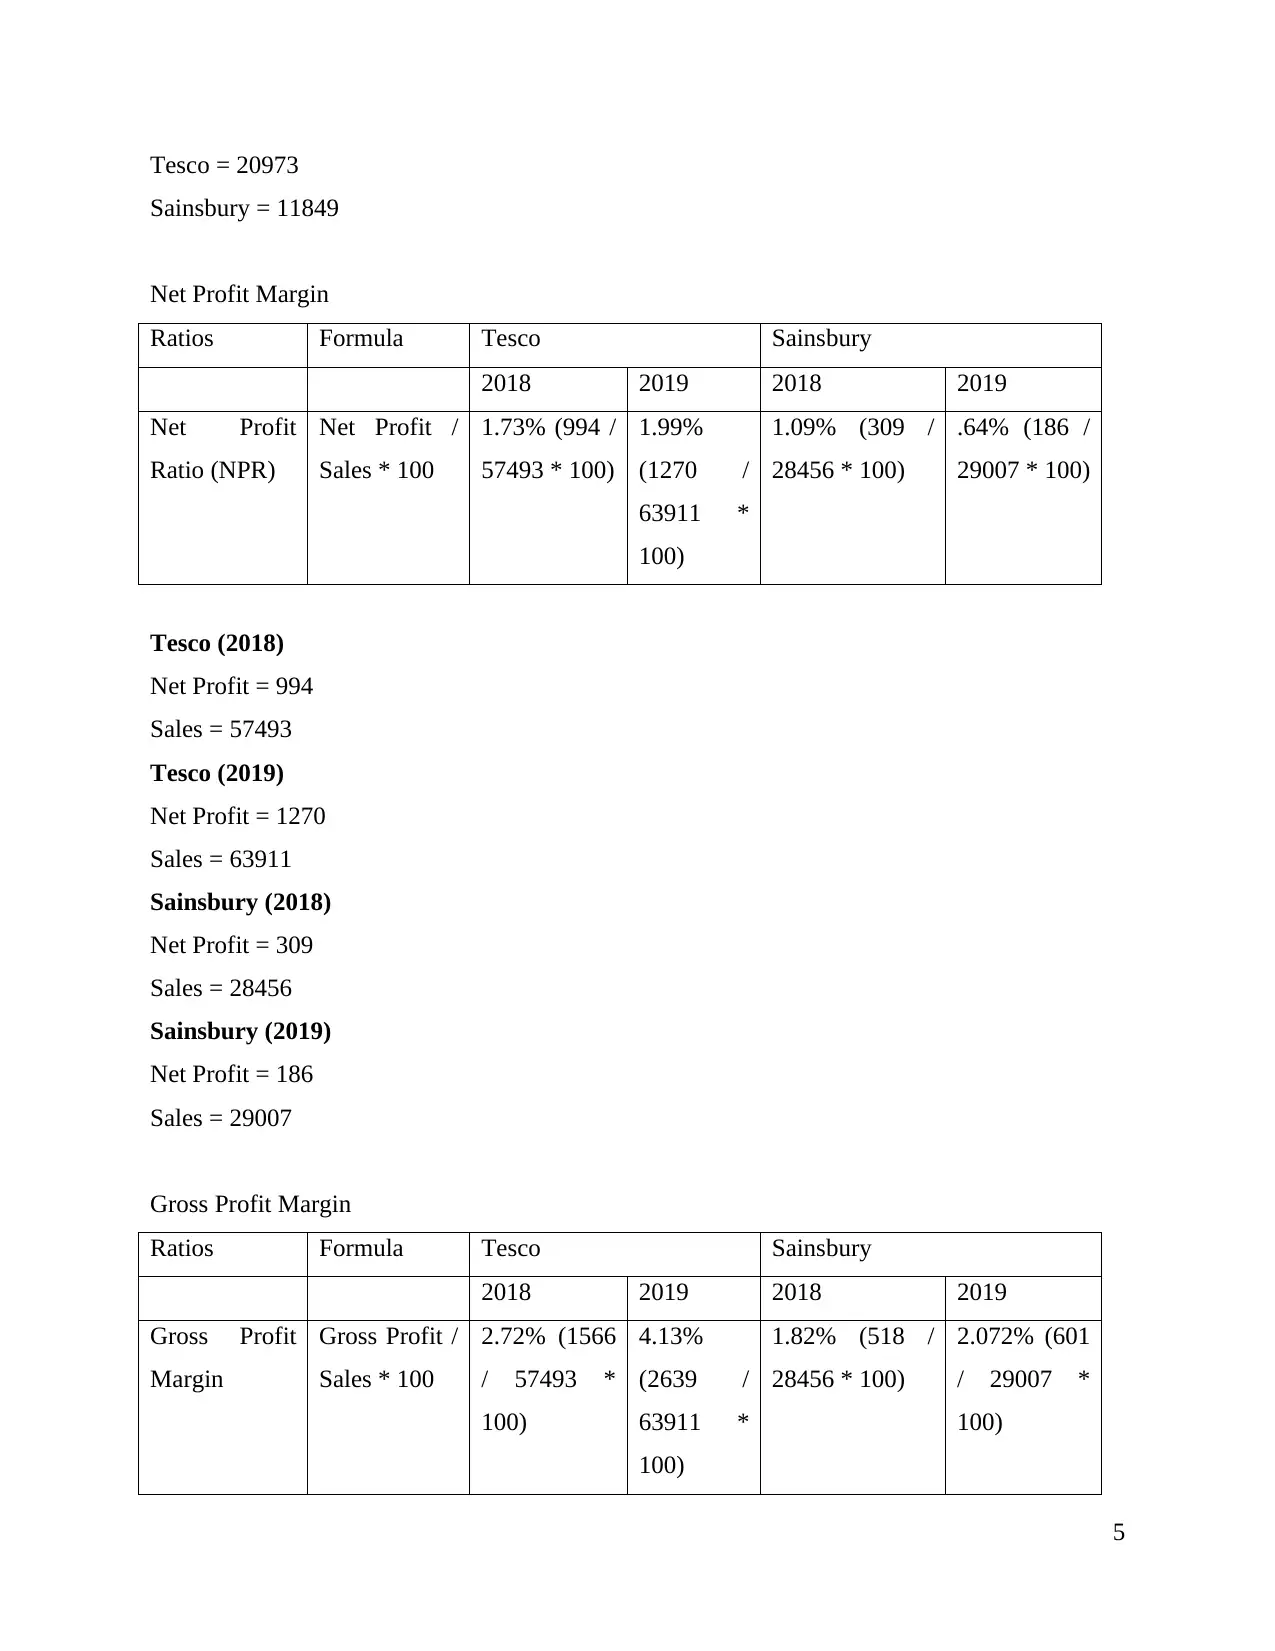
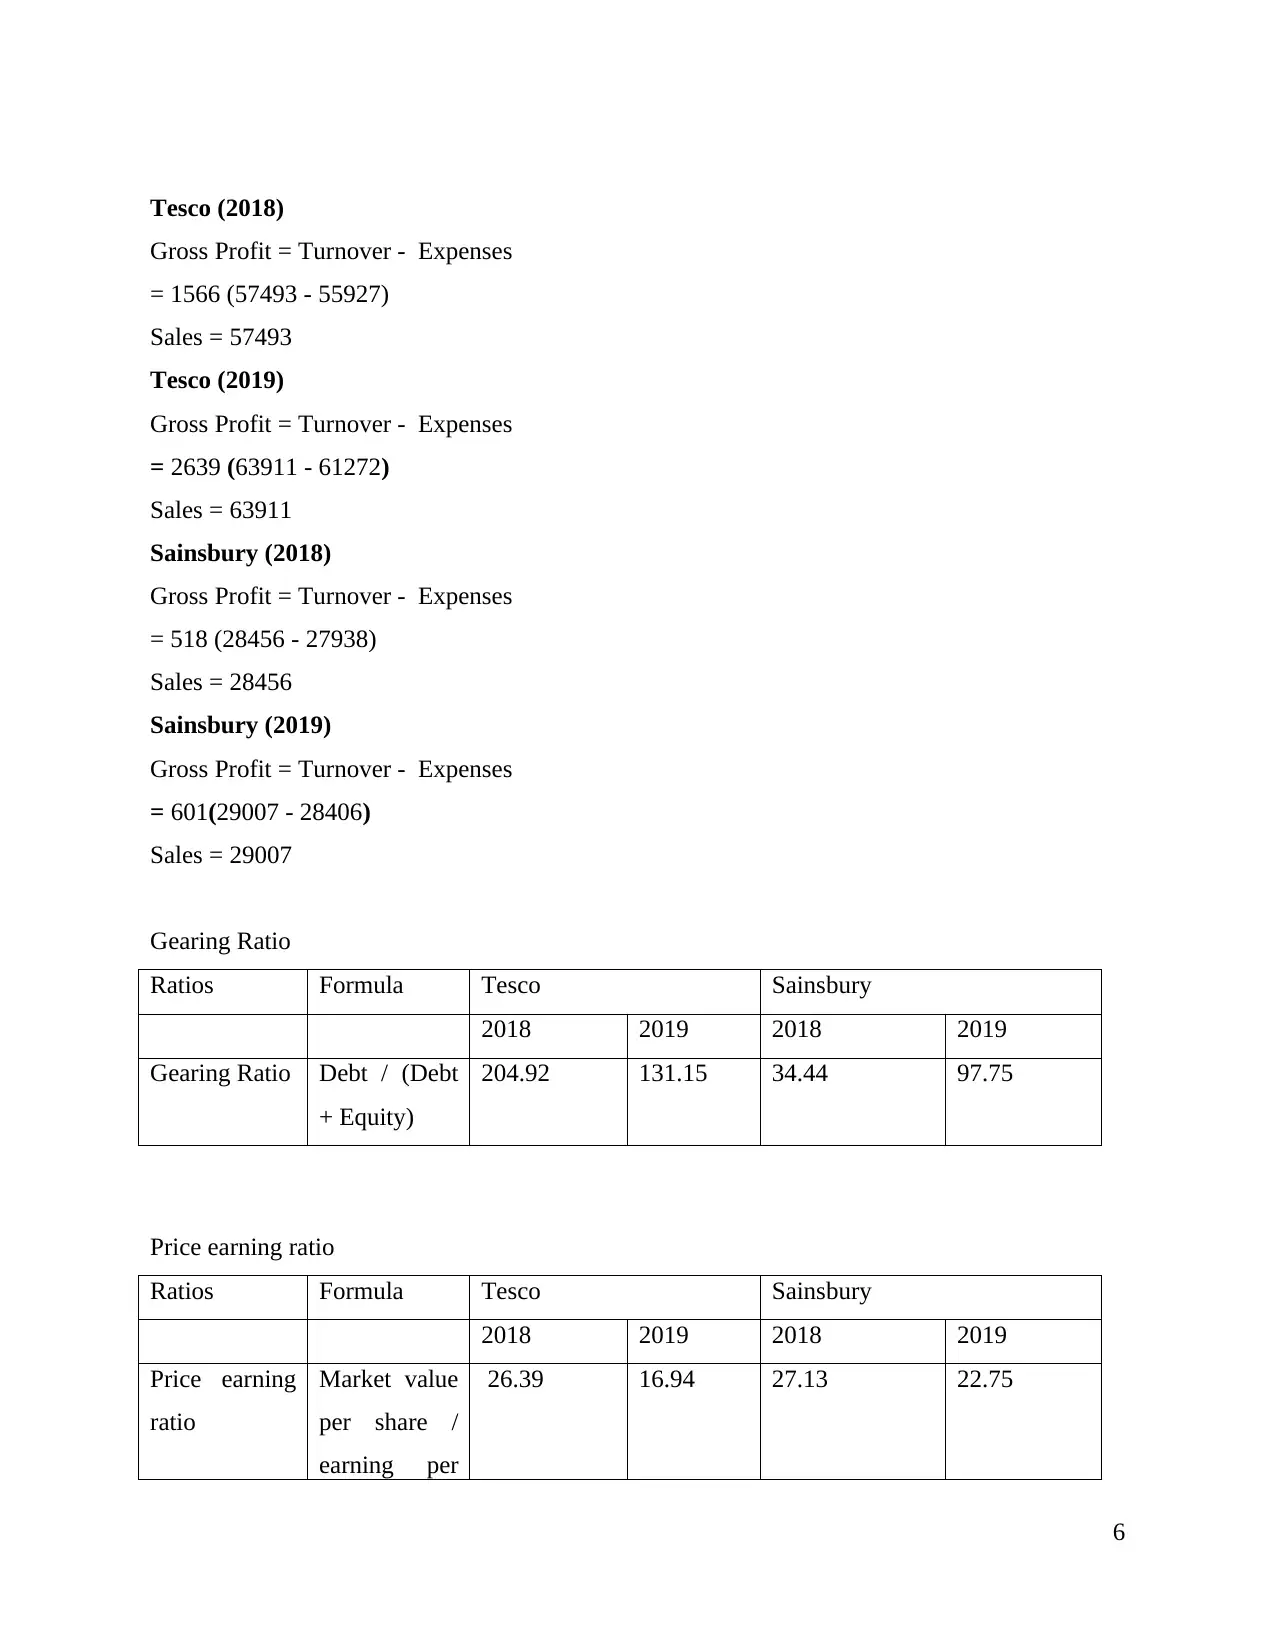
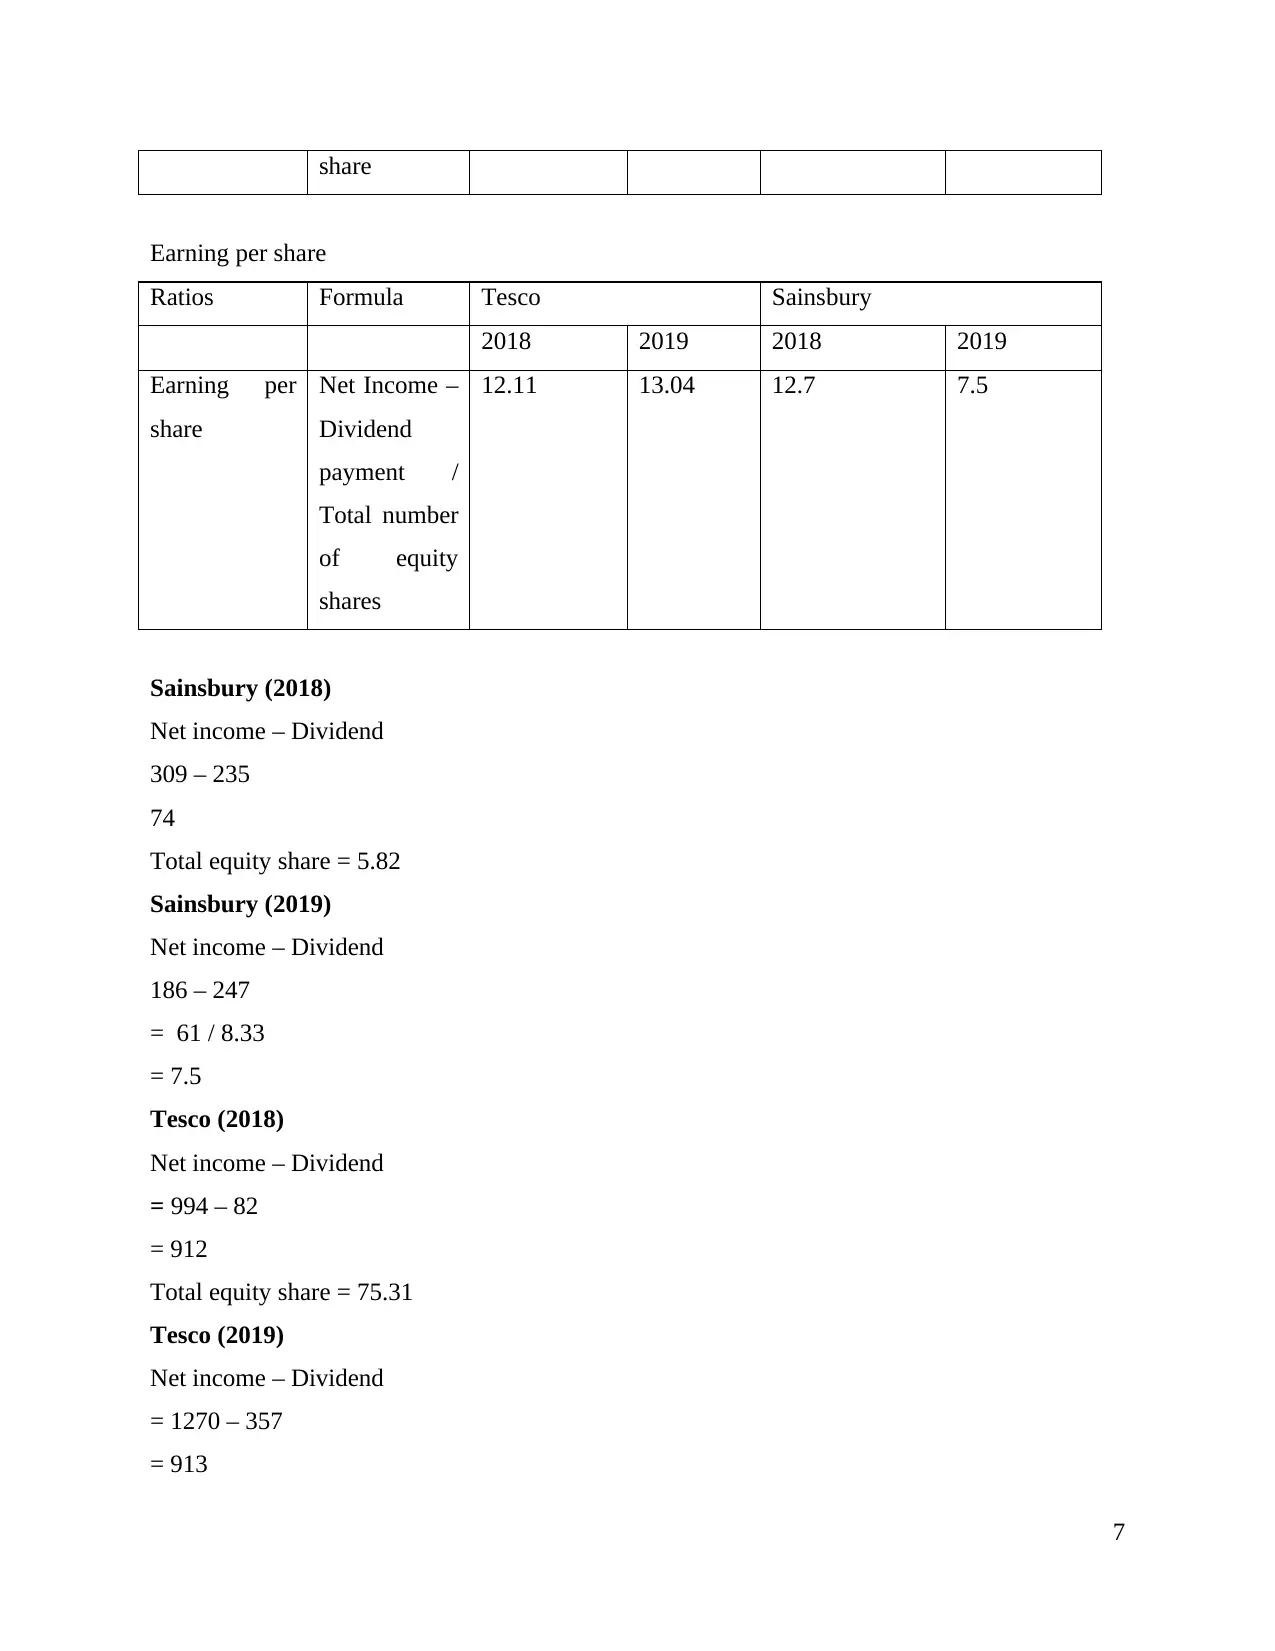
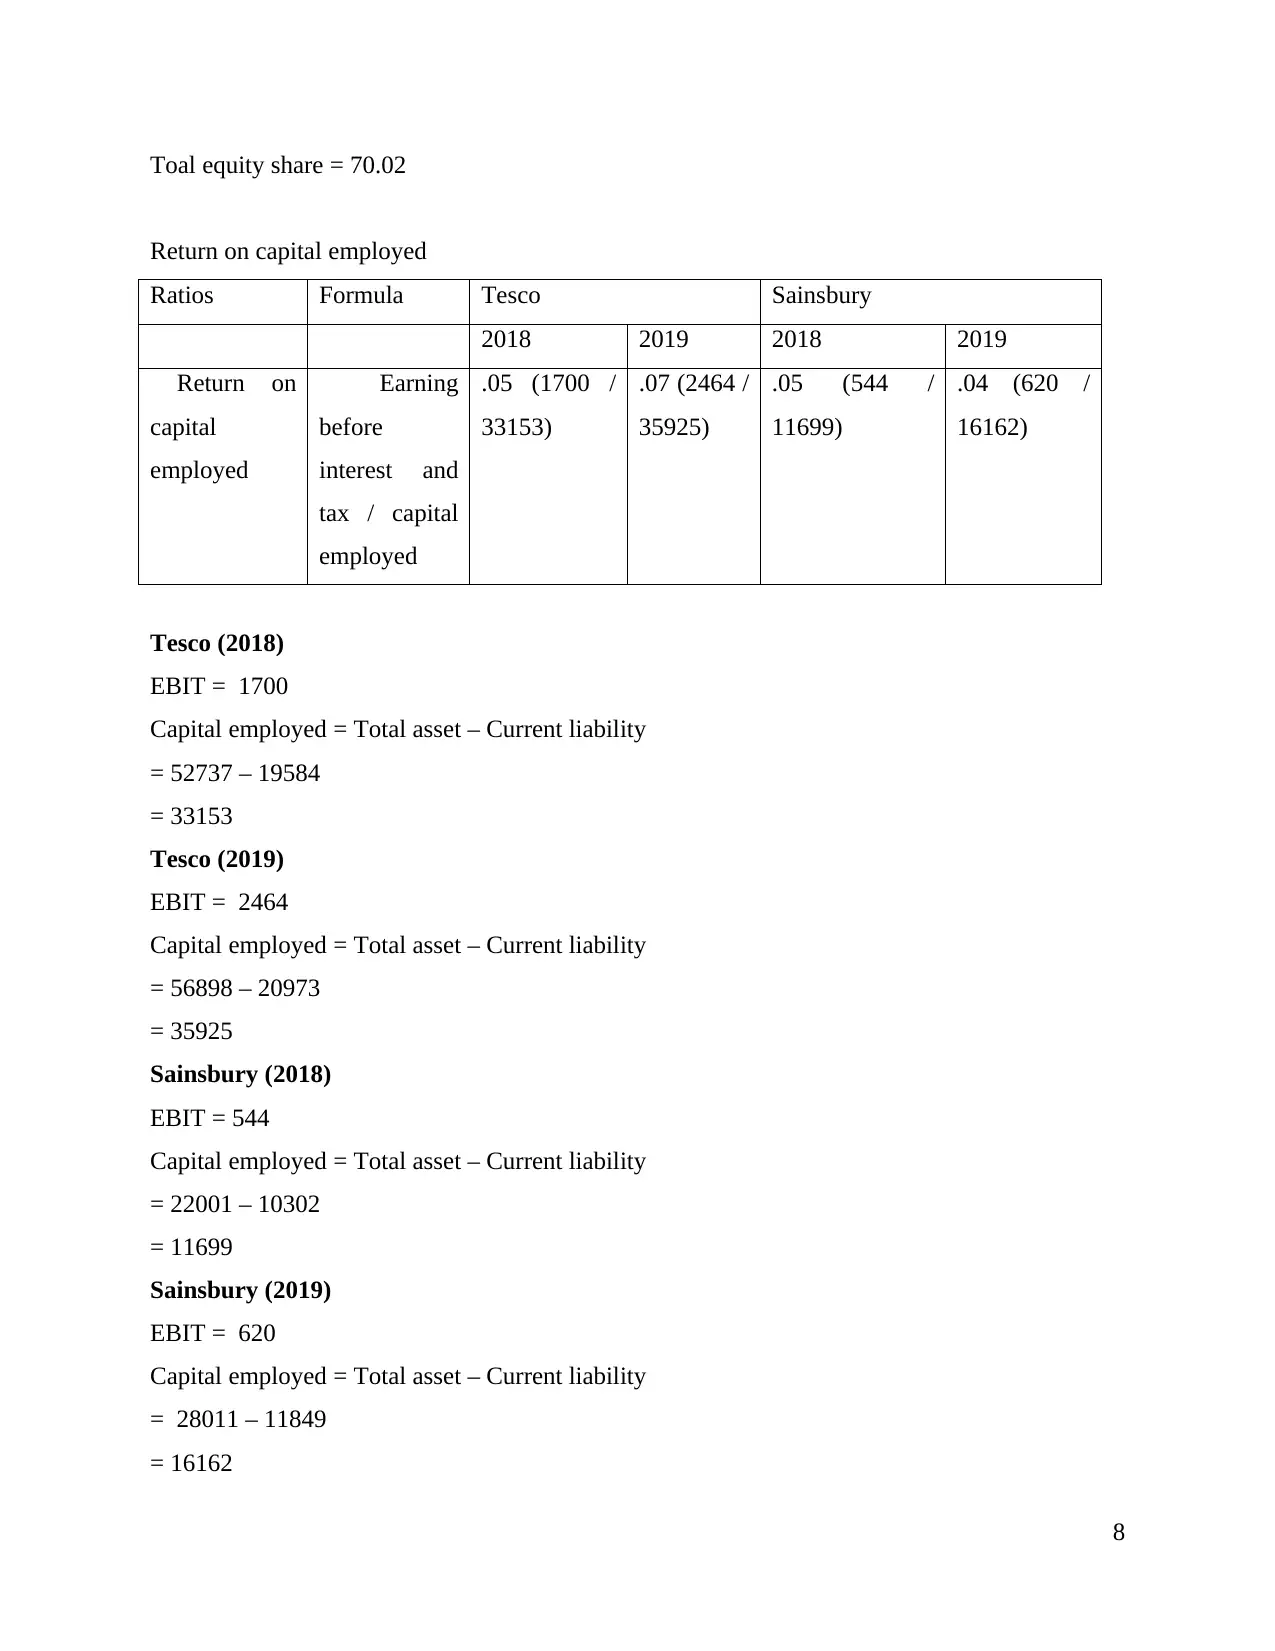
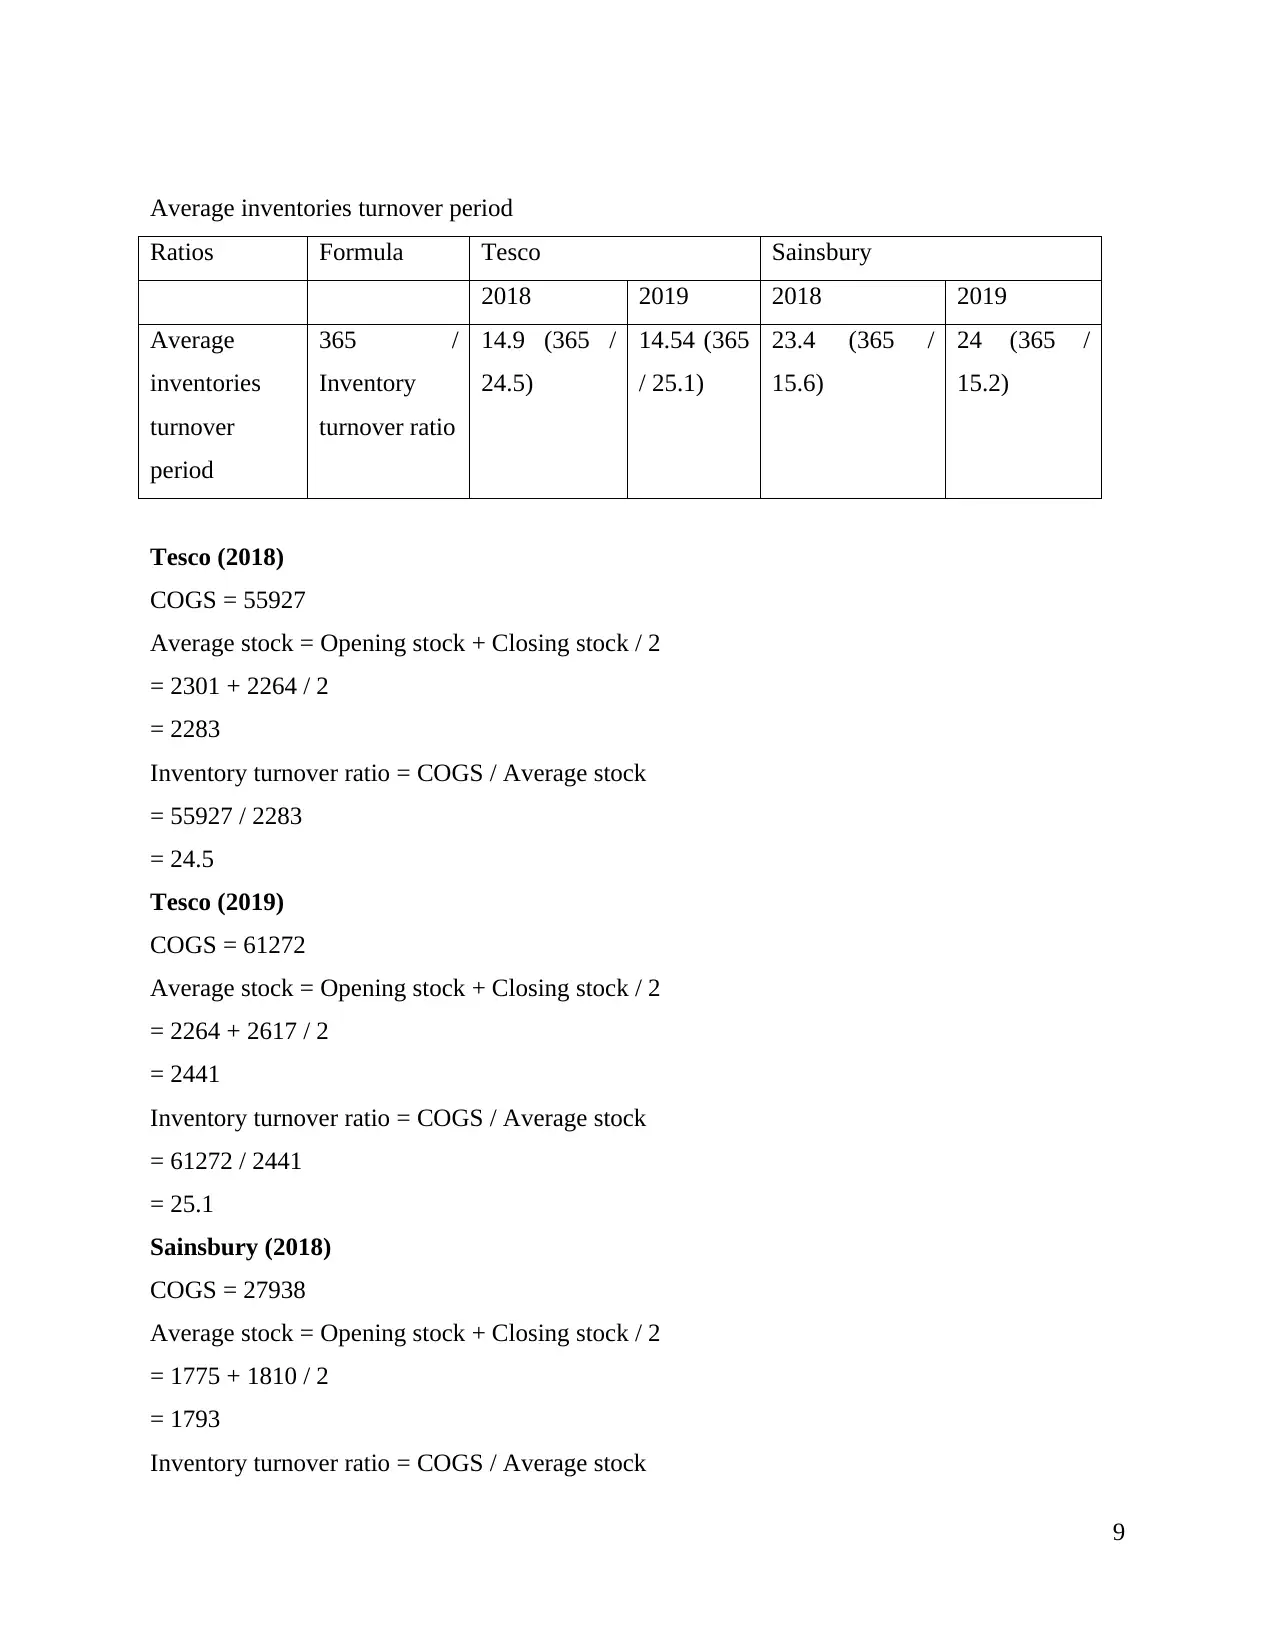
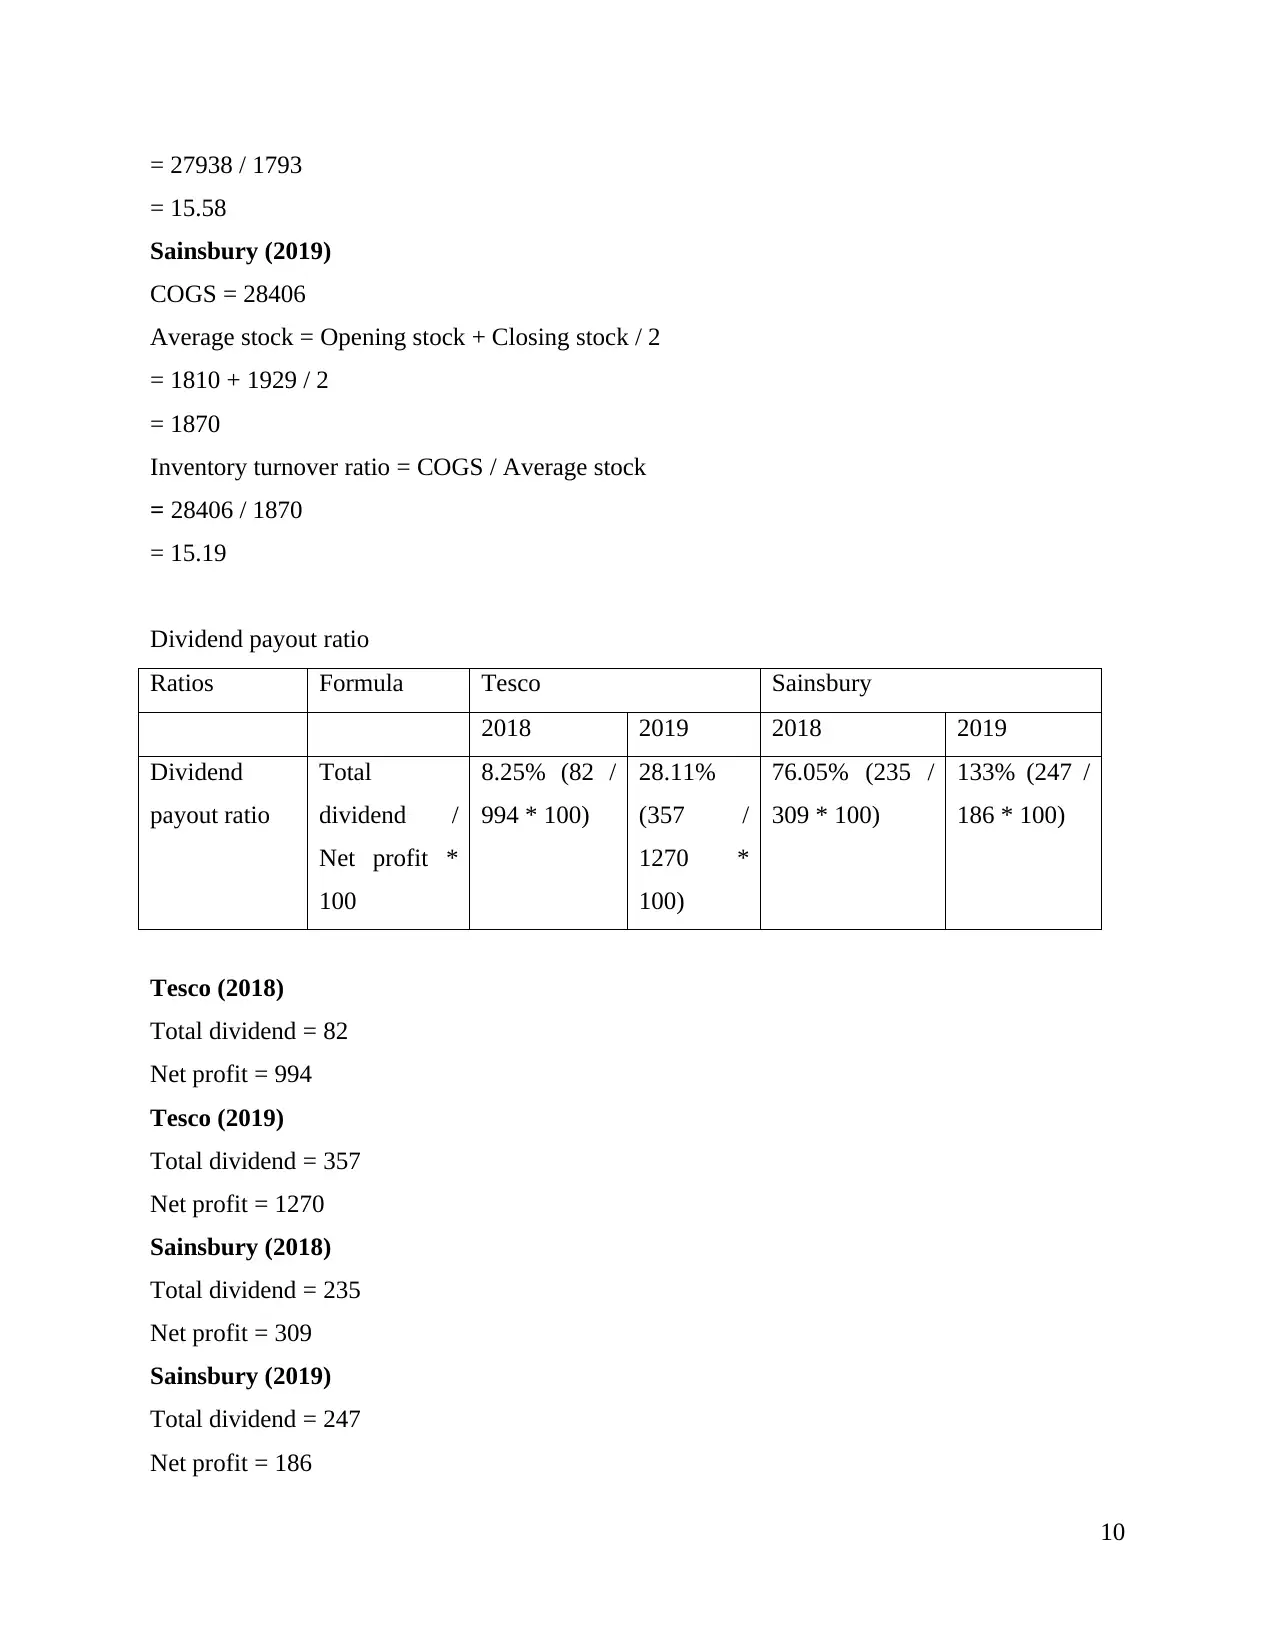
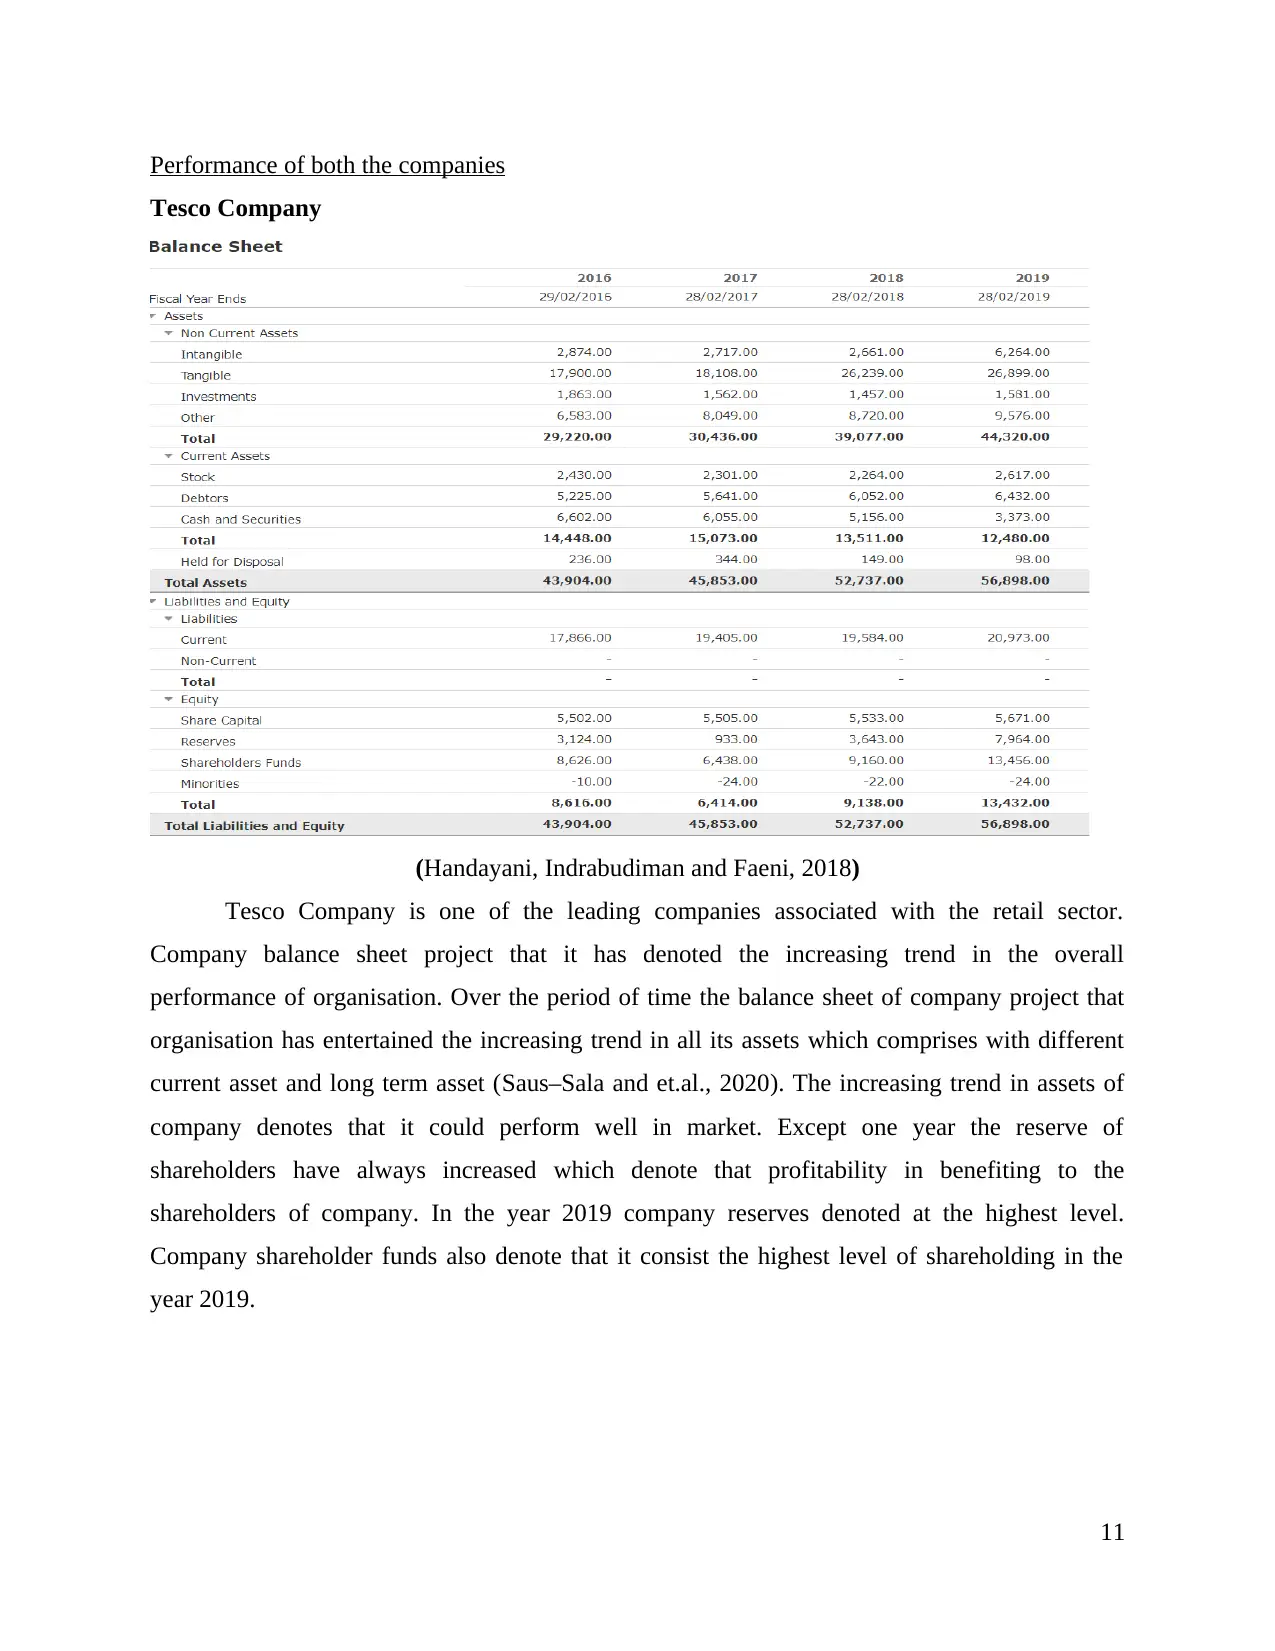
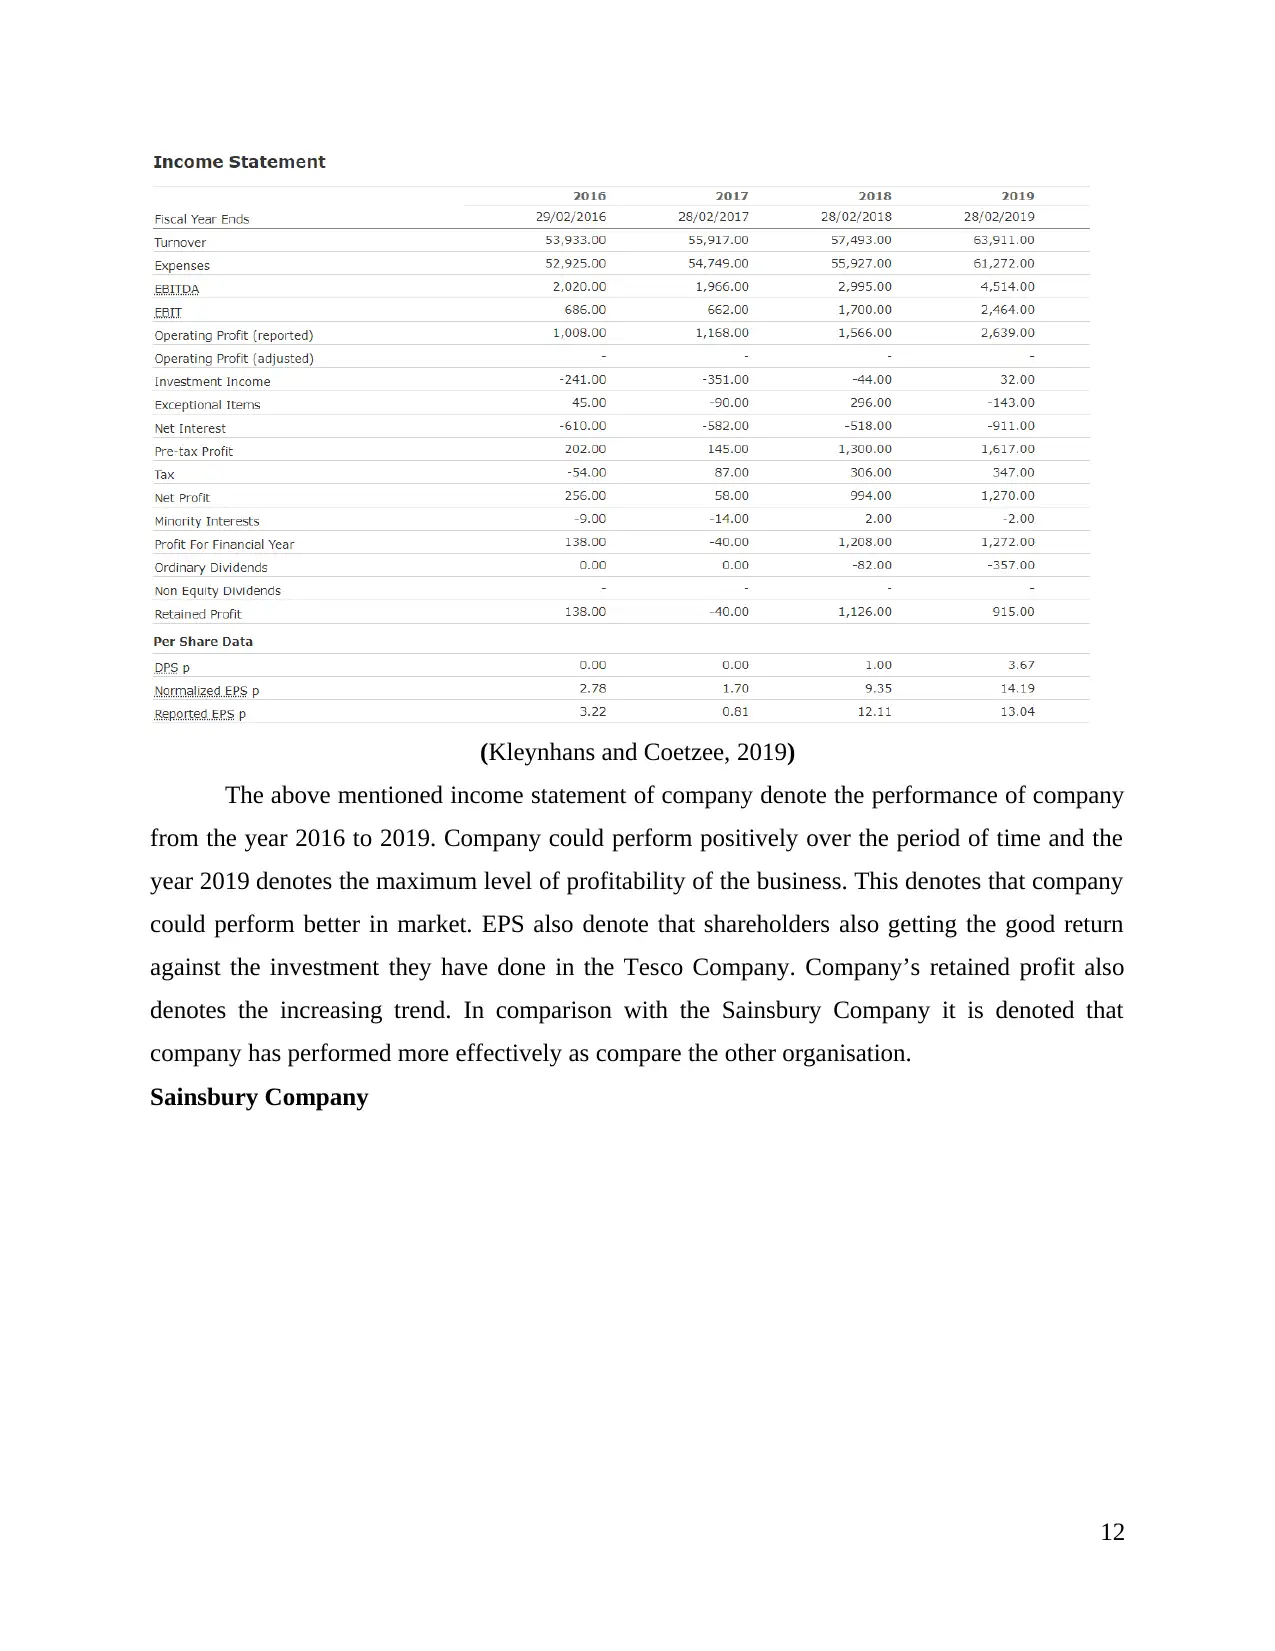
This report provides a comparative financial analysis of Tesco and Sainsbury, two major companies. It begins with an introduction to financial management and then presents two portfolios. Portfolio 1 focuses on financial ratio analysis, including current ratio, quick ratio, net profit margin, gross profit margin, gearing ratio, price-earning ratio, earning per share, return on capital employed, average inventories turnover period, and dividend payout ratio. The report calculates and compares these ratios for both companies over two years. It also assesses the performance of each company, highlighting Tesco's stronger financial position and providing recommendations for improving Sainsbury's financial performance, such as improving current assets, reducing the cost of goods sold, and reducing the average inventory turnover period. The report also discusses the limitations of relying solely on financial ratios. Portfolio 2 addresses investment appraisal techniques. The report concludes by summarizing the key findings and offering insights into the financial health and performance of the two companies.

PORTFOLIOS
Paraphrase This Document
Need a fresh take? Get an instant paraphrase of this document with our AI Paraphraser

TABLE OF CONTENTS
INTRODUCTION...........................................................................................................................3
Portfolio 1........................................................................................................................................3
Financial ratios.............................................................................................................................3
Performance of both the companies..........................................................................................11
Recommendations on financial performance of the poorly performing business.....................14
Limitations on relying financial ratios to interpret company’s performance............................15
PORTFOLIO 2..............................................................................................................................16
Investment appraisal techniques................................................................................................16
Limitation in long term decisions..............................................................................................18
CONCLUSION..............................................................................................................................19
REFERENCES..............................................................................................................................20

INTRODUCTION
Financial management is denoted as management of company’s financial resources. This
project would analysis different financial perspectives in regards to different companies.
Henceforth, this project would comparatively analysis two companies with the support of
different financial ratios of organisation. Analysis in respect to financial position of both the
companies will be done to identify which company contain better financial position. With the
support of comparative analysis in between both these companies suitable recommendations will
provide over improving the performance of poorly performed organisation. Dependency on
relying over the financial ratios will also do in this project. Furthermore, this project will also
analysis the suitable investment based on different investment appraisal techniques. Limitations
will also state in respect to utilising the suitable investment appraisal technique in long run.
Portfolio 1
Financial ratios
Ratios Formula Tesco Sainsbury
2018 2019 2018 2019
Current Ratio Current Asset
/ Current
Liability
.69(13511 /
19584)
.59(12480
/ 20973)
.76(7857 /
10302)
.64(7550 /
11849)
Current Asset (2018)
Sainsbury = Stock + Debtor + Cash and Securities
= 1810 + 4104 + 1933
= 7857
Tesco = Stock + Debtor + Cash and Securities
= 2264 + 6052 + 5156
= 13511
Current Liability (2018)
Sainsbury = 10302
Tesco = 19584
Current Asset (2019)
Sainsbury = Stock + Debtor + Cash and Securities
3
⊘ This is a preview!⊘
Do you want full access?
Subscribe today to unlock all pages.

Trusted by 1+ million students worldwide

= 1929 + 4268 + 1283
= 7550
Tesco = Stock + Debtor + Cash and Securities
= 2617 + 6432 + 3373
= 12480
Current Liability (2019)
Sainsbury = 11849
Tesco = 20973
Quick Ratio
Ratio Formula Tesco Sainsbury
2018 2019 2018 2019
Quick Ratio Quick Asset /
Current
Liability
.57(11247 /
19584)
.47(9863 /
20973)
.59(6047 /
10302)
.47(5621 /
11849)
Quick Asset (2018)
Tesco = Current Asset – Inventory
= 13511 – 2264
= 11247
Sainsbury = Current Asset – Inventory
= 7857 – 1810
= 6047
Current Liability (2018)
Tesco = 19584
Sainsbury = 10302
Quick Asset (2019)
Tesco = Current Asset – Inventory
= 9863(12480 - 2617)
Sainsbury = Current Asset – Inventory
= 5621 (7550 - 1929)
Current Liability (2019)
4
Paraphrase This Document
Need a fresh take? Get an instant paraphrase of this document with our AI Paraphraser

Tesco = 20973
Sainsbury = 11849
Net Profit Margin
Ratios Formula Tesco Sainsbury
2018 2019 2018 2019
Net Profit
Ratio (NPR)
Net Profit /
Sales * 100
1.73% (994 /
57493 * 100)
1.99%
(1270 /
63911 *
100)
1.09% (309 /
28456 * 100)
.64% (186 /
29007 * 100)
Tesco (2018)
Net Profit = 994
Sales = 57493
Tesco (2019)
Net Profit = 1270
Sales = 63911
Sainsbury (2018)
Net Profit = 309
Sales = 28456
Sainsbury (2019)
Net Profit = 186
Sales = 29007
Gross Profit Margin
Ratios Formula Tesco Sainsbury
2018 2019 2018 2019
Gross Profit
Margin
Gross Profit /
Sales * 100
2.72% (1566
/ 57493 *
100)
4.13%
(2639 /
63911 *
100)
1.82% (518 /
28456 * 100)
2.072% (601
/ 29007 *
100)
5

Tesco (2018)
Gross Profit = Turnover - Expenses
= 1566 (57493 - 55927)
Sales = 57493
Tesco (2019)
Gross Profit = Turnover - Expenses
= 2639 (63911 - 61272)
Sales = 63911
Sainsbury (2018)
Gross Profit = Turnover - Expenses
= 518 (28456 - 27938)
Sales = 28456
Sainsbury (2019)
Gross Profit = Turnover - Expenses
= 601(29007 - 28406)
Sales = 29007
Gearing Ratio
Ratios Formula Tesco Sainsbury
2018 2019 2018 2019
Gearing Ratio Debt / (Debt
+ Equity)
204.92 131.15 34.44 97.75
Price earning ratio
Ratios Formula Tesco Sainsbury
2018 2019 2018 2019
Price earning
ratio
Market value
per share /
earning per
26.39 16.94 27.13 22.75
6
Gross Profit = Turnover - Expenses
= 1566 (57493 - 55927)
Sales = 57493
Tesco (2019)
Gross Profit = Turnover - Expenses
= 2639 (63911 - 61272)
Sales = 63911
Sainsbury (2018)
Gross Profit = Turnover - Expenses
= 518 (28456 - 27938)
Sales = 28456
Sainsbury (2019)
Gross Profit = Turnover - Expenses
= 601(29007 - 28406)
Sales = 29007
Gearing Ratio
Ratios Formula Tesco Sainsbury
2018 2019 2018 2019
Gearing Ratio Debt / (Debt
+ Equity)
204.92 131.15 34.44 97.75
Price earning ratio
Ratios Formula Tesco Sainsbury
2018 2019 2018 2019
Price earning
ratio
Market value
per share /
earning per
26.39 16.94 27.13 22.75
6
⊘ This is a preview!⊘
Do you want full access?
Subscribe today to unlock all pages.

Trusted by 1+ million students worldwide

share
Earning per share
Ratios Formula Tesco Sainsbury
2018 2019 2018 2019
Earning per
share
Net Income –
Dividend
payment /
Total number
of equity
shares
12.11 13.04 12.7 7.5
Sainsbury (2018)
Net income – Dividend
309 – 235
74
Total equity share = 5.82
Sainsbury (2019)
Net income – Dividend
186 – 247
= 61 / 8.33
= 7.5
Tesco (2018)
Net income – Dividend
= 994 – 82
= 912
Total equity share = 75.31
Tesco (2019)
Net income – Dividend
= 1270 – 357
= 913
7
Paraphrase This Document
Need a fresh take? Get an instant paraphrase of this document with our AI Paraphraser

Toal equity share = 70.02
Return on capital employed
Ratios Formula Tesco Sainsbury
2018 2019 2018 2019
Return on
capital
employed
Earning
before
interest and
tax / capital
employed
.05 (1700 /
33153)
.07 (2464 /
35925)
.05 (544 /
11699)
.04 (620 /
16162)
Tesco (2018)
EBIT = 1700
Capital employed = Total asset – Current liability
= 52737 – 19584
= 33153
Tesco (2019)
EBIT = 2464
Capital employed = Total asset – Current liability
= 56898 – 20973
= 35925
Sainsbury (2018)
EBIT = 544
Capital employed = Total asset – Current liability
= 22001 – 10302
= 11699
Sainsbury (2019)
EBIT = 620
Capital employed = Total asset – Current liability
= 28011 – 11849
= 16162
8

Average inventories turnover period
Ratios Formula Tesco Sainsbury
2018 2019 2018 2019
Average
inventories
turnover
period
365 /
Inventory
turnover ratio
14.9 (365 /
24.5)
14.54 (365
/ 25.1)
23.4 (365 /
15.6)
24 (365 /
15.2)
Tesco (2018)
COGS = 55927
Average stock = Opening stock + Closing stock / 2
= 2301 + 2264 / 2
= 2283
Inventory turnover ratio = COGS / Average stock
= 55927 / 2283
= 24.5
Tesco (2019)
COGS = 61272
Average stock = Opening stock + Closing stock / 2
= 2264 + 2617 / 2
= 2441
Inventory turnover ratio = COGS / Average stock
= 61272 / 2441
= 25.1
Sainsbury (2018)
COGS = 27938
Average stock = Opening stock + Closing stock / 2
= 1775 + 1810 / 2
= 1793
Inventory turnover ratio = COGS / Average stock
9
⊘ This is a preview!⊘
Do you want full access?
Subscribe today to unlock all pages.

Trusted by 1+ million students worldwide

= 27938 / 1793
= 15.58
Sainsbury (2019)
COGS = 28406
Average stock = Opening stock + Closing stock / 2
= 1810 + 1929 / 2
= 1870
Inventory turnover ratio = COGS / Average stock
= 28406 / 1870
= 15.19
Dividend payout ratio
Ratios Formula Tesco Sainsbury
2018 2019 2018 2019
Dividend
payout ratio
Total
dividend /
Net profit *
100
8.25% (82 /
994 * 100)
28.11%
(357 /
1270 *
100)
76.05% (235 /
309 * 100)
133% (247 /
186 * 100)
Tesco (2018)
Total dividend = 82
Net profit = 994
Tesco (2019)
Total dividend = 357
Net profit = 1270
Sainsbury (2018)
Total dividend = 235
Net profit = 309
Sainsbury (2019)
Total dividend = 247
Net profit = 186
10
Paraphrase This Document
Need a fresh take? Get an instant paraphrase of this document with our AI Paraphraser

Performance of both the companies
Tesco Company
(Handayani, Indrabudiman and Faeni, 2018)
Tesco Company is one of the leading companies associated with the retail sector.
Company balance sheet project that it has denoted the increasing trend in the overall
performance of organisation. Over the period of time the balance sheet of company project that
organisation has entertained the increasing trend in all its assets which comprises with different
current asset and long term asset (Saus–Sala and et.al., 2020). The increasing trend in assets of
company denotes that it could perform well in market. Except one year the reserve of
shareholders have always increased which denote that profitability in benefiting to the
shareholders of company. In the year 2019 company reserves denoted at the highest level.
Company shareholder funds also denote that it consist the highest level of shareholding in the
year 2019.
11

(Kleynhans and Coetzee, 2019)
The above mentioned income statement of company denote the performance of company
from the year 2016 to 2019. Company could perform positively over the period of time and the
year 2019 denotes the maximum level of profitability of the business. This denotes that company
could perform better in market. EPS also denote that shareholders also getting the good return
against the investment they have done in the Tesco Company. Company’s retained profit also
denotes the increasing trend. In comparison with the Sainsbury Company it is denoted that
company has performed more effectively as compare the other organisation.
Sainsbury Company
12
⊘ This is a preview!⊘
Do you want full access?
Subscribe today to unlock all pages.

Trusted by 1+ million students worldwide
1 out of 22
Related Documents

Your All-in-One AI-Powered Toolkit for Academic Success.
+13062052269
info@desklib.com
Available 24*7 on WhatsApp / Email
Unlock your academic potential
Copyright © 2020–2025 A2Z Services. All Rights Reserved. Developed and managed by ZUCOL.