Managerial Finance Report: Tesco and Sainsbury Performance Analysis
VerifiedAdded on  2023/01/03
|18
|3489
|2
Report
AI Summary
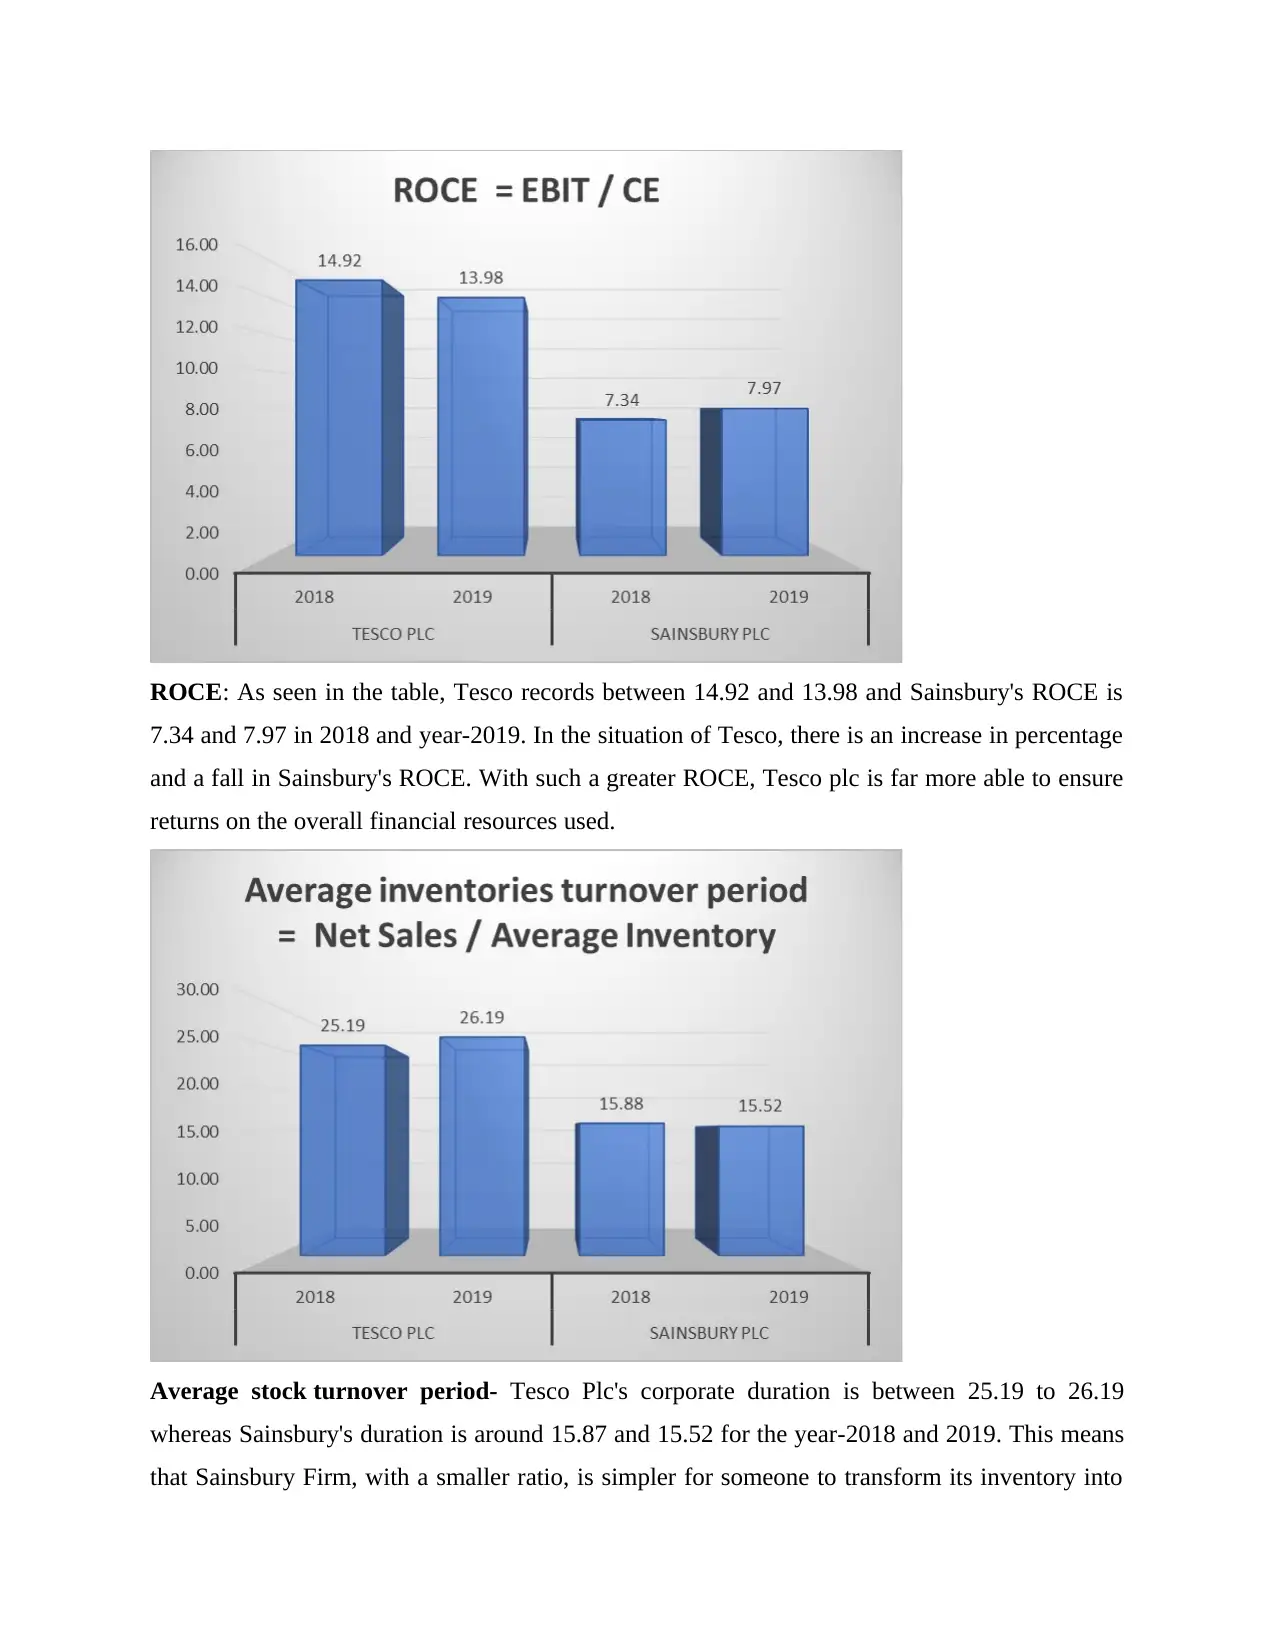
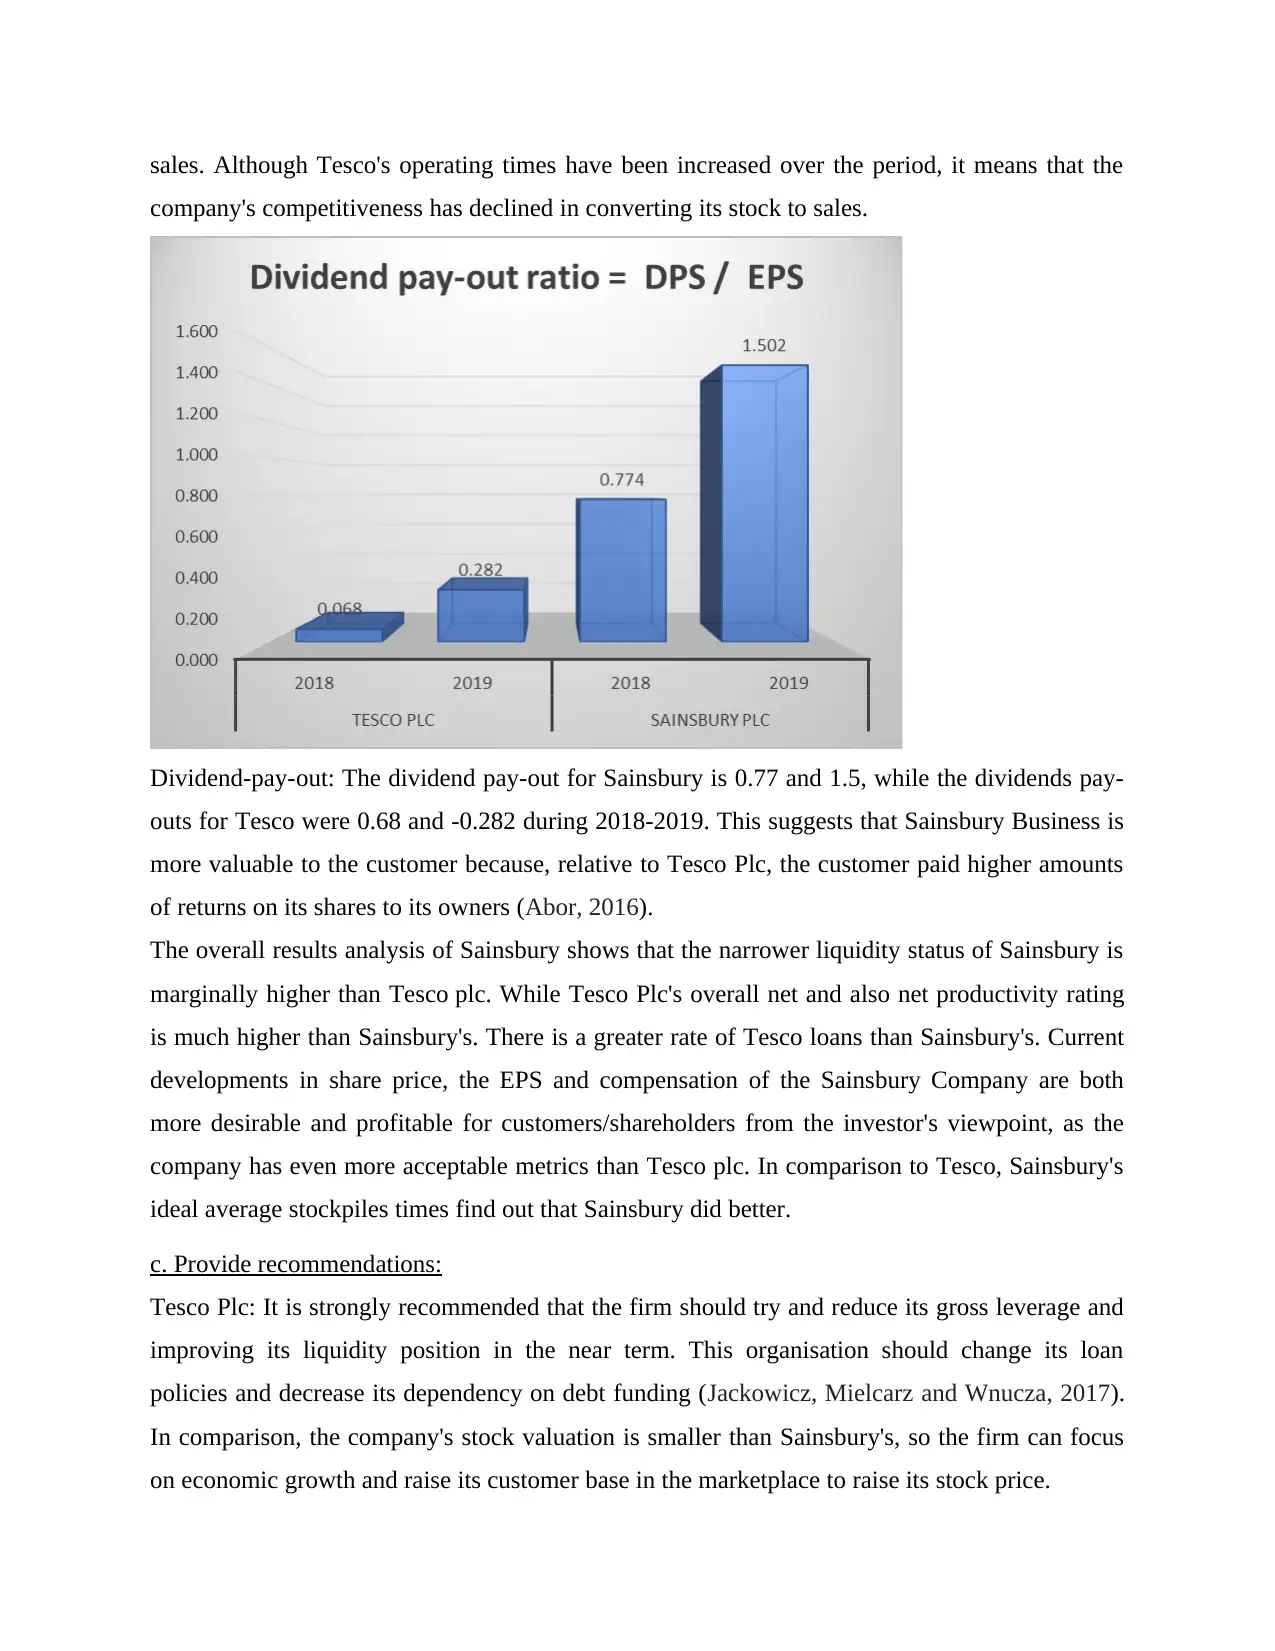
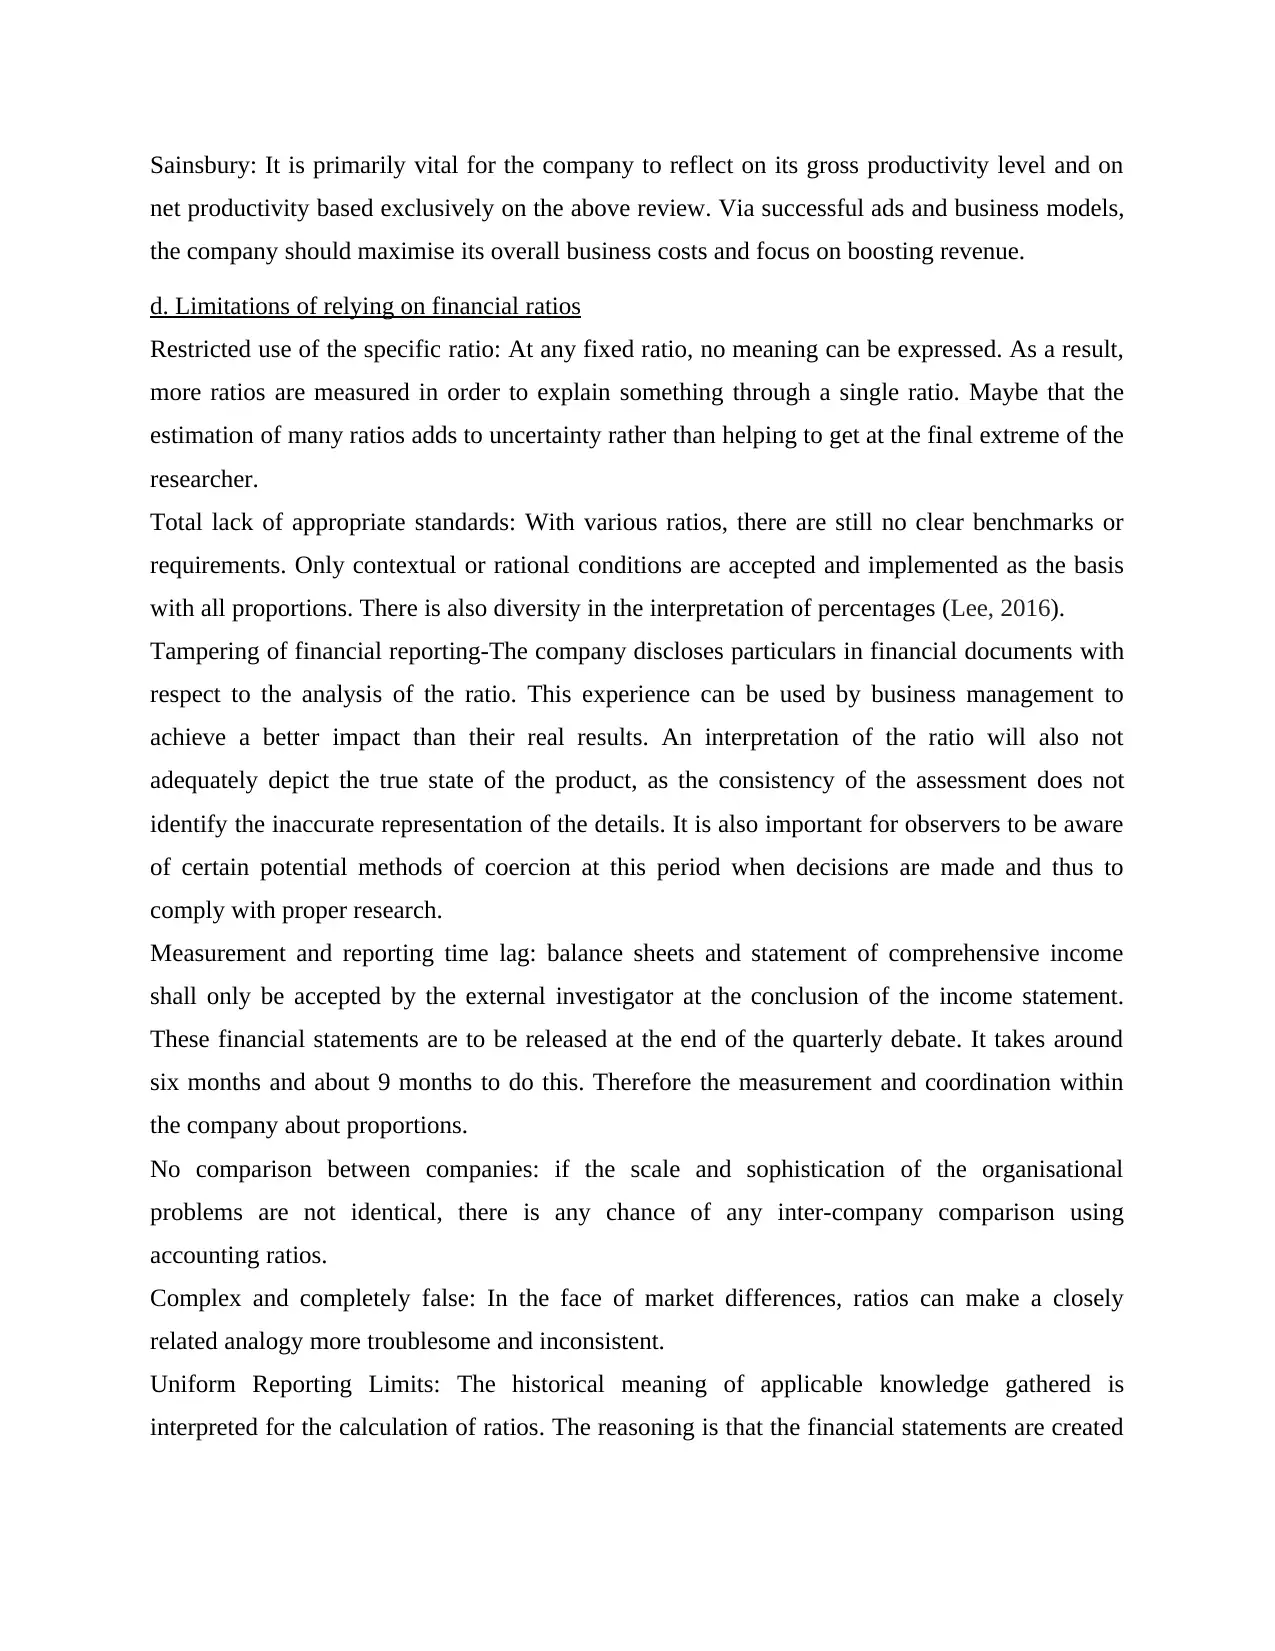
This report delves into the realm of managerial finance, offering a comprehensive analysis of two leading UK companies, Tesco and Sainsbury, over the period of 2018-2019. The report is divided into two primary sections. The first section focuses on a detailed ratio analysis, calculating and interpreting ten key financial ratios to assess the companies' performance, financial position, and investment potential. The ratios include current ratio, quick ratio, net profit margin, gross profit margin, gearing ratio, P/E ratio, earnings per share (EPS), return on capital employed (ROCE), average inventory turnover period, and dividend pay-out ratio. The second section explores investment appraisal techniques, including Net Present Value (NPV), Payback Period, and Average Rate of Return (ARR), along with their limitations in long-term decision-making. The report concludes with recommendations for each company, based on the financial analysis, and a discussion of the limitations of relying on financial ratios.

Managerial Finance
Paraphrase This Document
Need a fresh take? Get an instant paraphrase of this document with our AI Paraphraser

Contents
TASK 1............................................................................................................................................3
a. Calculation of 10 financial ratios as given below for two years (2018 and 2019):.................3
b. Analyse performance, financial position and investment potential of both companies:.........5
c. Provide recommendations:.....................................................................................................11
d. Limitations of relying on financial ratios..............................................................................12
TASK 2..........................................................................................................................................13
a. Investment appraisal techniques:...........................................................................................13
b. Limitations of using investment appraisal techniques in long term decision making:..........15
CONCLUSION..............................................................................................................................17
REFERENCES..............................................................................................................................18

INTRODUCTION
Management finance is mostly related to the measurement of financial processes rather than to
the financial methods itself. This differs from the realistic approach, which would be highly
concerned only with the assessment and whether money has been allocated to the related regions
(Dandapani, 2017). The aim of the organizational structure is to determine the relevance of
effects, projections, and figures. Management financing looks at how investment decisions
should be improved, where changes can be made to help prevent losses and boost the bottom
line. The report consists of two key sections of the leading UK companies' first component ratio
analysis: Tesco and Sainsbury were conducted to assess their results from an investor viewpoint.
Although the second section includes a realistic total of various methods of investment valuation
as well as their limits.
TASK 1
a. Calculation of 10 financial ratios as given below for two years (2018 and 2019):
(Amounts are in GBP thousand except ratios) Tesco PLC Sainsbury PLC
Year 2018 Year 2019 Year 2018 Year 2019
Current Ratio
Current Assets 13726000 12668000 7857000 7550000
Current Liabilities 19238000 20680000 10302000 11849000
Current Ratio = Current Assets / Current
Liabilities
0.713484 0.612573 0.76266744
3
0.637185
Quick Ratio
Quick Asset 11463000 10051000 7857000 7550000
Current Liabilities 19238000 20680000 10302000 11849000
Quick Ratio = Quick Assets / Current
Liabilities
0.595852 0.486025 0.76266744
3
0.637185
Net Profit Margin
Net Profit 1206000 1322000 291000 168000
Sales 57491000 63911000 28456000 29007000
Net Profit Margin = Net Profit / Sales *100 2.09772 2.068502 1.02263143 0.579171
⊘ This is a preview!⊘
Do you want full access?
Subscribe today to unlock all pages.

Trusted by 1+ million students worldwide

1
Gross Profit Margin
Gross Profit 3350000 4144000 544000 620000
Sales 57491000 63911000 28456000 29007000
Gross Profit Margin = Gross Profit / Sales
*100
5.826999 6.484017 1.91172336
2
2.137415
Gearing ratios
Long term Liabilities 15144000 13509000 2552000 7607000
Capital Employed 10480000 14858000 7411000 7782000
Gearing Ratio = Long term Liabilities / CE *
100
144.5038 90.92072 34.44 97.75
P/E ratio
Price 197.4 255.1 260 229.2
Earnings per Share 0.44 0.39 12.54 6.79
PE Ratio = Price / EPS 448.6364 654.1026 20.7336523
1
33.75552
Earnings per share
Total net profit 1206000 1322000 291000 168000
Total no. of outstanding shares 2731000 3253000 243700 245700
EPS = Net Profit / Total no. outstanding
shares
0.441596 0.406394 1.19409109
6
0.683761
Return on capital employed
EBIT 1564000 2077000 544000 620000
CE 10480000 14858000 7411000 7782000
ROCE = EBIT / CE 14.92366 13.979 7.34043988
7
7.967104
Paraphrase This Document
Need a fresh take? Get an instant paraphrase of this document with our AI Paraphraser

Average inventories turnover period
Net Sales 57491000 63911000 28456000 29007000
Average inventories 2282000 2440000 1792500 1869500
Average inventories turnover period = Net
Sales / Average Inventory
25.19325 26.19303 15.8750348
7
15.51591
Dividend pay-out ratio
DPS 0.03 0.11 9.7 10.2
EPS 0.44 0.39 12.54 6.79
Dividend pay-out ratio = DPS / EPS 0.068182 0.282051 0.77352472
1
1.502209
b. Analyse performance, financial position and investment potential of both companies:
Current Ratio: As seen in the aforementioned graph, Tesco Firm's current ratios are 0.61 and
0.71 over the cycles of 2019 and 2018, indicating improvements over the two years, although
Sainsbury's average figure is 0.64 and 0.76, respectively, around the same time span. While
Sainsbury's narrower flexibility performance with a higher current ratio is better compared to
Tesco, both companies showed better results in the proportion.

Quick Ratio: The Quick Proportions are 0.60 and.49 since year-2018 and year-2019 together, as
seen in the earlier in this thread chart, while the Quick Ratio of the Sainsbury group is about 0.59
and 0.47 over that same time period including both. There is also a growing change in
accelerated ratios, which reflects an improvement in all companies' cash liquidity scenarios.
Relatively, the fast ratios of the Tesco are marginally higher than that of the Sainsbury market.
Net Profit Margin: Using the net profit margin and gross profit margin, the output of both firms
can be calculated effectively. The net income proportions seen in the above-mentioned Sainsbury
⊘ This is a preview!⊘
Do you want full access?
Subscribe today to unlock all pages.

Trusted by 1+ million students worldwide

map are 1.02 % and 0.58 percent in the years 2018 and 2019, with a growing increase; while
Tesco Plc's net income figures are 2.10 % and 2.07 percent in the years 2018 and 2019. Thus, all
such firms posted increased levels of future income, but compared to Sainsbury, Tesco Plc
generated better competitive advantage, which implies that the degree of profit margins is far
higher than those of Sainsbury (Singh, Joshi and Kansal, 2016).
Gross Profit Ratio: Tesco Plc's management efficiency levels are 5.82 percent in 2018 and 6.48
% in 2019, while the Sainsbury GP figures for 2018-2019 are 1.9 percent and 2.14 percent. Data
indicates that Tesco Plc, with a higher proportion of income, is more successful in generating
revenues from its core market operations than Sainsbury.
Paraphrase This Document
Need a fresh take? Get an instant paraphrase of this document with our AI Paraphraser

Gearing ratio- The Gearing Ratios displayed in the above graph represent the actual amount of
leverage of the firms. Tesco Plc registered a capital structure of 90.92 in year-2019 and 144.50 in
year-2018, while the financial leverage of Sainsbury Market in year-2018 and year-2019 were
34.44 percent and 97.75 percentage points. Tesco has posted a greater proportion than Sainsbury,
which implies that perhaps the corporate leverage cost is higher (Kumar and Pathak, 2016). As a
consequence, the financial condition of Sainsbury's group is higher than Tesco Plc.

PE ratio: The Tesco PE ratio is collectively 448.63 and 654.10 for year-2018 as well as year-
2019, with such a declining trajectory, whereas the P / e ratio of Sainsbury Company is 20.73
and 33.75 for much the same cycles as a consequence of the decreasing PE ratio phenomenon.
This means that Sainsbury Company is more successful in supplying its owners with dividends
for any equity they have and the valuation of the shares of Sainsbury Business is higher.
EPS: As shown in Tesco Plc's EPS graph in 2019, Tesco Plc's EPS is about 0.41 and
approximately 0.44 in 2018, while the EPS of Sainsbury's business were about 1.19 and 0.68 in
2018 and 2019. Study reveals that EPS amount is reducing in both firms. The EPS of the
Sainsbury is larger than the Tesco group, which suggests that perhaps the Sainsbury business is
better at creating returns from each of its shares (Lassoued, Attia and Sassi, 2017).
⊘ This is a preview!⊘
Do you want full access?
Subscribe today to unlock all pages.

Trusted by 1+ million students worldwide

ROCE: As seen in the table, Tesco records between 14.92 and 13.98 and Sainsbury's ROCE is
7.34 and 7.97 in 2018 and year-2019. In the situation of Tesco, there is an increase in percentage
and a fall in Sainsbury's ROCE. With such a greater ROCE, Tesco plc is far more able to ensure
returns on the overall financial resources used.
Average stock turnover period- Tesco Plc's corporate duration is between 25.19 to 26.19
whereas Sainsbury's duration is around 15.87 and 15.52 for the year-2018 and 2019. This means
that Sainsbury Firm, with a smaller ratio, is simpler for someone to transform its inventory into
Paraphrase This Document
Need a fresh take? Get an instant paraphrase of this document with our AI Paraphraser

sales. Although Tesco's operating times have been increased over the period, it means that the
company's competitiveness has declined in converting its stock to sales.
Dividend-pay-out: The dividend pay-out for Sainsbury is 0.77 and 1.5, while the dividends pay-
outs for Tesco were 0.68 and -0.282 during 2018-2019. This suggests that Sainsbury Business is
more valuable to the customer because, relative to Tesco Plc, the customer paid higher amounts
of returns on its shares to its owners (Abor, 2016).
The overall results analysis of Sainsbury shows that the narrower liquidity status of Sainsbury is
marginally higher than Tesco plc. While Tesco Plc's overall net and also net productivity rating
is much higher than Sainsbury's. There is a greater rate of Tesco loans than Sainsbury's. Current
developments in share price, the EPS and compensation of the Sainsbury Company are both
more desirable and profitable for customers/shareholders from the investor's viewpoint, as the
company has even more acceptable metrics than Tesco plc. In comparison to Tesco, Sainsbury's
ideal average stockpiles times find out that Sainsbury did better.
c. Provide recommendations:
Tesco Plc: It is strongly recommended that the firm should try and reduce its gross leverage and
improving its liquidity position in the near term. This organisation should change its loan
policies and decrease its dependency on debt funding (Jackowicz, Mielcarz and Wnucza, 2017).
In comparison, the company's stock valuation is smaller than Sainsbury's, so the firm can focus
on economic growth and raise its customer base in the marketplace to raise its stock price.

Sainsbury: It is primarily vital for the company to reflect on its gross productivity level and on
net productivity based exclusively on the above review. Via successful ads and business models,
the company should maximise its overall business costs and focus on boosting revenue.
d. Limitations of relying on financial ratios
Restricted use of the specific ratio: At any fixed ratio, no meaning can be expressed. As a result,
more ratios are measured in order to explain something through a single ratio. Maybe that the
estimation of many ratios adds to uncertainty rather than helping to get at the final extreme of the
researcher.
Total lack of appropriate standards: With various ratios, there are still no clear benchmarks or
requirements. Only contextual or rational conditions are accepted and implemented as the basis
with all proportions. There is also diversity in the interpretation of percentages (Lee, 2016).
Tampering of financial reporting-The company discloses particulars in financial documents with
respect to the analysis of the ratio. This experience can be used by business management to
achieve a better impact than their real results. An interpretation of the ratio will also not
adequately depict the true state of the product, as the consistency of the assessment does not
identify the inaccurate representation of the details. It is also important for observers to be aware
of certain potential methods of coercion at this period when decisions are made and thus to
comply with proper research.
Measurement and reporting time lag: balance sheets and statement of comprehensive income
shall only be accepted by the external investigator at the conclusion of the income statement.
These financial statements are to be released at the end of the quarterly debate. It takes around
six months and about 9 months to do this. Therefore the measurement and coordination within
the company about proportions.
No comparison between companies: if the scale and sophistication of the organisational
problems are not identical, there is any chance of any inter-company comparison using
accounting ratios.
Complex and completely false: In the face of market differences, ratios can make a closely
related analogy more troublesome and inconsistent.
Uniform Reporting Limits: The historical meaning of applicable knowledge gathered is
interpreted for the calculation of ratios. The reasoning is that the financial statements are created
⊘ This is a preview!⊘
Do you want full access?
Subscribe today to unlock all pages.

Trusted by 1+ million students worldwide
1 out of 18
Related Documents

Your All-in-One AI-Powered Toolkit for Academic Success.
 +13062052269
info@desklib.com
Available 24*7 on WhatsApp / Email
Unlock your academic potential
Copyright © 2020–2025 A2Z Services. All Rights Reserved. Developed and managed by ZUCOL.