Accounting and Finance Report: Pharma Company Financial Analysis
VerifiedAdded on 2021/06/18
|19
|3429
|13
Report
AI Summary
This report provides a comprehensive financial analysis of three major pharmaceutical companies: GlaxoSmithKline PLC, AstraZeneca PLC, and Shire PLC. It utilizes financial ratio analysis, including current ratio, quick ratio, net profit margin, return on assets, return on equity, interest coverage ratio, net asset turnover ratio, inventory turnover ratio, collection period, credit period, and gearing ratio, to assess their performance from 2014 to 2016. The analysis includes both financial and non-financial ratios, such as employee turnover and market share. The report evaluates the companies' profitability, liquidity, efficiency, and solvency, providing insights into their investment potential and overall financial health. Additionally, it examines the capital investment decision-making process, outlining key stages such as identification, screening, evaluation, approval, and implementation of investment opportunities.

RUNNING HEAD: ACCOUNTING AND FINANCE
Accounting and Finance
Accounting and Finance
Paraphrase This Document
Need a fresh take? Get an instant paraphrase of this document with our AI Paraphraser
Accounting and finance 2
Question 1
Part A
Analysis of financial position – ratio analysis
Financial ratios
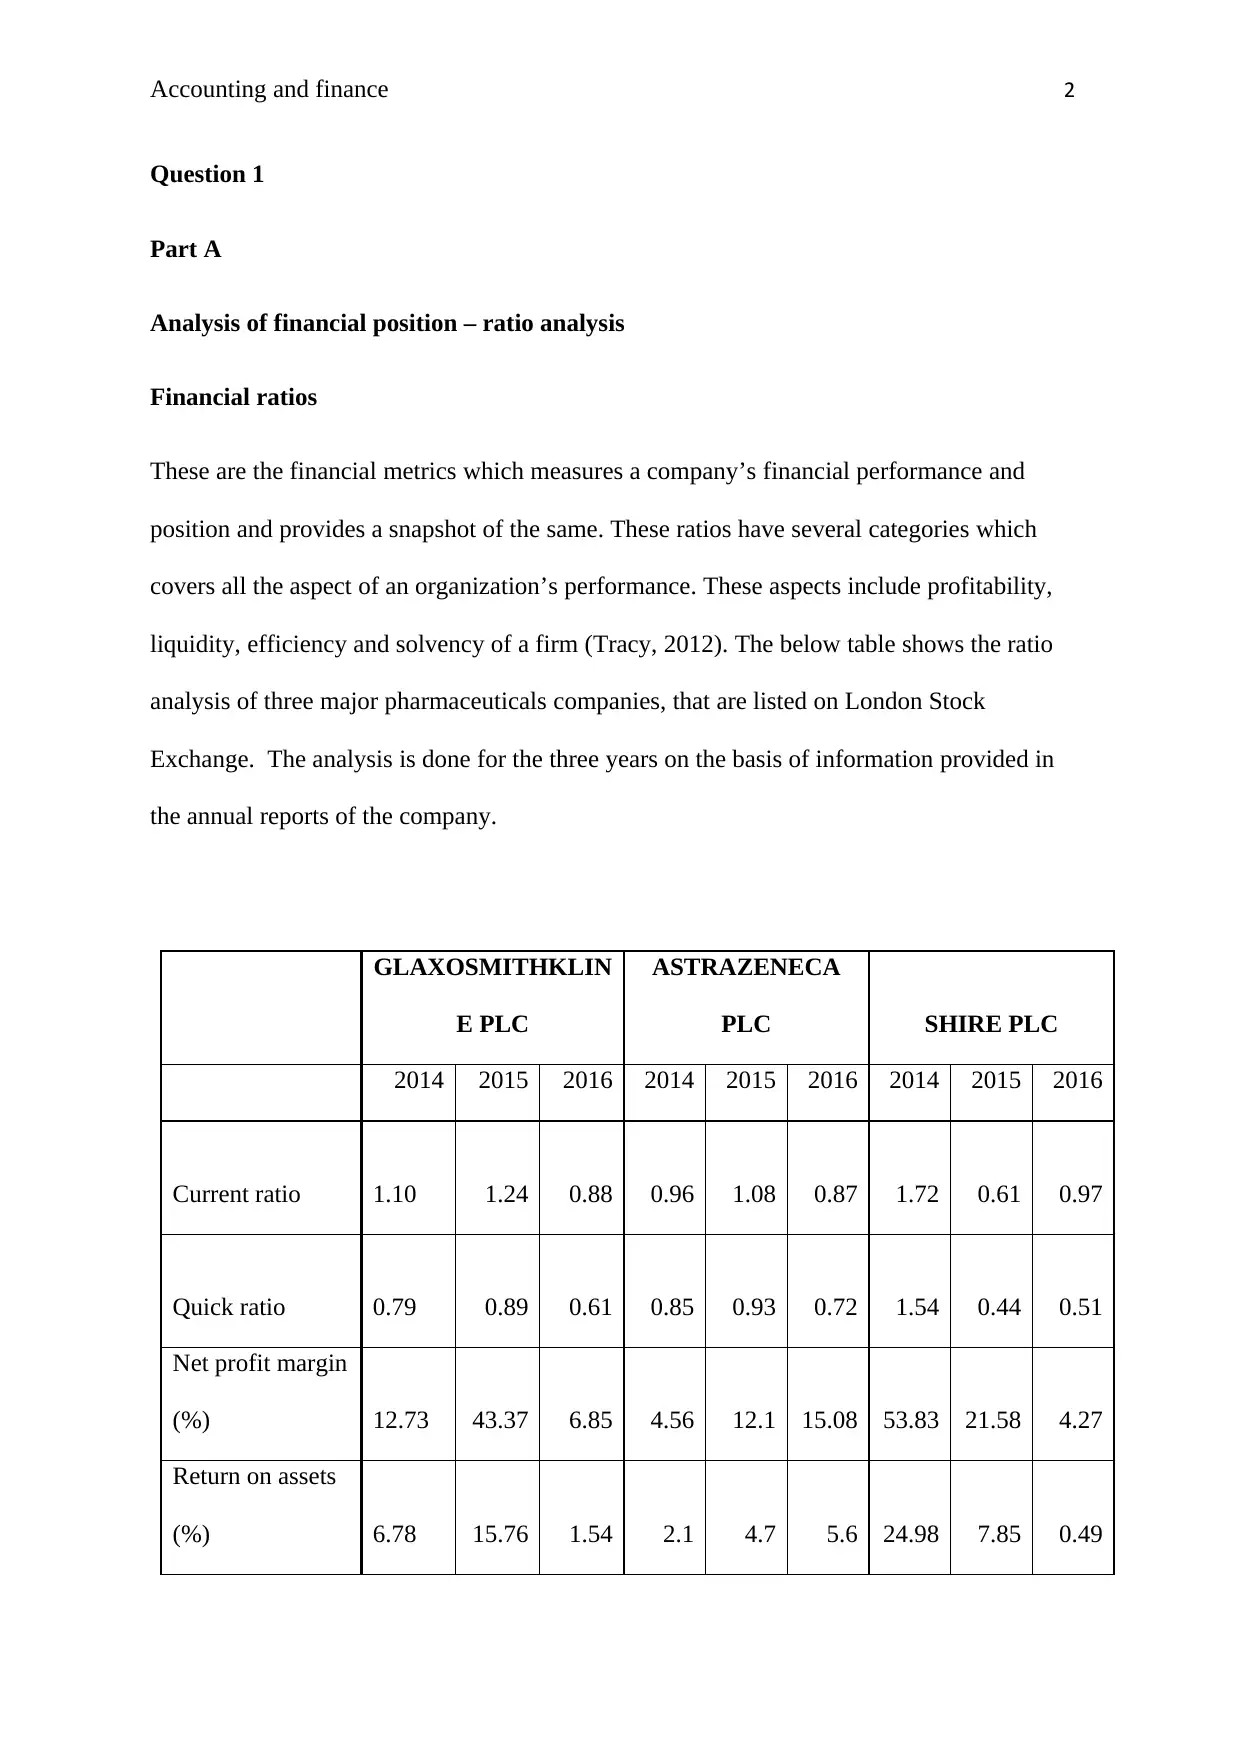
These are the financial metrics which measures a company’s financial performance and
position and provides a snapshot of the same. These ratios have several categories which
covers all the aspect of an organization’s performance. These aspects include profitability,
liquidity, efficiency and solvency of a firm (Tracy, 2012). The below table shows the ratio
analysis of three major pharmaceuticals companies, that are listed on London Stock
Exchange. The analysis is done for the three years on the basis of information provided in
the annual reports of the company.
GLAXOSMITHKLIN
E PLC
ASTRAZENECA
PLC SHIRE PLC
2014 2015 2016 2014 2015 2016 2014 2015 2016
Current ratio 1.10 1.24 0.88 0.96 1.08 0.87 1.72 0.61 0.97
Quick ratio 0.79 0.89 0.61 0.85 0.93 0.72 1.54 0.44 0.51
Net profit margin
(%) 12.73 43.37 6.85 4.56 12.1 15.08 53.83 21.58 4.27
Return on assets
(%) 6.78 15.76 1.54 2.1 4.7 5.6 24.98 7.85 0.49
Question 1
Part A
Analysis of financial position – ratio analysis
Financial ratios
These are the financial metrics which measures a company’s financial performance and
position and provides a snapshot of the same. These ratios have several categories which
covers all the aspect of an organization’s performance. These aspects include profitability,
liquidity, efficiency and solvency of a firm (Tracy, 2012). The below table shows the ratio
analysis of three major pharmaceuticals companies, that are listed on London Stock
Exchange. The analysis is done for the three years on the basis of information provided in
the annual reports of the company.
GLAXOSMITHKLIN
E PLC
ASTRAZENECA
PLC SHIRE PLC
2014 2015 2016 2014 2015 2016 2014 2015 2016
Current ratio 1.10 1.24 0.88 0.96 1.08 0.87 1.72 0.61 0.97
Quick ratio 0.79 0.89 0.61 0.85 0.93 0.72 1.54 0.44 0.51
Net profit margin
(%) 12.73 43.37 6.85 4.56 12.1 15.08 53.83 21.58 4.27
Return on assets
(%) 6.78 15.76 1.54 2.1 4.7 5.6 24.98 7.85 0.49
Accounting and finance 3
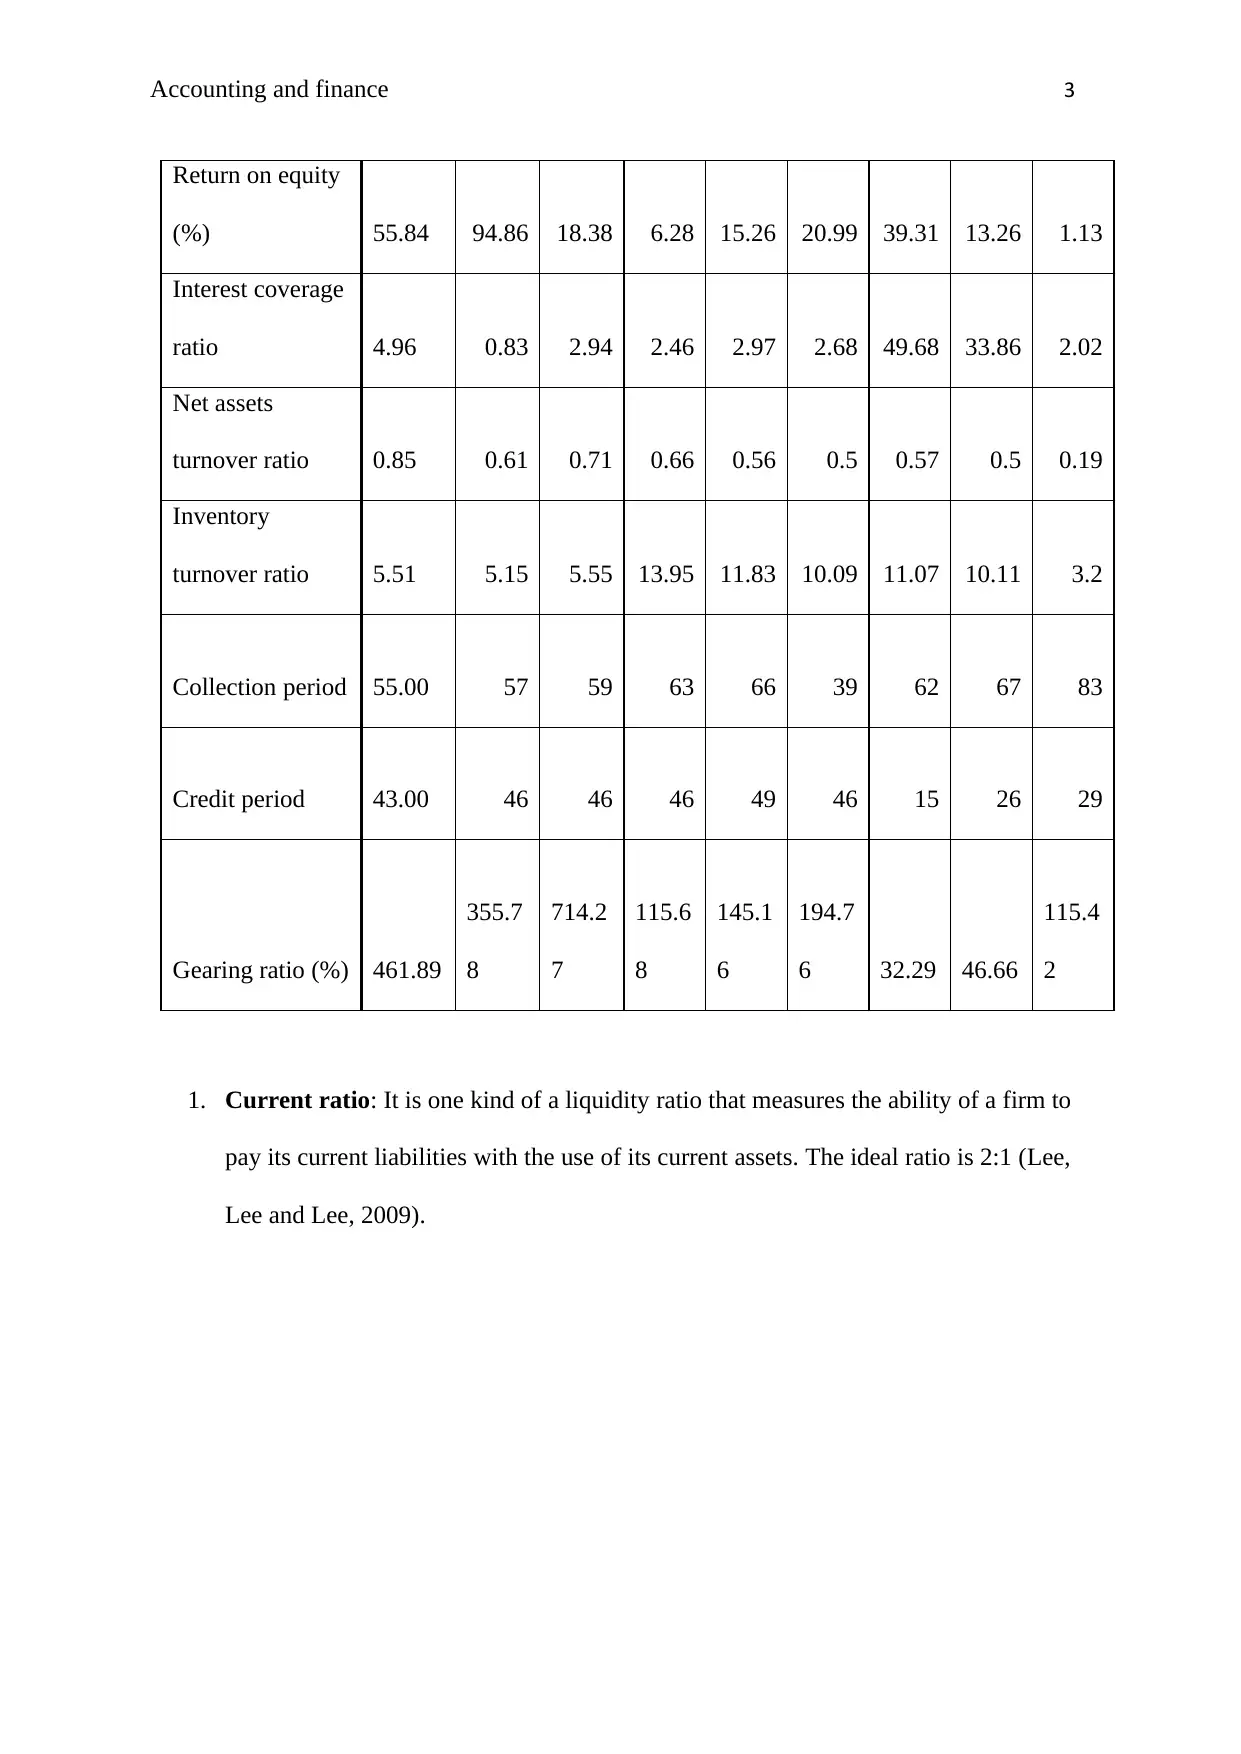
Return on equity
(%) 55.84 94.86 18.38 6.28 15.26 20.99 39.31 13.26 1.13
Interest coverage
ratio 4.96 0.83 2.94 2.46 2.97 2.68 49.68 33.86 2.02
Net assets
turnover ratio 0.85 0.61 0.71 0.66 0.56 0.5 0.57 0.5 0.19
Inventory
turnover ratio 5.51 5.15 5.55 13.95 11.83 10.09 11.07 10.11 3.2
Collection period 55.00 57 59 63 66 39 62 67 83
Credit period 43.00 46 46 46 49 46 15 26 29
Gearing ratio (%) 461.89
355.7
8
714.2
7
115.6
8
145.1
6
194.7
6 32.29 46.66
115.4
2
1. Current ratio: It is one kind of a liquidity ratio that measures the ability of a firm to
pay its current liabilities with the use of its current assets. The ideal ratio is 2:1 (Lee,
Lee and Lee, 2009).
⊘ This is a preview!⊘
Do you want full access?
Subscribe today to unlock all pages.
Trusted by 1+ million students worldwide
Accounting and finance 4
2014 2015 2016 2014 2015 2016 2014 2015 2016
GLAXOSMITHKLINE PLC ASTRAZENECA PLC SHIRE PLC
-
0.20
0.40
0.60
0.80
1.00
1.20
1.40
1.60
1.80
2.00
Current ratio
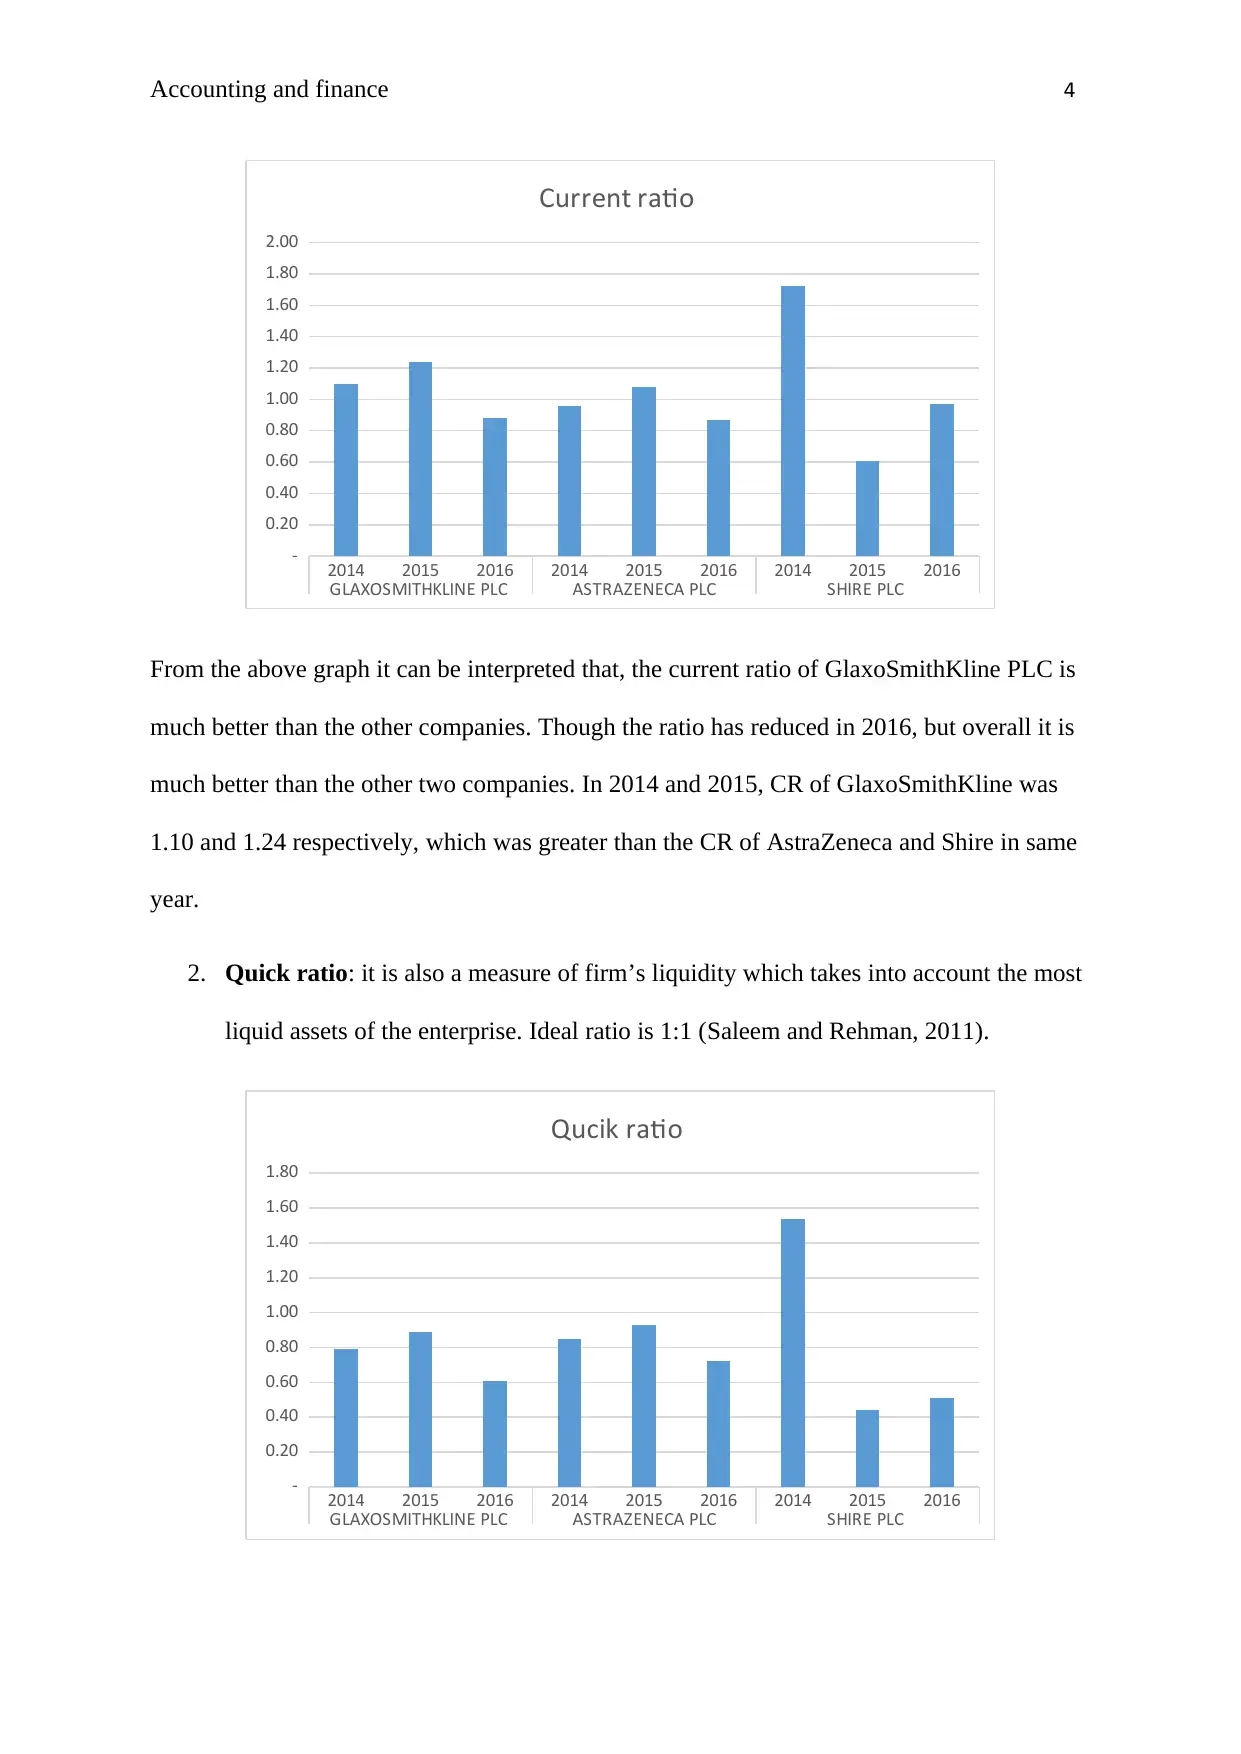
From the above graph it can be interpreted that, the current ratio of GlaxoSmithKline PLC is
much better than the other companies. Though the ratio has reduced in 2016, but overall it is
much better than the other two companies. In 2014 and 2015, CR of GlaxoSmithKline was
1.10 and 1.24 respectively, which was greater than the CR of AstraZeneca and Shire in same
year.
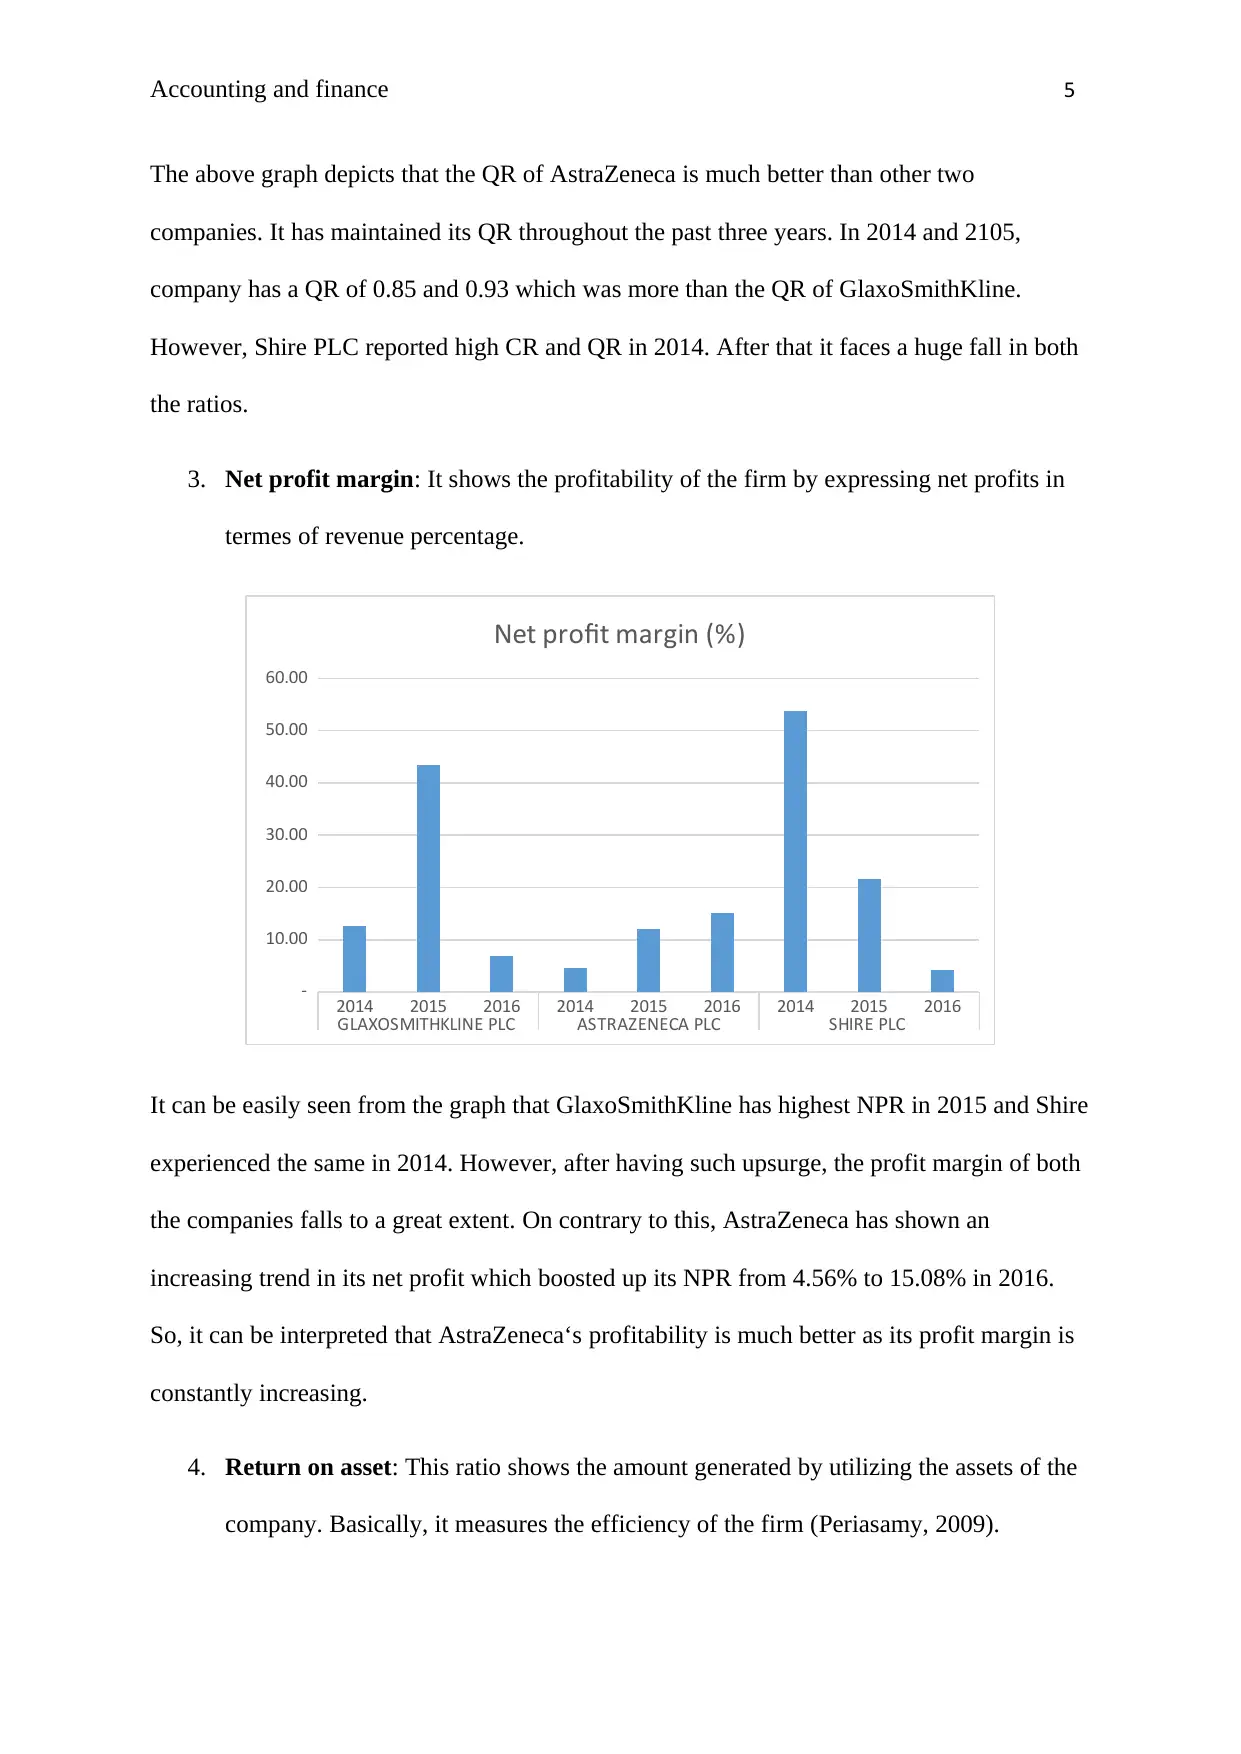
2. Quick ratio: it is also a measure of firm’s liquidity which takes into account the most
liquid assets of the enterprise. Ideal ratio is 1:1 (Saleem and Rehman, 2011).
2014 2015 2016 2014 2015 2016 2014 2015 2016
GLAXOSMITHKLINE PLC ASTRAZENECA PLC SHIRE PLC
-
0.20
0.40
0.60
0.80
1.00
1.20
1.40
1.60
1.80
Qucik ratio
2014 2015 2016 2014 2015 2016 2014 2015 2016
GLAXOSMITHKLINE PLC ASTRAZENECA PLC SHIRE PLC
-
0.20
0.40
0.60
0.80
1.00
1.20
1.40
1.60
1.80
2.00
Current ratio
From the above graph it can be interpreted that, the current ratio of GlaxoSmithKline PLC is
much better than the other companies. Though the ratio has reduced in 2016, but overall it is
much better than the other two companies. In 2014 and 2015, CR of GlaxoSmithKline was
1.10 and 1.24 respectively, which was greater than the CR of AstraZeneca and Shire in same
year.
2. Quick ratio: it is also a measure of firm’s liquidity which takes into account the most
liquid assets of the enterprise. Ideal ratio is 1:1 (Saleem and Rehman, 2011).
2014 2015 2016 2014 2015 2016 2014 2015 2016
GLAXOSMITHKLINE PLC ASTRAZENECA PLC SHIRE PLC
-
0.20
0.40
0.60
0.80
1.00
1.20
1.40
1.60
1.80
Qucik ratio
Paraphrase This Document
Need a fresh take? Get an instant paraphrase of this document with our AI Paraphraser
Accounting and finance 5
The above graph depicts that the QR of AstraZeneca is much better than other two
companies. It has maintained its QR throughout the past three years. In 2014 and 2105,
company has a QR of 0.85 and 0.93 which was more than the QR of GlaxoSmithKline.
However, Shire PLC reported high CR and QR in 2014. After that it faces a huge fall in both
the ratios.
3. Net profit margin: It shows the profitability of the firm by expressing net profits in
termes of revenue percentage.
2014 2015 2016 2014 2015 2016 2014 2015 2016
GLAXOSMITHKLINE PLC ASTRAZENECA PLC SHIRE PLC
-
10.00
20.00
30.00
40.00
50.00
60.00
Net profit margin (%)
It can be easily seen from the graph that GlaxoSmithKline has highest NPR in 2015 and Shire
experienced the same in 2014. However, after having such upsurge, the profit margin of both
the companies falls to a great extent. On contrary to this, AstraZeneca has shown an
increasing trend in its net profit which boosted up its NPR from 4.56% to 15.08% in 2016.
So, it can be interpreted that AstraZeneca‘s profitability is much better as its profit margin is
constantly increasing.
4. Return on asset: This ratio shows the amount generated by utilizing the assets of the
company. Basically, it measures the efficiency of the firm (Periasamy, 2009).
Accounting and finance 6
2014 2015 2016 2014 2015 2016 2014 2015 2016
GLAXOSMITHKLINE PLC ASTRAZENECA PLC SHIRE PLC
-
5.00
10.00
15.00
20.00
25.00
30.00
Return on assets (%)
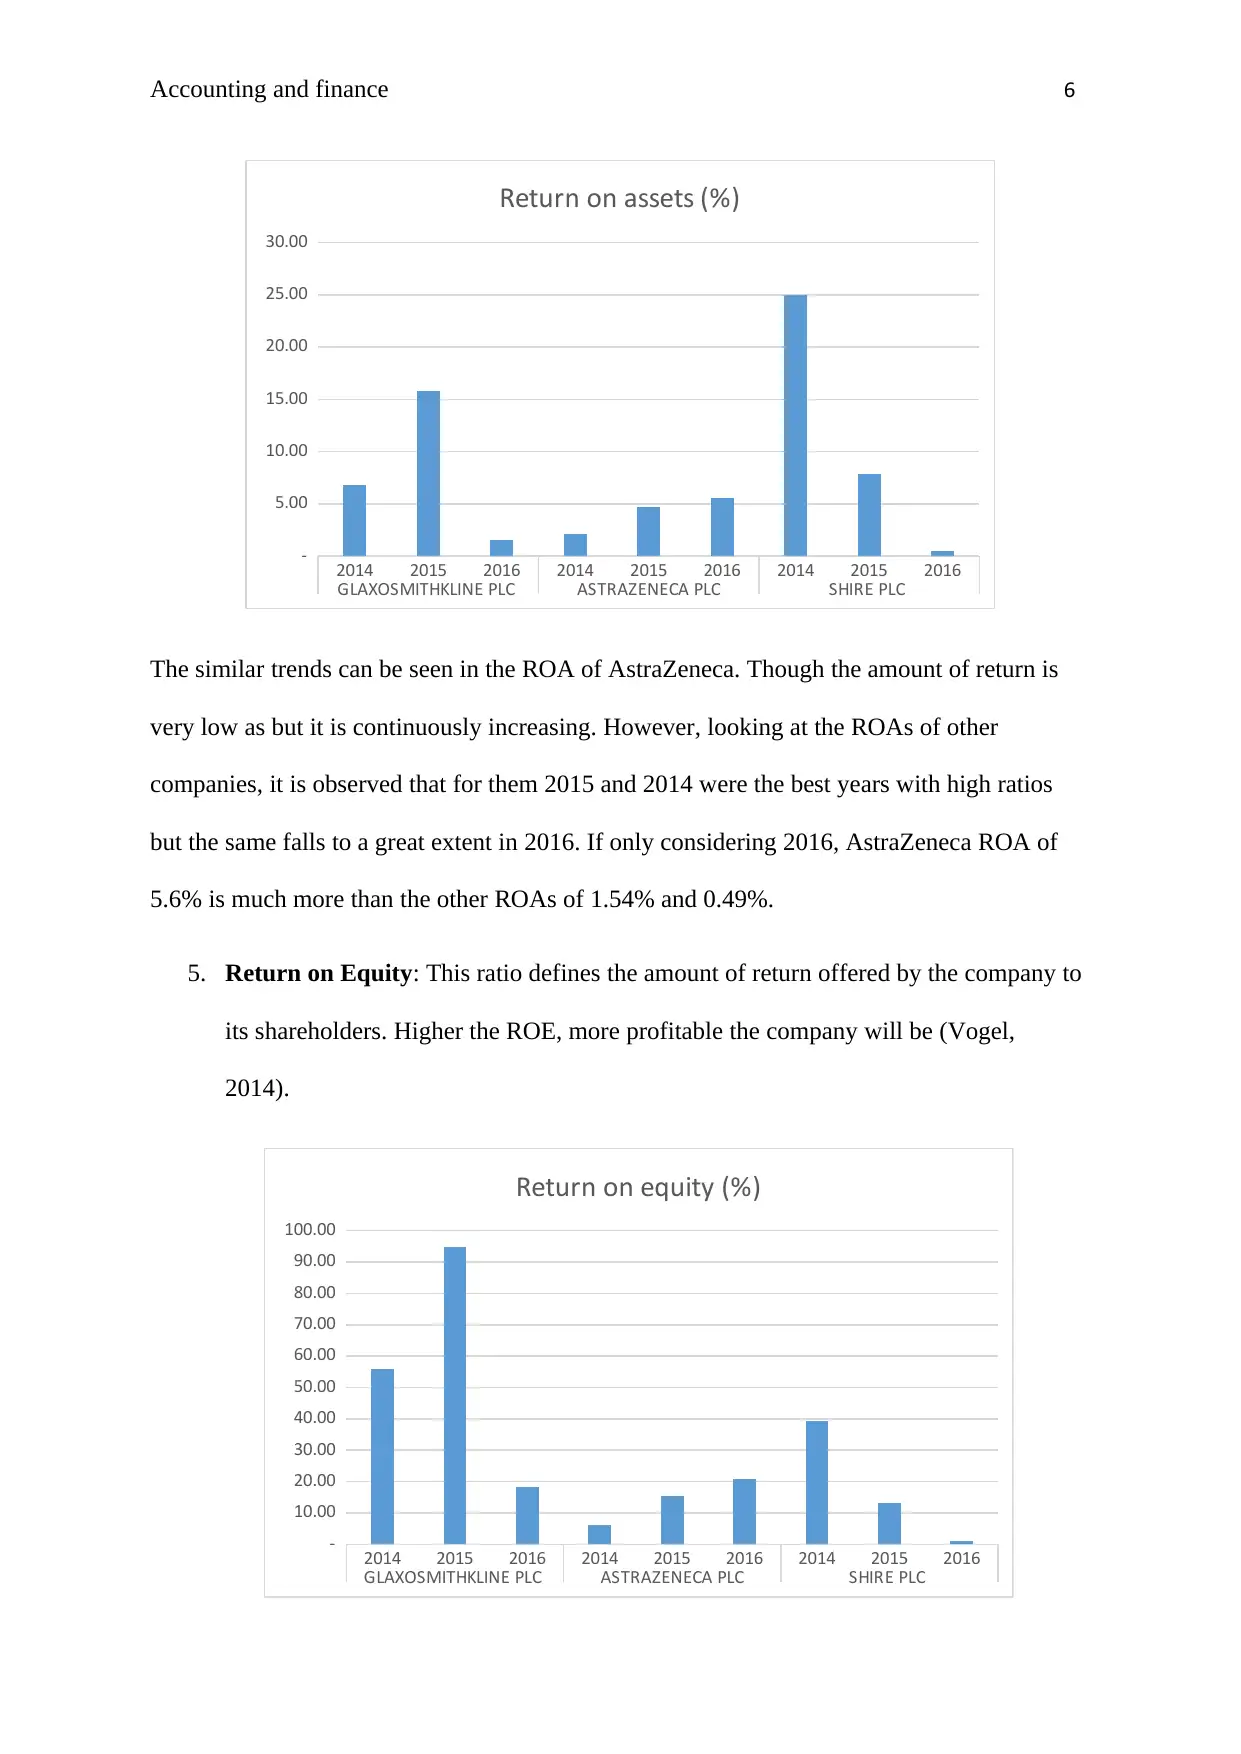
The similar trends can be seen in the ROA of AstraZeneca. Though the amount of return is
very low as but it is continuously increasing. However, looking at the ROAs of other
companies, it is observed that for them 2015 and 2014 were the best years with high ratios
but the same falls to a great extent in 2016. If only considering 2016, AstraZeneca ROA of
5.6% is much more than the other ROAs of 1.54% and 0.49%.
5. Return on Equity: This ratio defines the amount of return offered by the company to
its shareholders. Higher the ROE, more profitable the company will be (Vogel,
2014).
2014 2015 2016 2014 2015 2016 2014 2015 2016
GLAXOSMITHKLINE PLC ASTRAZENECA PLC SHIRE PLC
-
10.00
20.00
30.00
40.00
50.00
60.00
70.00
80.00
90.00
100.00
Return on equity (%)
2014 2015 2016 2014 2015 2016 2014 2015 2016
GLAXOSMITHKLINE PLC ASTRAZENECA PLC SHIRE PLC
-
5.00
10.00
15.00
20.00
25.00
30.00
Return on assets (%)
The similar trends can be seen in the ROA of AstraZeneca. Though the amount of return is
very low as but it is continuously increasing. However, looking at the ROAs of other
companies, it is observed that for them 2015 and 2014 were the best years with high ratios
but the same falls to a great extent in 2016. If only considering 2016, AstraZeneca ROA of
5.6% is much more than the other ROAs of 1.54% and 0.49%.
5. Return on Equity: This ratio defines the amount of return offered by the company to
its shareholders. Higher the ROE, more profitable the company will be (Vogel,
2014).
2014 2015 2016 2014 2015 2016 2014 2015 2016
GLAXOSMITHKLINE PLC ASTRAZENECA PLC SHIRE PLC
-
10.00
20.00
30.00
40.00
50.00
60.00
70.00
80.00
90.00
100.00
Return on equity (%)
⊘ This is a preview!⊘
Do you want full access?
Subscribe today to unlock all pages.
Trusted by 1+ million students worldwide
Accounting and finance 7
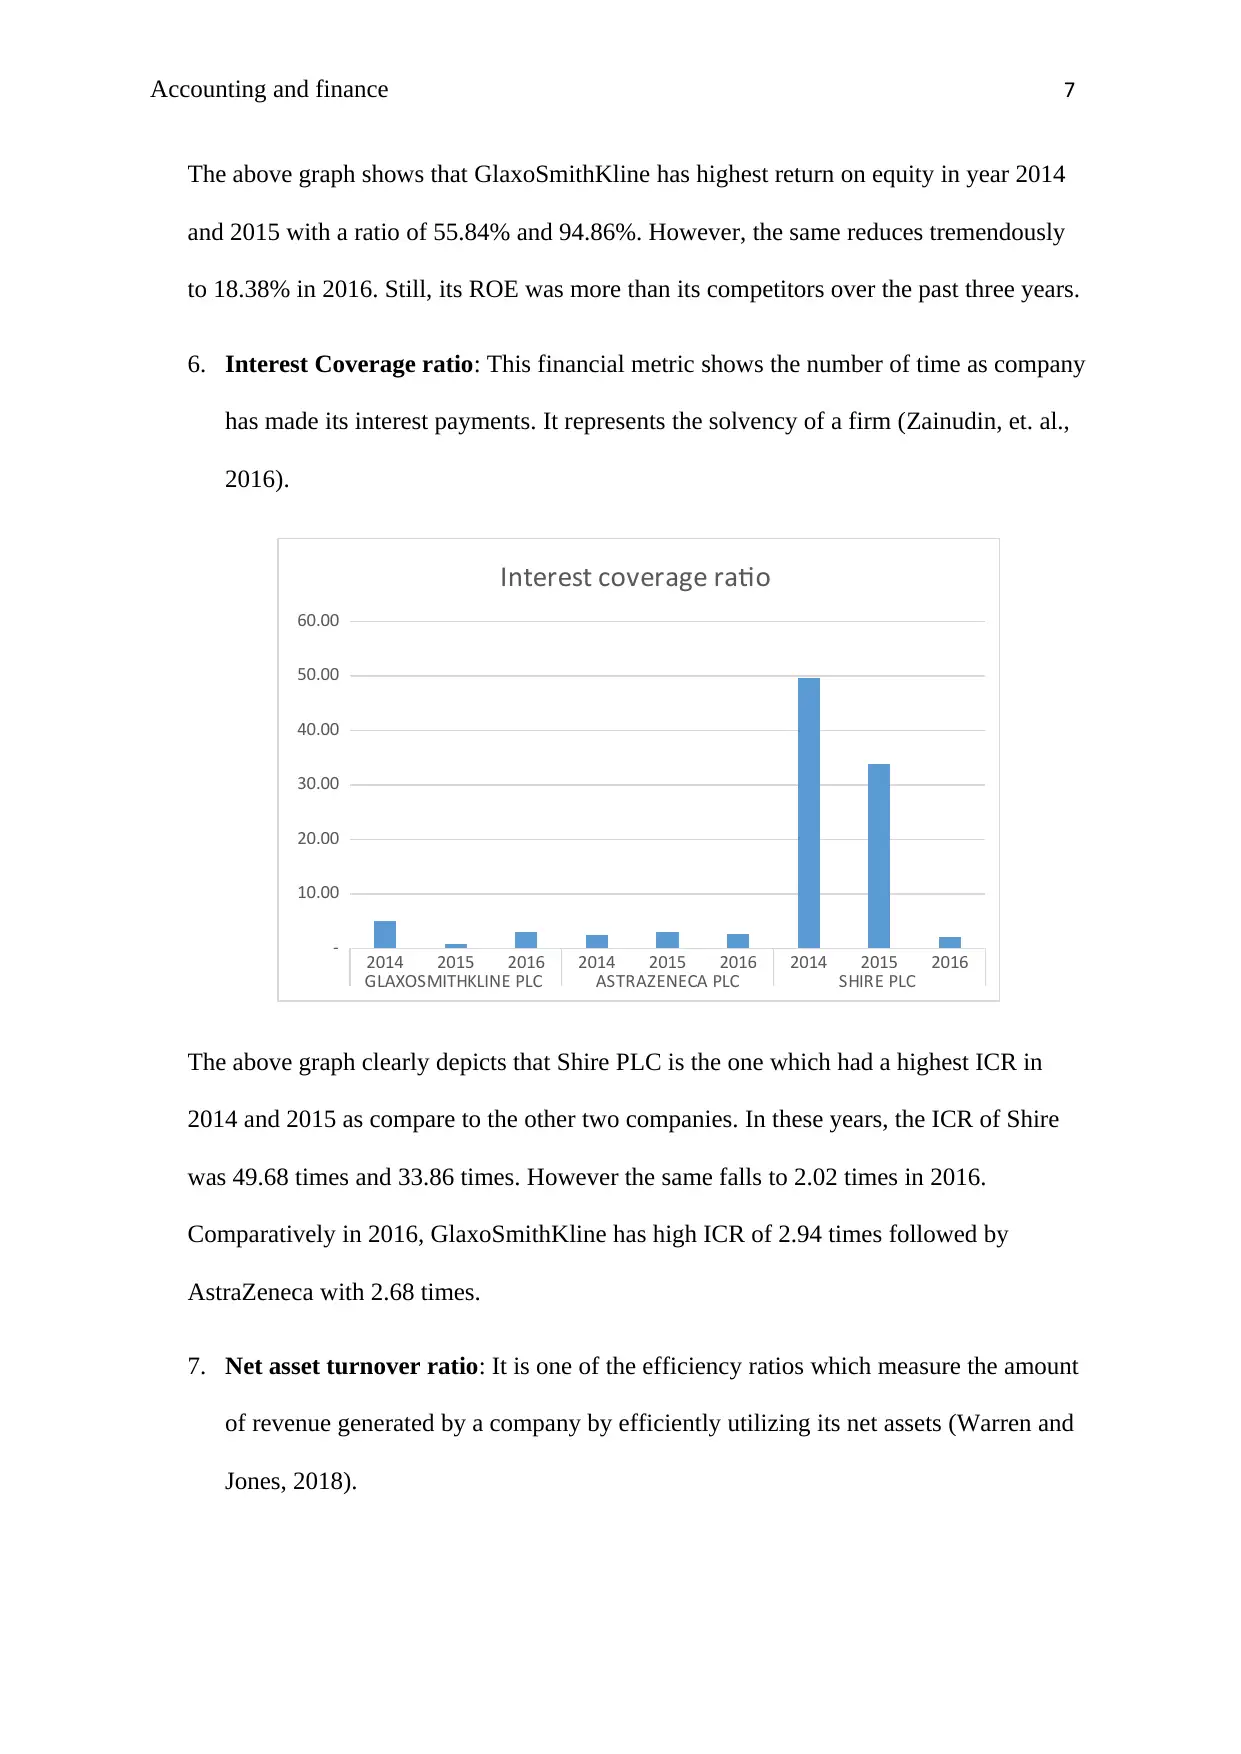
The above graph shows that GlaxoSmithKline has highest return on equity in year 2014
and 2015 with a ratio of 55.84% and 94.86%. However, the same reduces tremendously
to 18.38% in 2016. Still, its ROE was more than its competitors over the past three years.
6. Interest Coverage ratio: This financial metric shows the number of time as company
has made its interest payments. It represents the solvency of a firm (Zainudin, et. al.,
2016).
2014 2015 2016 2014 2015 2016 2014 2015 2016
GLAXOSMITHKLINE PLC ASTRAZENECA PLC SHIRE PLC
-
10.00
20.00
30.00
40.00
50.00
60.00
Interest coverage ratio
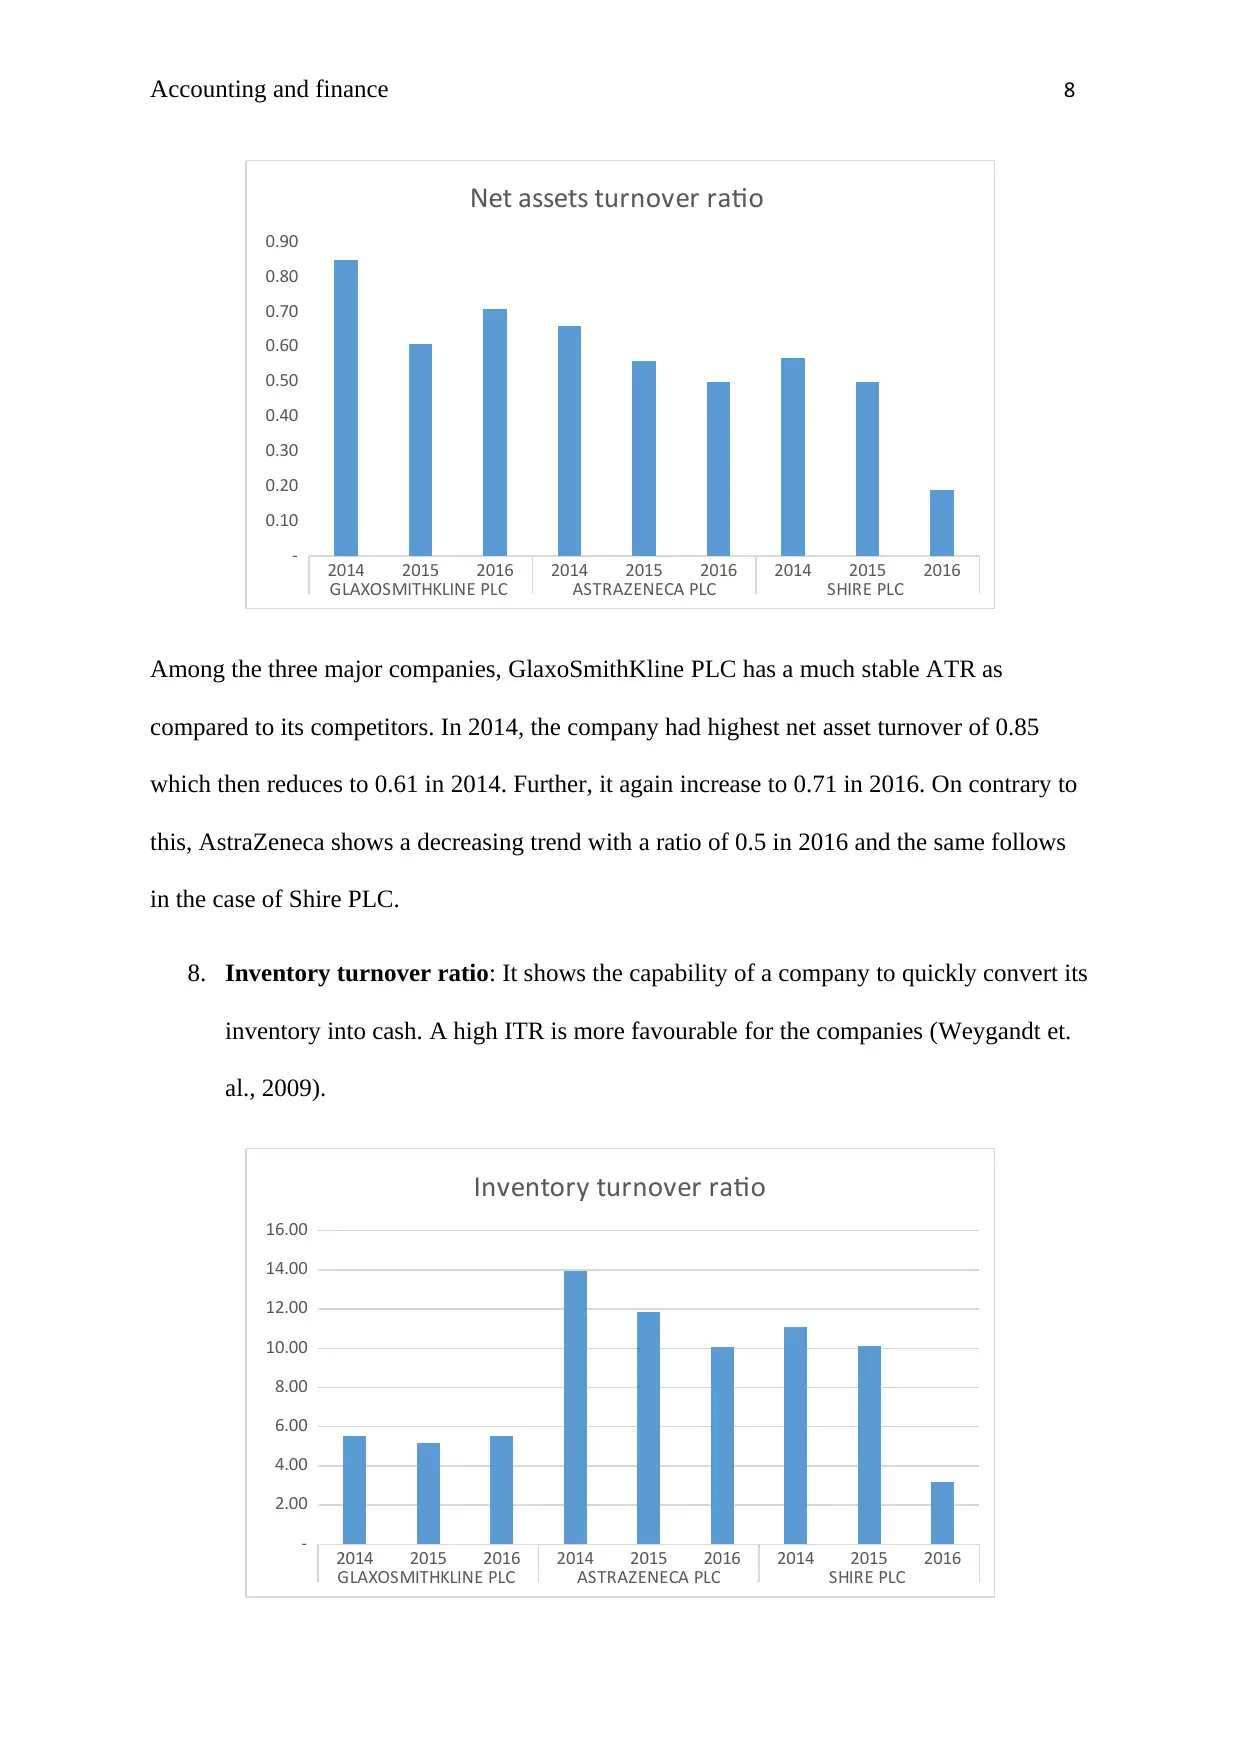
The above graph clearly depicts that Shire PLC is the one which had a highest ICR in
2014 and 2015 as compare to the other two companies. In these years, the ICR of Shire
was 49.68 times and 33.86 times. However the same falls to 2.02 times in 2016.
Comparatively in 2016, GlaxoSmithKline has high ICR of 2.94 times followed by
AstraZeneca with 2.68 times.
7. Net asset turnover ratio: It is one of the efficiency ratios which measure the amount
of revenue generated by a company by efficiently utilizing its net assets (Warren and
Jones, 2018).
The above graph shows that GlaxoSmithKline has highest return on equity in year 2014
and 2015 with a ratio of 55.84% and 94.86%. However, the same reduces tremendously
to 18.38% in 2016. Still, its ROE was more than its competitors over the past three years.
6. Interest Coverage ratio: This financial metric shows the number of time as company
has made its interest payments. It represents the solvency of a firm (Zainudin, et. al.,
2016).
2014 2015 2016 2014 2015 2016 2014 2015 2016
GLAXOSMITHKLINE PLC ASTRAZENECA PLC SHIRE PLC
-
10.00
20.00
30.00
40.00
50.00
60.00
Interest coverage ratio
The above graph clearly depicts that Shire PLC is the one which had a highest ICR in
2014 and 2015 as compare to the other two companies. In these years, the ICR of Shire
was 49.68 times and 33.86 times. However the same falls to 2.02 times in 2016.
Comparatively in 2016, GlaxoSmithKline has high ICR of 2.94 times followed by
AstraZeneca with 2.68 times.
7. Net asset turnover ratio: It is one of the efficiency ratios which measure the amount
of revenue generated by a company by efficiently utilizing its net assets (Warren and
Jones, 2018).
Paraphrase This Document
Need a fresh take? Get an instant paraphrase of this document with our AI Paraphraser
Accounting and finance 8
2014 2015 2016 2014 2015 2016 2014 2015 2016
GLAXOSMITHKLINE PLC ASTRAZENECA PLC SHIRE PLC
-
0.10
0.20
0.30
0.40
0.50
0.60
0.70
0.80
0.90
Net assets turnover ratio
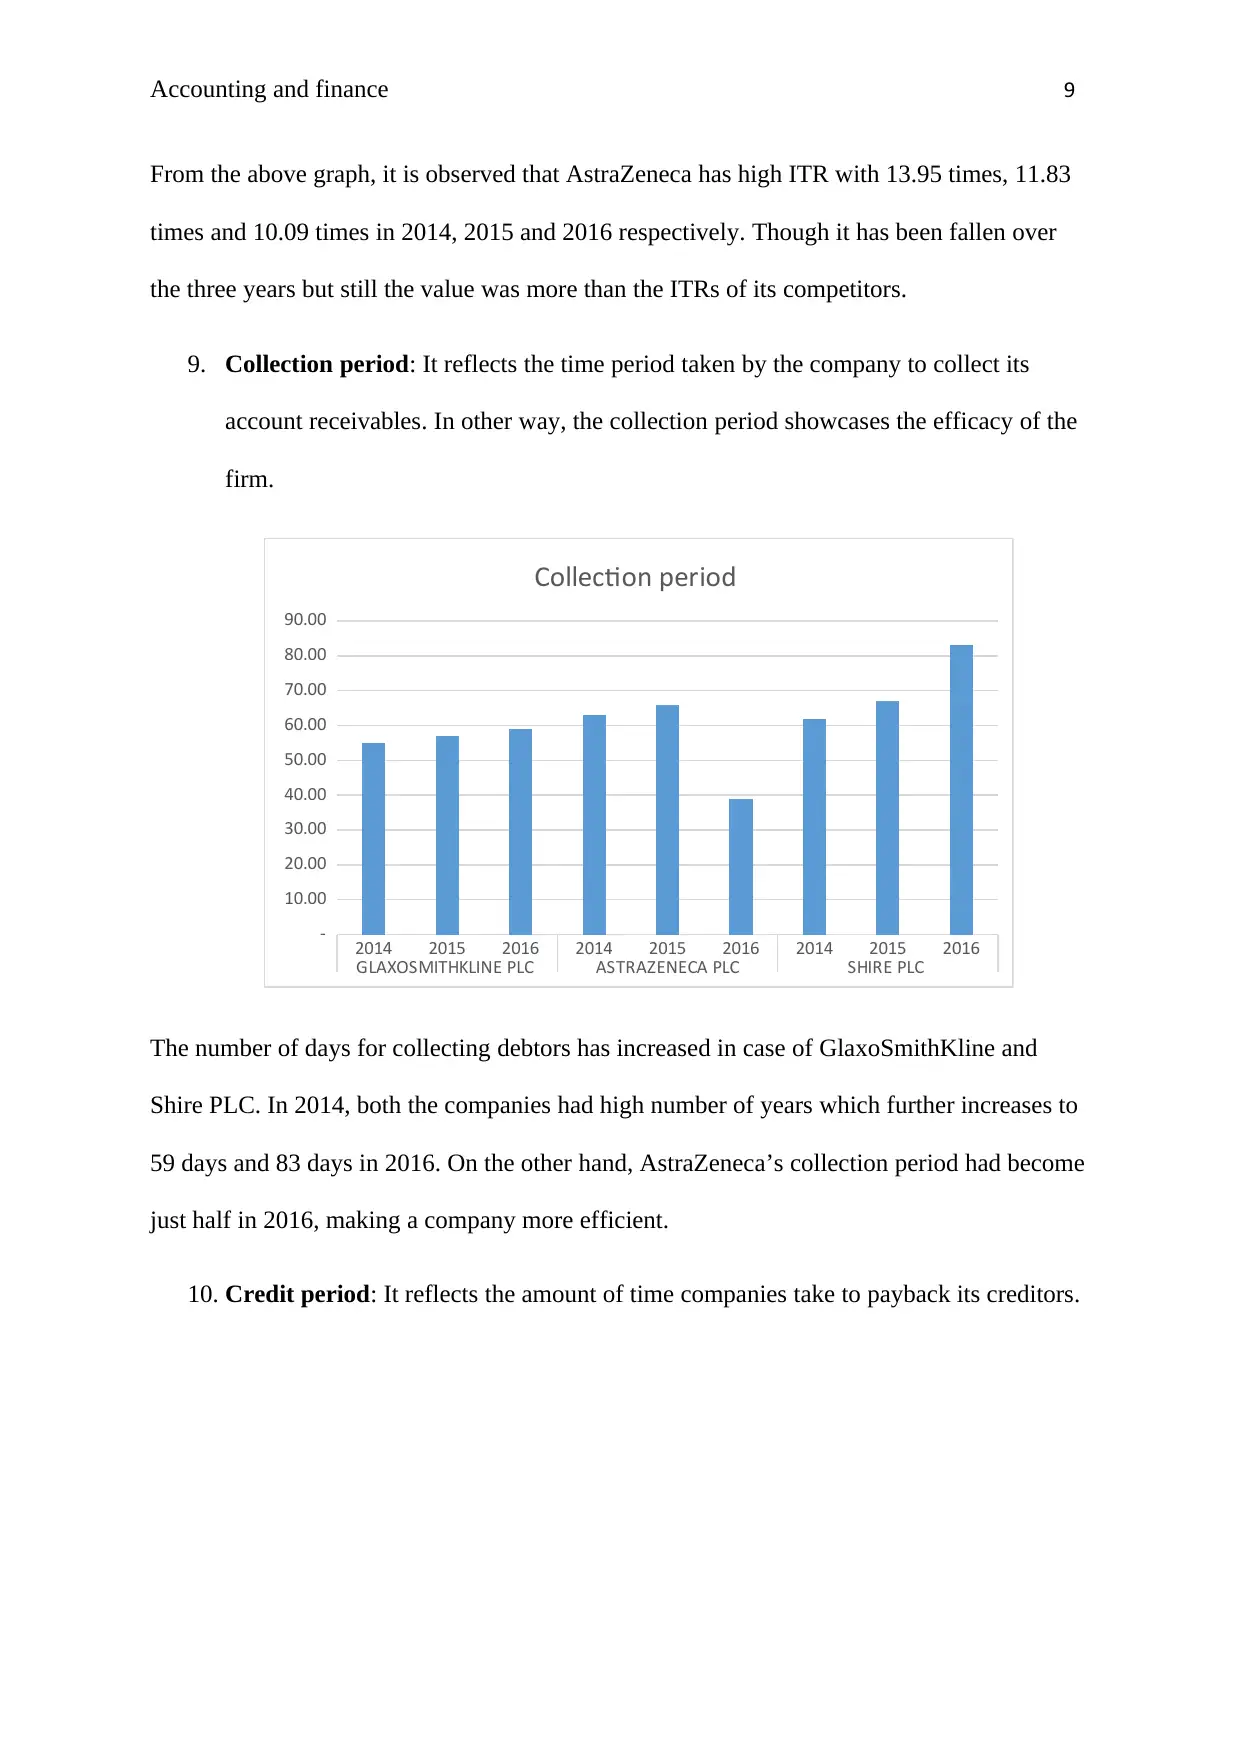
Among the three major companies, GlaxoSmithKline PLC has a much stable ATR as
compared to its competitors. In 2014, the company had highest net asset turnover of 0.85
which then reduces to 0.61 in 2014. Further, it again increase to 0.71 in 2016. On contrary to
this, AstraZeneca shows a decreasing trend with a ratio of 0.5 in 2016 and the same follows
in the case of Shire PLC.
8. Inventory turnover ratio: It shows the capability of a company to quickly convert its
inventory into cash. A high ITR is more favourable for the companies (Weygandt et.
al., 2009).
2014 2015 2016 2014 2015 2016 2014 2015 2016
GLAXOSMITHKLINE PLC ASTRAZENECA PLC SHIRE PLC
-
2.00
4.00
6.00
8.00
10.00
12.00
14.00
16.00
Inventory turnover ratio
2014 2015 2016 2014 2015 2016 2014 2015 2016
GLAXOSMITHKLINE PLC ASTRAZENECA PLC SHIRE PLC
-
0.10
0.20
0.30
0.40
0.50
0.60
0.70
0.80
0.90
Net assets turnover ratio
Among the three major companies, GlaxoSmithKline PLC has a much stable ATR as
compared to its competitors. In 2014, the company had highest net asset turnover of 0.85
which then reduces to 0.61 in 2014. Further, it again increase to 0.71 in 2016. On contrary to
this, AstraZeneca shows a decreasing trend with a ratio of 0.5 in 2016 and the same follows
in the case of Shire PLC.
8. Inventory turnover ratio: It shows the capability of a company to quickly convert its
inventory into cash. A high ITR is more favourable for the companies (Weygandt et.
al., 2009).
2014 2015 2016 2014 2015 2016 2014 2015 2016
GLAXOSMITHKLINE PLC ASTRAZENECA PLC SHIRE PLC
-
2.00
4.00
6.00
8.00
10.00
12.00
14.00
16.00
Inventory turnover ratio
Accounting and finance 9
From the above graph, it is observed that AstraZeneca has high ITR with 13.95 times, 11.83
times and 10.09 times in 2014, 2015 and 2016 respectively. Though it has been fallen over
the three years but still the value was more than the ITRs of its competitors.
9. Collection period: It reflects the time period taken by the company to collect its
account receivables. In other way, the collection period showcases the efficacy of the
firm.
2014 2015 2016 2014 2015 2016 2014 2015 2016
GLAXOSMITHKLINE PLC ASTRAZENECA PLC SHIRE PLC
-
10.00
20.00
30.00
40.00
50.00
60.00
70.00
80.00
90.00
Collection period
The number of days for collecting debtors has increased in case of GlaxoSmithKline and
Shire PLC. In 2014, both the companies had high number of years which further increases to
59 days and 83 days in 2016. On the other hand, AstraZeneca’s collection period had become
just half in 2016, making a company more efficient.
10. Credit period: It reflects the amount of time companies take to payback its creditors.
⊘ This is a preview!⊘
Do you want full access?
Subscribe today to unlock all pages.
Trusted by 1+ million students worldwide
Accounting and finance 10
2014 2015 2016 2014 2015 2016 2014 2015 2016
GLAXOSMITHKLINE PLC ASTRAZENECA PLC SHIRE PLC
-
10.00
20.00
30.00
40.00
50.00
60.00
Credit period
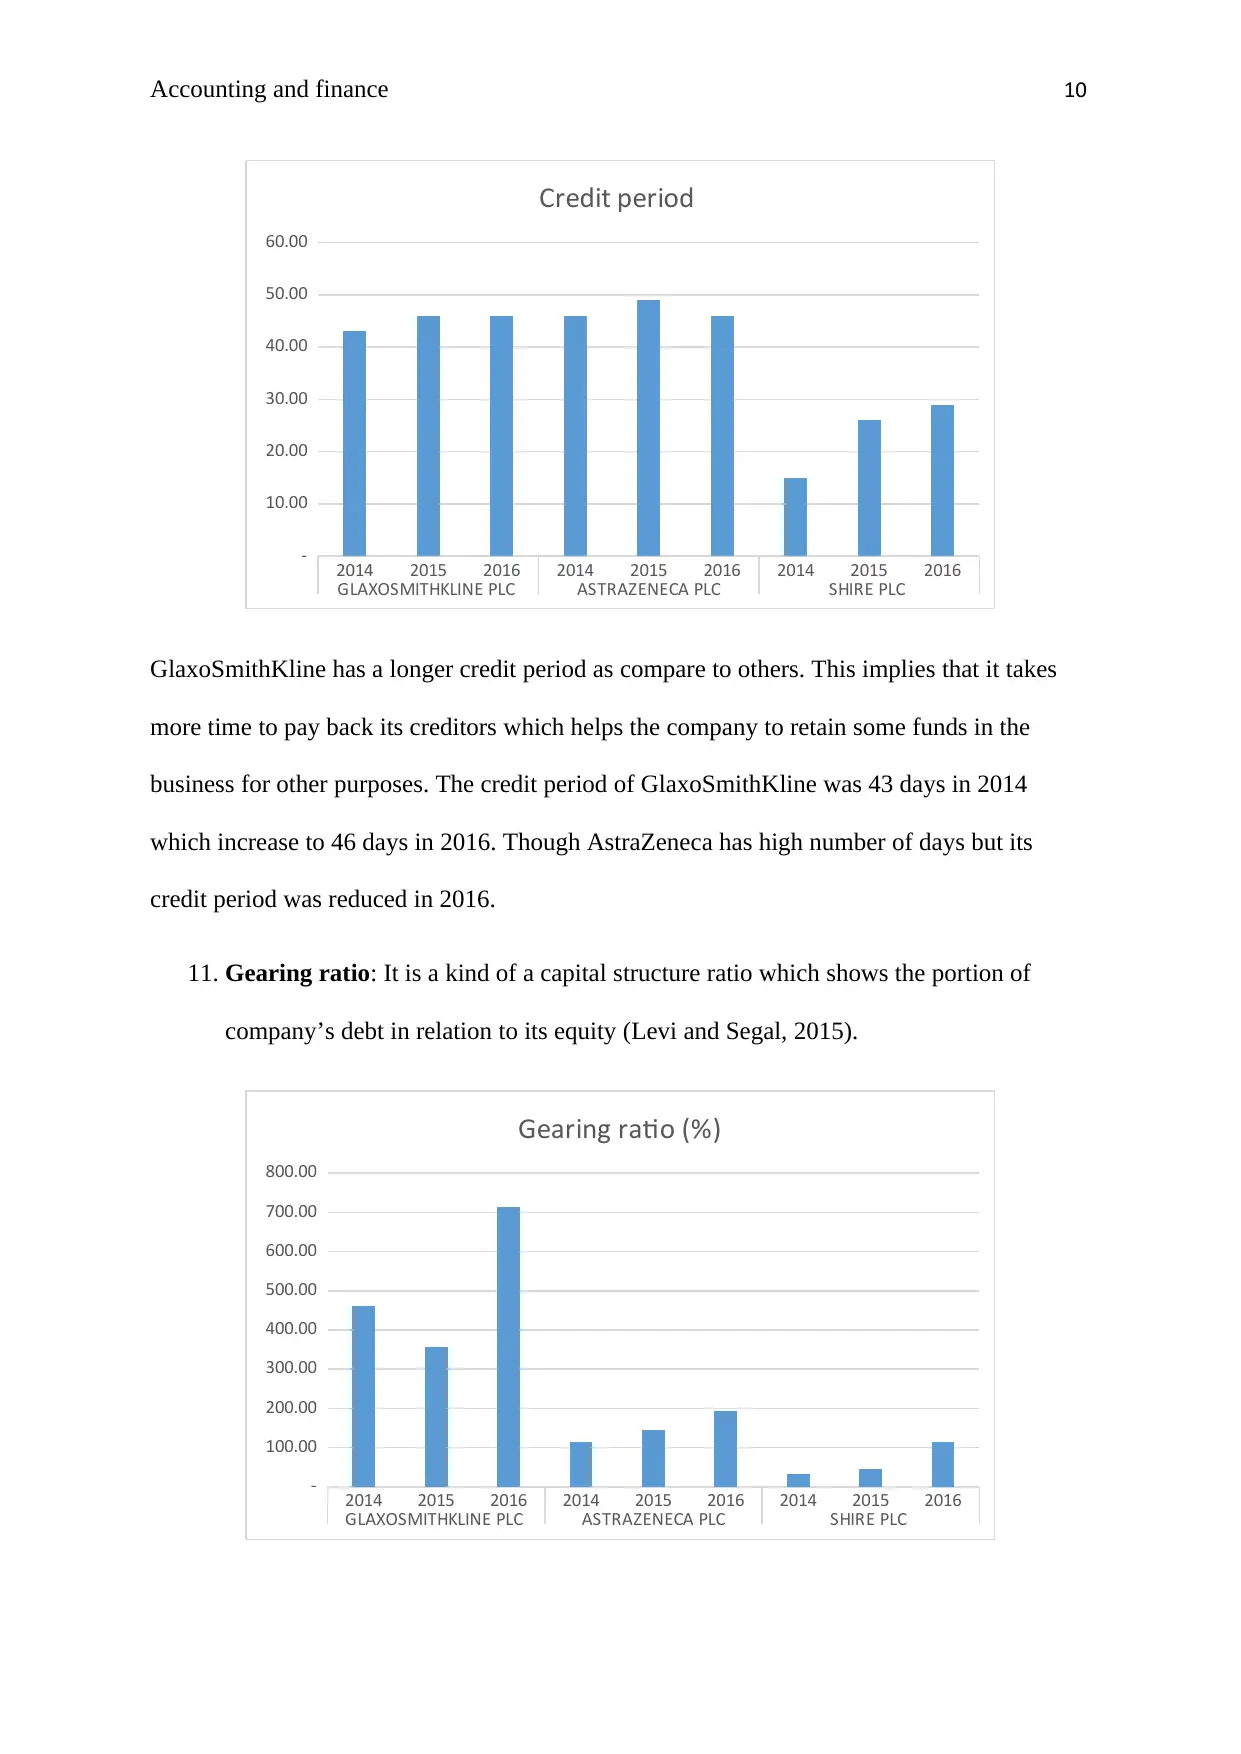
GlaxoSmithKline has a longer credit period as compare to others. This implies that it takes
more time to pay back its creditors which helps the company to retain some funds in the
business for other purposes. The credit period of GlaxoSmithKline was 43 days in 2014
which increase to 46 days in 2016. Though AstraZeneca has high number of days but its
credit period was reduced in 2016.
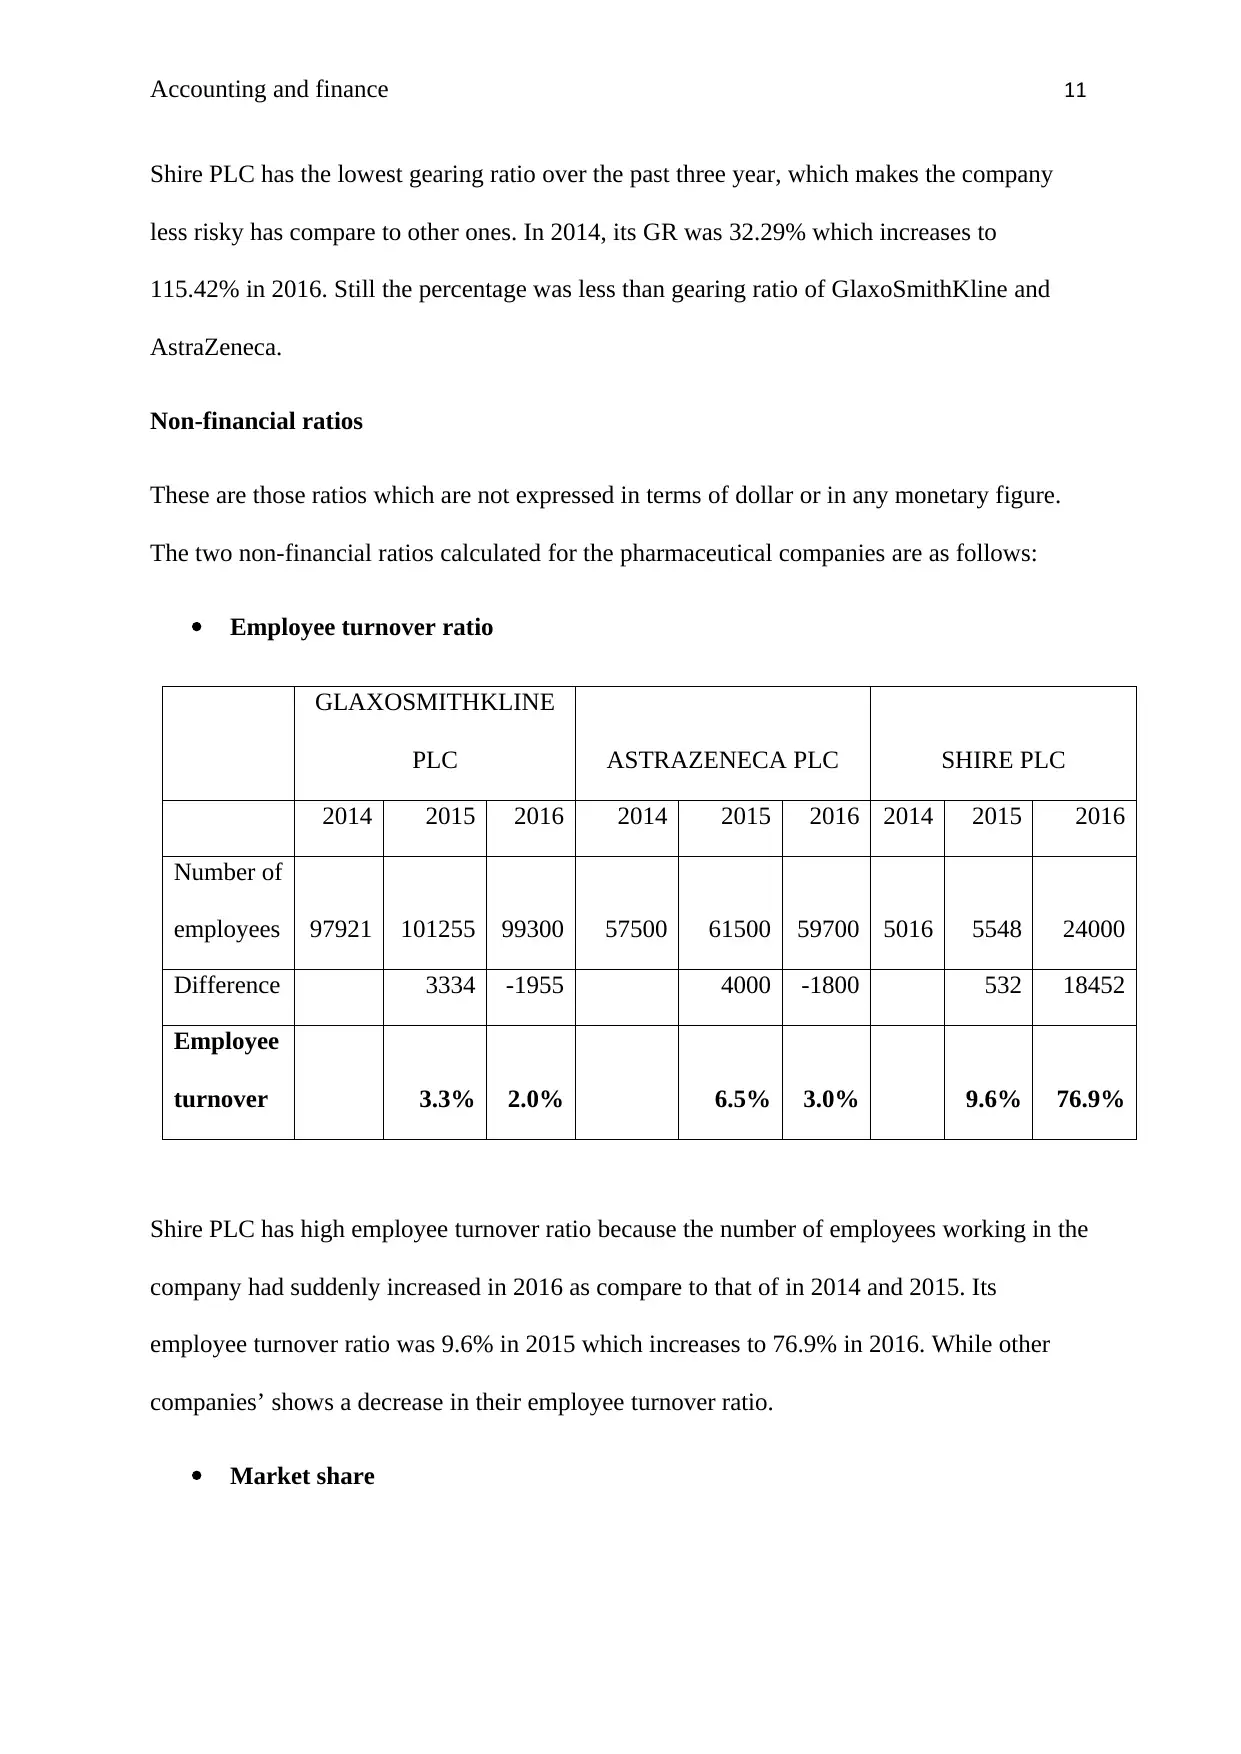
11. Gearing ratio: It is a kind of a capital structure ratio which shows the portion of
company’s debt in relation to its equity (Levi and Segal, 2015).
2014 2015 2016 2014 2015 2016 2014 2015 2016
GLAXOSMITHKLINE PLC ASTRAZENECA PLC SHIRE PLC
-
100.00
200.00
300.00
400.00
500.00
600.00
700.00
800.00
Gearing ratio (%)
2014 2015 2016 2014 2015 2016 2014 2015 2016
GLAXOSMITHKLINE PLC ASTRAZENECA PLC SHIRE PLC
-
10.00
20.00
30.00
40.00
50.00
60.00
Credit period
GlaxoSmithKline has a longer credit period as compare to others. This implies that it takes
more time to pay back its creditors which helps the company to retain some funds in the
business for other purposes. The credit period of GlaxoSmithKline was 43 days in 2014
which increase to 46 days in 2016. Though AstraZeneca has high number of days but its
credit period was reduced in 2016.
11. Gearing ratio: It is a kind of a capital structure ratio which shows the portion of
company’s debt in relation to its equity (Levi and Segal, 2015).
2014 2015 2016 2014 2015 2016 2014 2015 2016
GLAXOSMITHKLINE PLC ASTRAZENECA PLC SHIRE PLC
-
100.00
200.00
300.00
400.00
500.00
600.00
700.00
800.00
Gearing ratio (%)
Paraphrase This Document
Need a fresh take? Get an instant paraphrase of this document with our AI Paraphraser
Accounting and finance 11
Shire PLC has the lowest gearing ratio over the past three year, which makes the company
less risky has compare to other ones. In 2014, its GR was 32.29% which increases to
115.42% in 2016. Still the percentage was less than gearing ratio of GlaxoSmithKline and
AstraZeneca.
Non-financial ratios
These are those ratios which are not expressed in terms of dollar or in any monetary figure.
The two non-financial ratios calculated for the pharmaceutical companies are as follows:
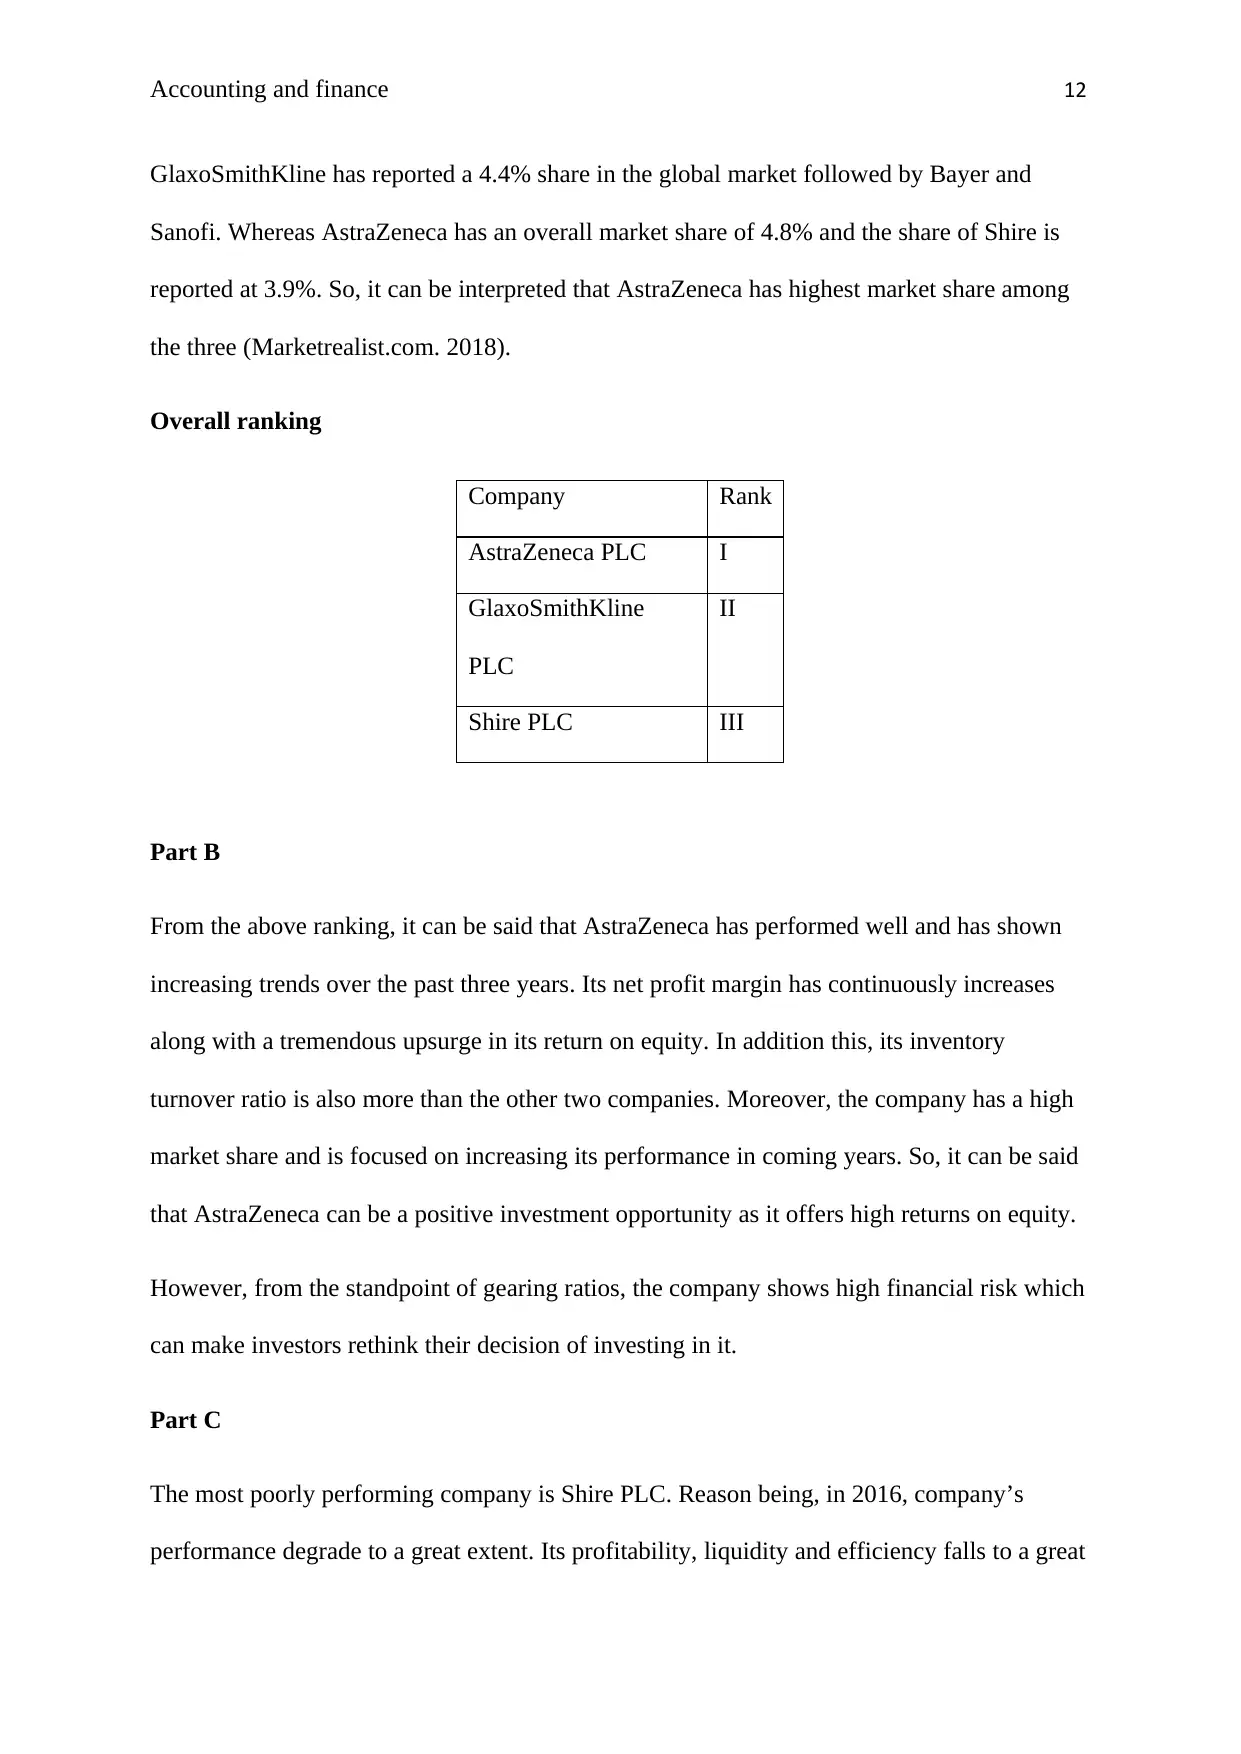
Employee turnover ratio
GLAXOSMITHKLINE
PLC ASTRAZENECA PLC SHIRE PLC
2014 2015 2016 2014 2015 2016 2014 2015 2016
Number of
employees 97921 101255 99300 57500 61500 59700 5016 5548 24000
Difference 3334 -1955 4000 -1800 532 18452
Employee
turnover 3.3% 2.0% 6.5% 3.0% 9.6% 76.9%
Shire PLC has high employee turnover ratio because the number of employees working in the
company had suddenly increased in 2016 as compare to that of in 2014 and 2015. Its
employee turnover ratio was 9.6% in 2015 which increases to 76.9% in 2016. While other
companies’ shows a decrease in their employee turnover ratio.
Market share
Shire PLC has the lowest gearing ratio over the past three year, which makes the company
less risky has compare to other ones. In 2014, its GR was 32.29% which increases to
115.42% in 2016. Still the percentage was less than gearing ratio of GlaxoSmithKline and
AstraZeneca.
Non-financial ratios
These are those ratios which are not expressed in terms of dollar or in any monetary figure.
The two non-financial ratios calculated for the pharmaceutical companies are as follows:
Employee turnover ratio
GLAXOSMITHKLINE
PLC ASTRAZENECA PLC SHIRE PLC
2014 2015 2016 2014 2015 2016 2014 2015 2016
Number of
employees 97921 101255 99300 57500 61500 59700 5016 5548 24000
Difference 3334 -1955 4000 -1800 532 18452
Employee
turnover 3.3% 2.0% 6.5% 3.0% 9.6% 76.9%
Shire PLC has high employee turnover ratio because the number of employees working in the
company had suddenly increased in 2016 as compare to that of in 2014 and 2015. Its
employee turnover ratio was 9.6% in 2015 which increases to 76.9% in 2016. While other
companies’ shows a decrease in their employee turnover ratio.
Market share
Accounting and finance 12
GlaxoSmithKline has reported a 4.4% share in the global market followed by Bayer and
Sanofi. Whereas AstraZeneca has an overall market share of 4.8% and the share of Shire is
reported at 3.9%. So, it can be interpreted that AstraZeneca has highest market share among
the three (Marketrealist.com. 2018).
Overall ranking
Company Rank
AstraZeneca PLC I
GlaxoSmithKline
PLC
II
Shire PLC III
Part B
From the above ranking, it can be said that AstraZeneca has performed well and has shown
increasing trends over the past three years. Its net profit margin has continuously increases
along with a tremendous upsurge in its return on equity. In addition this, its inventory
turnover ratio is also more than the other two companies. Moreover, the company has a high
market share and is focused on increasing its performance in coming years. So, it can be said
that AstraZeneca can be a positive investment opportunity as it offers high returns on equity.
However, from the standpoint of gearing ratios, the company shows high financial risk which
can make investors rethink their decision of investing in it.
Part C
The most poorly performing company is Shire PLC. Reason being, in 2016, company’s
performance degrade to a great extent. Its profitability, liquidity and efficiency falls to a great
⊘ This is a preview!⊘
Do you want full access?
Subscribe today to unlock all pages.
Trusted by 1+ million students worldwide
1 out of 19


Your All-in-One AI-Powered Toolkit for Academic Success.
+13062052269
info@desklib.com
Available 24*7 on WhatsApp / Email
![[object Object]](/_next/static/media/star-bottom.7253800d.svg)
Unlock your academic potential
Copyright © 2020–2026 A2Z Services. All Rights Reserved. Developed and managed by ZUCOL.