Comparative Financial Ratio Analysis of Oman and Oredo Telecom
VerifiedAdded on 2021/05/30
|16
|2851
|93
Report
AI Summary
This report provides a detailed comparative financial analysis of Oman Telecommunication and Oredo Telecommunication, examining their performance across two financial years, 2016 and 2017. The analysis utilizes twelve key financial ratios, including current ratio, quick ratio, receivables turnover, asset turnover, and profitability ratios like net profit margin and earnings per share, along with debt and leverage ratios. The report calculates and interprets these ratios for both companies, offering insights into their liquidity, efficiency, profitability, and solvency. The conclusion summarizes the findings, highlighting the relative strengths and weaknesses of each company based on the calculated financial metrics. This comprehensive analysis is crucial for understanding the financial health and performance trends of these telecommunication companies.

FINANCE 1
SUMMARY
This report analyse performance of the two companies using ratio analysis. The two
companies are “Oman Telecommunication” and “Oredo Telecommunication”. In this report,
twelve financial ratios are calculated considering two financial years 2017 and 2016. Further
this report ends with conclusion of the outcome.
Paraphrase This Document
Need a fresh take? Get an instant paraphrase of this document with our AI Paraphraser
FINANCE 2
Contents
RATIO ANALYSIS....................................................................................................................................3
1. Current ratios.............................................................................................................................3
2. Quick ratios................................................................................................................................4
3. Receivables turnover ratios.......................................................................................................5
4. Asset turnover ratios.................................................................................................................6
5. Fixed Asset turnover ratios........................................................................................................7
6. Net profit margin.......................................................................................................................8
7. Earnings per share.....................................................................................................................9
8. Debt to asset ratio...................................................................................................................10
9. Debt to equity ratio.................................................................................................................11
10. Interest coverage ratios.......................................................................................................12
11. Return on Equity (ROE)........................................................................................................13
12. Return on Investment (ROI).................................................................................................14
REFERENCES........................................................................................................................................16
FINANCE 3
RATIO ANALYSIS
Calculation of 12 financial ratios of Oman Telecommunication and Oredo
Telecommunication of 2017 and 2016 are as follows:
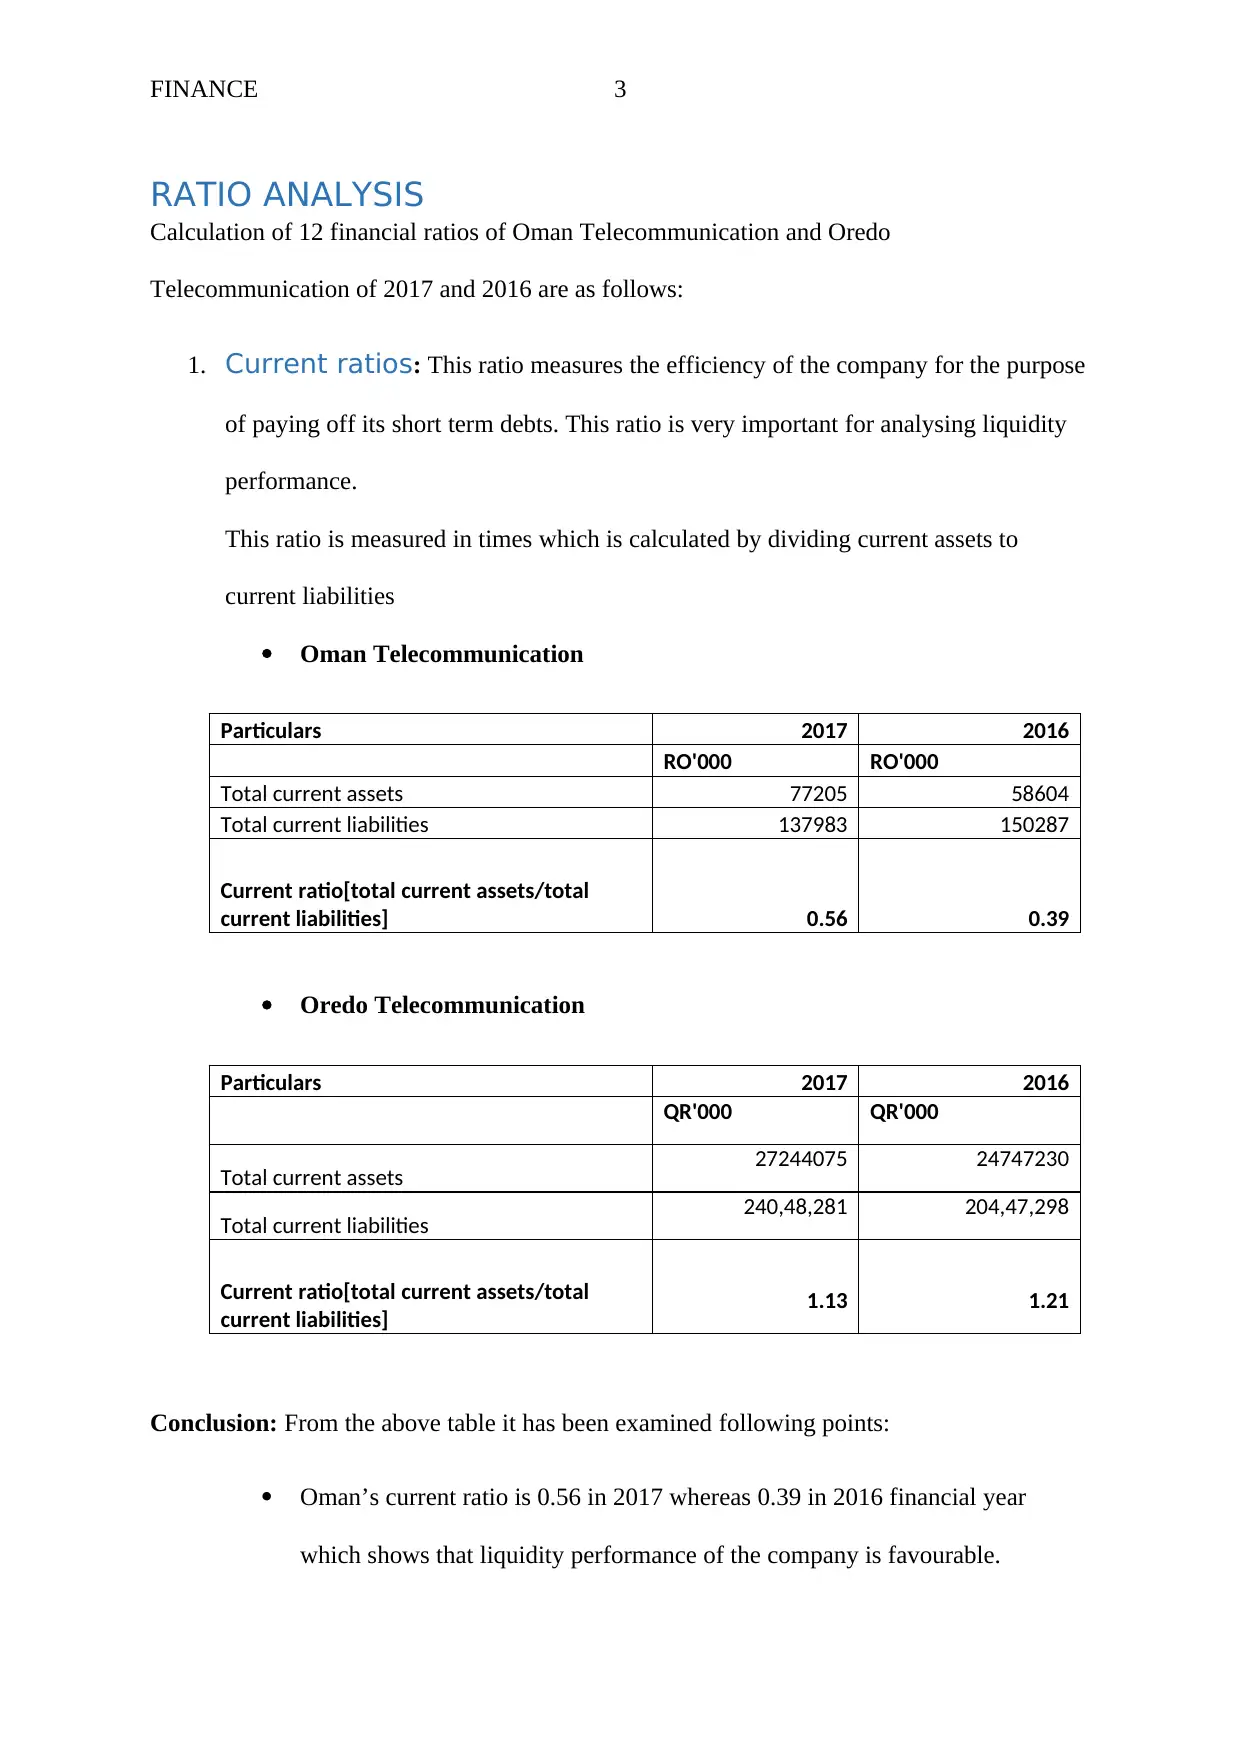
1. Current ratios: This ratio measures the efficiency of the company for the purpose
of paying off its short term debts. This ratio is very important for analysing liquidity
performance.
This ratio is measured in times which is calculated by dividing current assets to
current liabilities
Oman Telecommunication
Particulars 2017 2016
RO'000 RO'000
Total current assets 77205 58604
Total current liabilities 137983 150287
Current ratio[total current assets/total
current liabilities] 0.56 0.39
Oredo Telecommunication
Particulars 2017 2016
QR'000 QR'000
Total current assets 27244075 24747230
Total current liabilities 240,48,281 204,47,298
Current ratio[total current assets/total
current liabilities] 1.13 1.21
Conclusion: From the above table it has been examined following points:
Oman’s current ratio is 0.56 in 2017 whereas 0.39 in 2016 financial year
which shows that liquidity performance of the company is favourable.
RATIO ANALYSIS
Calculation of 12 financial ratios of Oman Telecommunication and Oredo
Telecommunication of 2017 and 2016 are as follows:
1. Current ratios: This ratio measures the efficiency of the company for the purpose
of paying off its short term debts. This ratio is very important for analysing liquidity
performance.
This ratio is measured in times which is calculated by dividing current assets to
current liabilities
Oman Telecommunication
Particulars 2017 2016
RO'000 RO'000
Total current assets 77205 58604
Total current liabilities 137983 150287
Current ratio[total current assets/total
current liabilities] 0.56 0.39
Oredo Telecommunication
Particulars 2017 2016
QR'000 QR'000
Total current assets 27244075 24747230
Total current liabilities 240,48,281 204,47,298
Current ratio[total current assets/total
current liabilities] 1.13 1.21
Conclusion: From the above table it has been examined following points:
Oman’s current ratio is 0.56 in 2017 whereas 0.39 in 2016 financial year
which shows that liquidity performance of the company is favourable.
⊘ This is a preview!⊘
Do you want full access?
Subscribe today to unlock all pages.
Trusted by 1+ million students worldwide
FINANCE 4
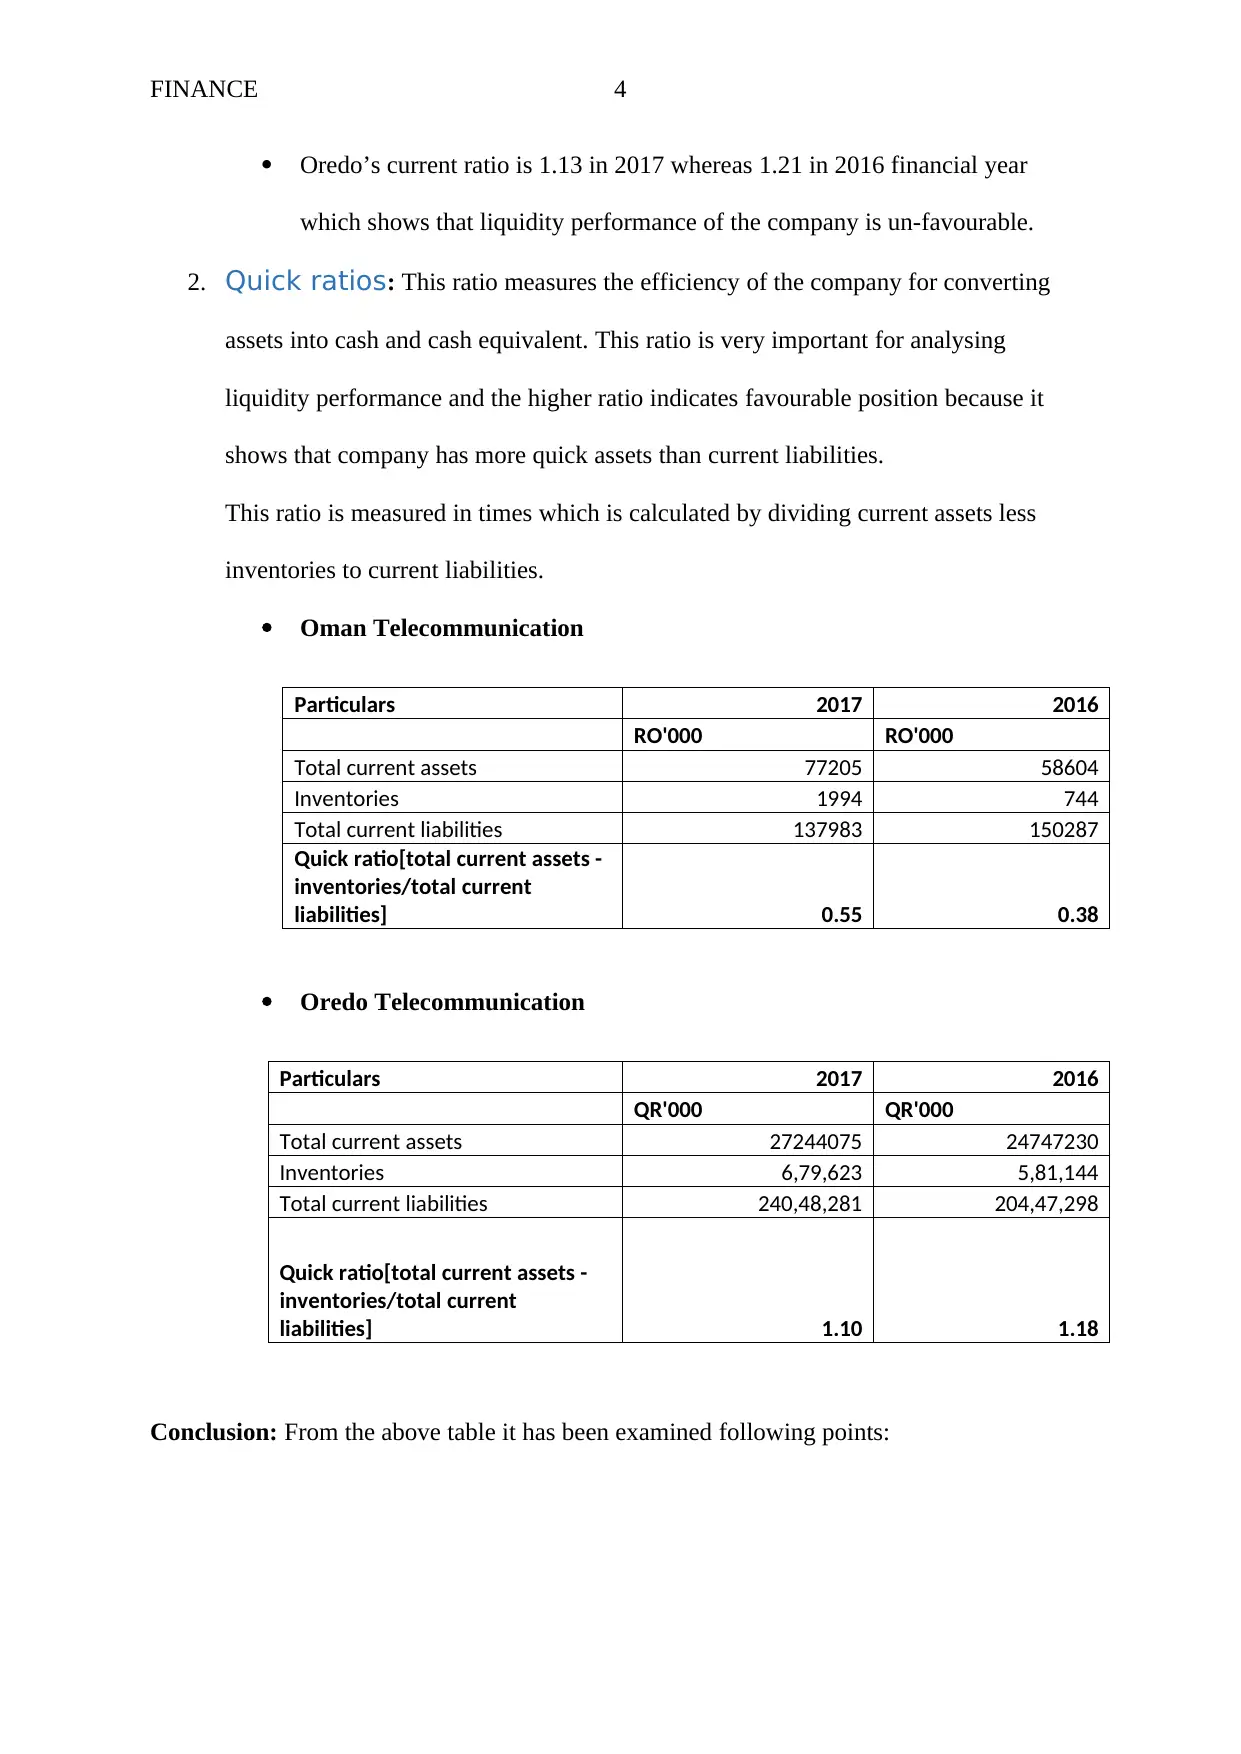
Oredo’s current ratio is 1.13 in 2017 whereas 1.21 in 2016 financial year
which shows that liquidity performance of the company is un-favourable.
2. Quick ratios: This ratio measures the efficiency of the company for converting
assets into cash and cash equivalent. This ratio is very important for analysing
liquidity performance and the higher ratio indicates favourable position because it
shows that company has more quick assets than current liabilities.
This ratio is measured in times which is calculated by dividing current assets less
inventories to current liabilities.
Oman Telecommunication
Particulars 2017 2016
RO'000 RO'000
Total current assets 77205 58604
Inventories 1994 744
Total current liabilities 137983 150287
Quick ratio[total current assets -
inventories/total current
liabilities] 0.55 0.38
Oredo Telecommunication
Particulars 2017 2016
QR'000 QR'000
Total current assets 27244075 24747230
Inventories 6,79,623 5,81,144
Total current liabilities 240,48,281 204,47,298
Quick ratio[total current assets -
inventories/total current
liabilities] 1.10 1.18
Conclusion: From the above table it has been examined following points:
Paraphrase This Document
Need a fresh take? Get an instant paraphrase of this document with our AI Paraphraser
FINANCE 5
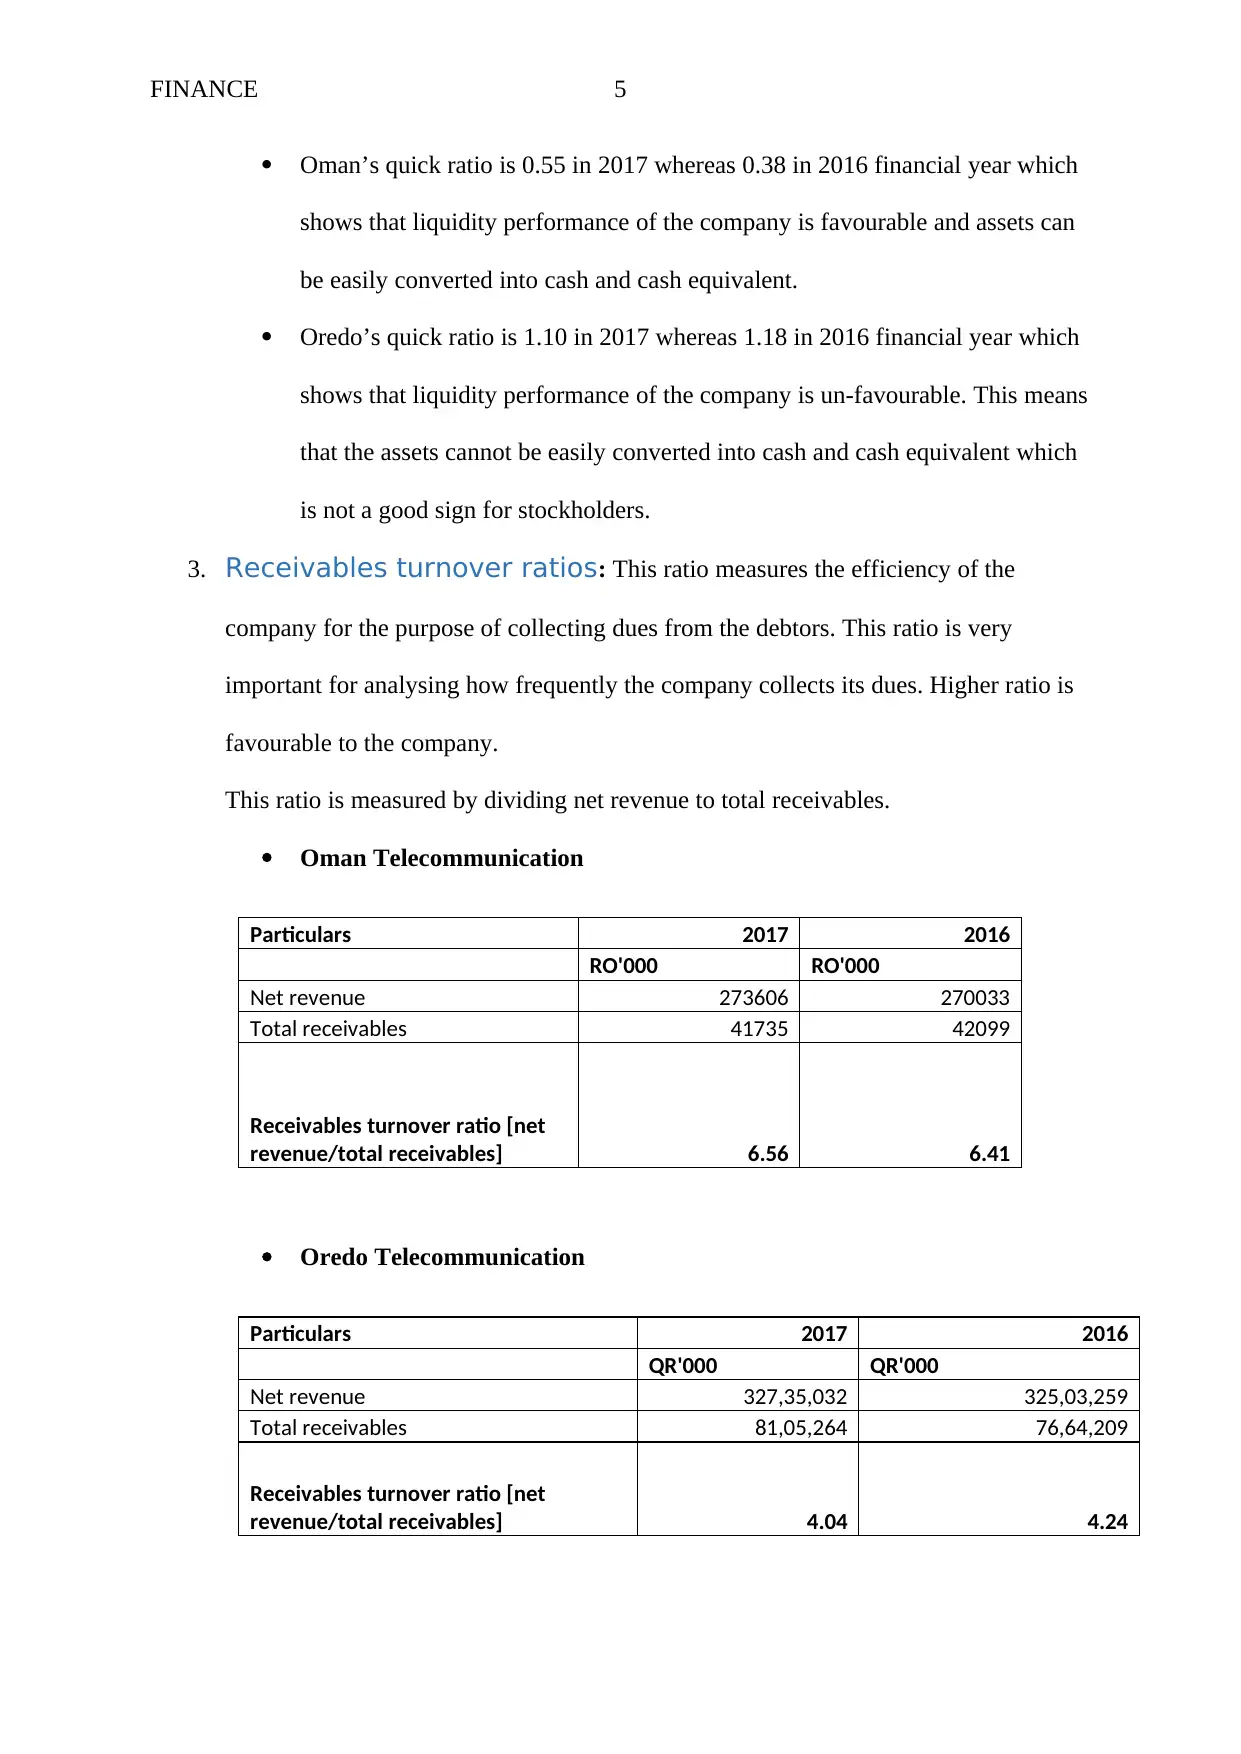
Oman’s quick ratio is 0.55 in 2017 whereas 0.38 in 2016 financial year which
shows that liquidity performance of the company is favourable and assets can
be easily converted into cash and cash equivalent.
Oredo’s quick ratio is 1.10 in 2017 whereas 1.18 in 2016 financial year which
shows that liquidity performance of the company is un-favourable. This means
that the assets cannot be easily converted into cash and cash equivalent which
is not a good sign for stockholders.
3. Receivables turnover ratios: This ratio measures the efficiency of the
company for the purpose of collecting dues from the debtors. This ratio is very
important for analysing how frequently the company collects its dues. Higher ratio is
favourable to the company.
This ratio is measured by dividing net revenue to total receivables.
Oman Telecommunication
Particulars 2017 2016
RO'000 RO'000
Net revenue 273606 270033
Total receivables 41735 42099
Receivables turnover ratio [net
revenue/total receivables] 6.56 6.41
Oredo Telecommunication
Particulars 2017 2016
QR'000 QR'000
Net revenue 327,35,032 325,03,259
Total receivables 81,05,264 76,64,209
Receivables turnover ratio [net
revenue/total receivables] 4.04 4.24
FINANCE 6
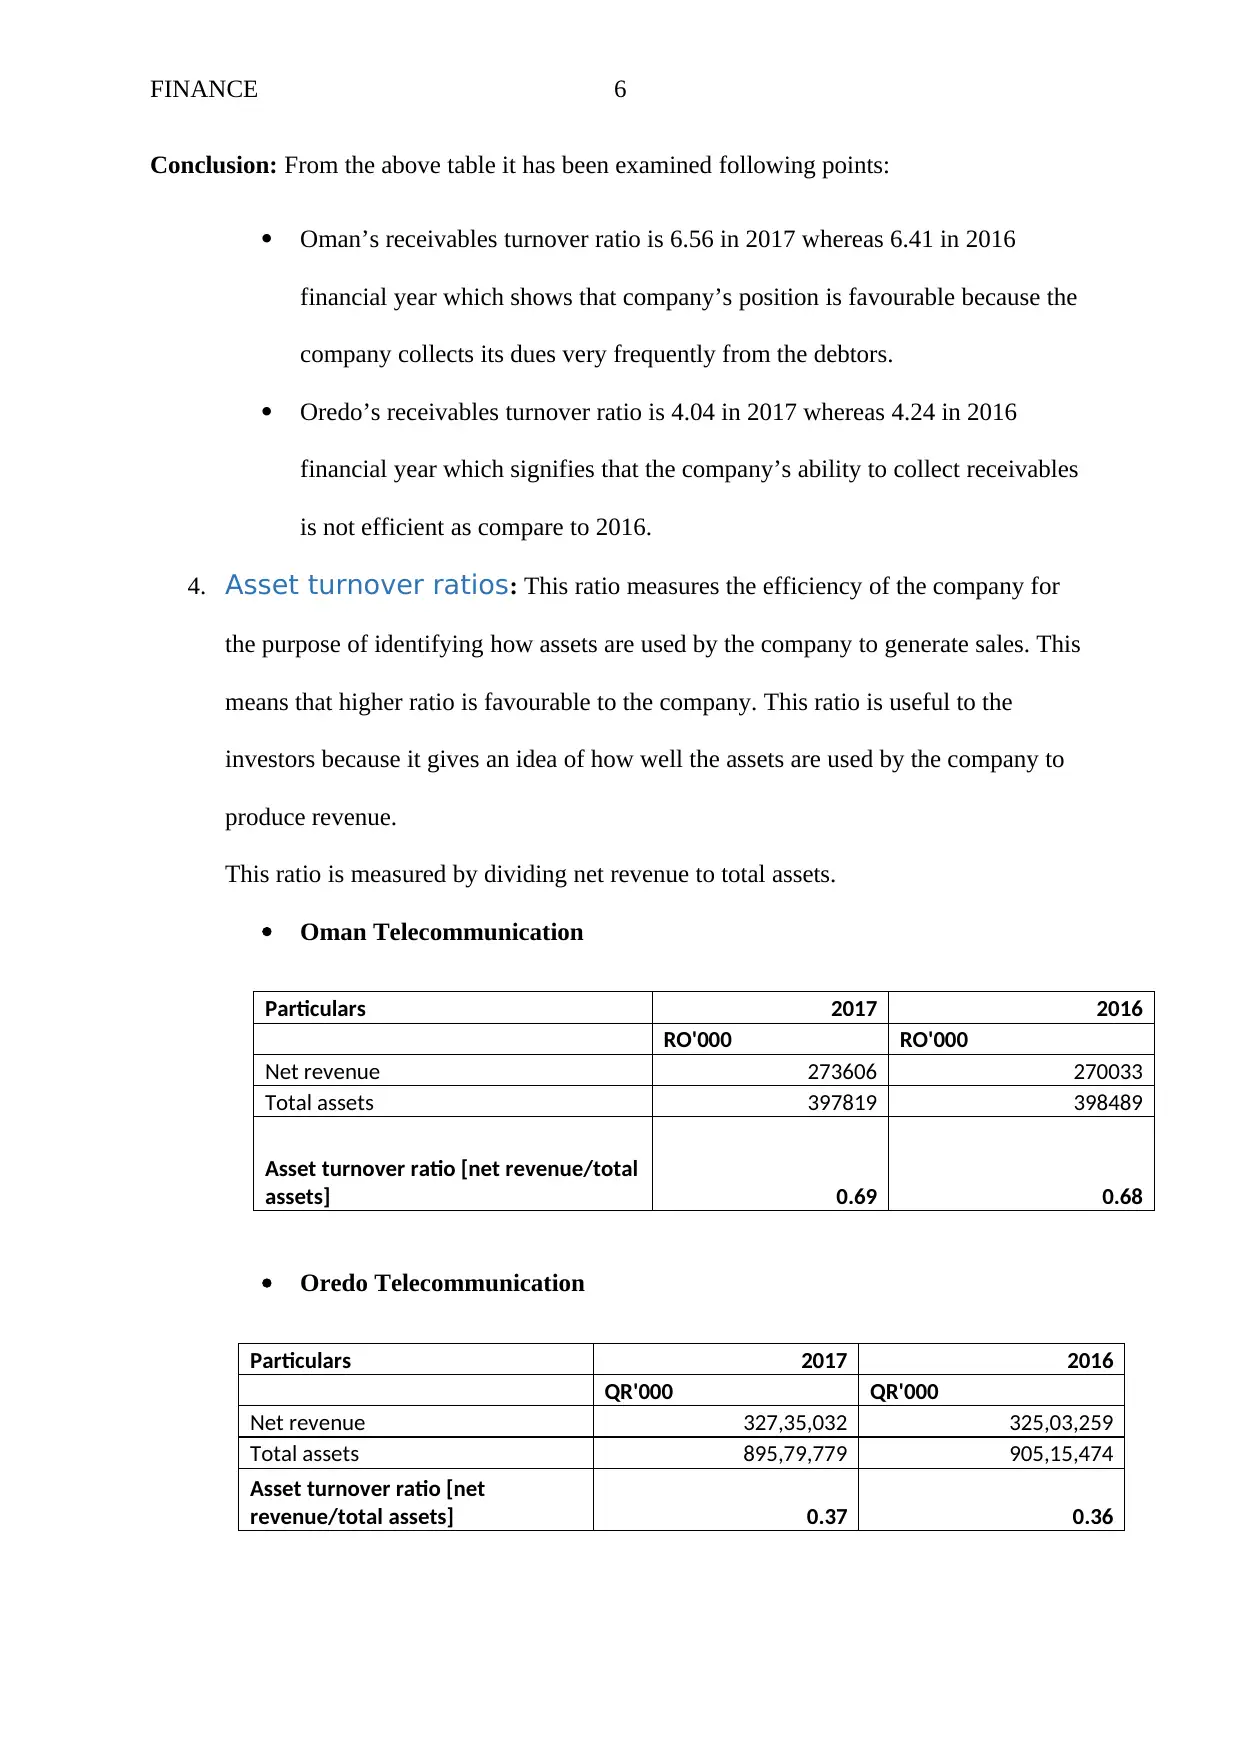
Conclusion: From the above table it has been examined following points:
Oman’s receivables turnover ratio is 6.56 in 2017 whereas 6.41 in 2016
financial year which shows that company’s position is favourable because the
company collects its dues very frequently from the debtors.
Oredo’s receivables turnover ratio is 4.04 in 2017 whereas 4.24 in 2016
financial year which signifies that the company’s ability to collect receivables
is not efficient as compare to 2016.
4. Asset turnover ratios: This ratio measures the efficiency of the company for
the purpose of identifying how assets are used by the company to generate sales. This
means that higher ratio is favourable to the company. This ratio is useful to the
investors because it gives an idea of how well the assets are used by the company to
produce revenue.
This ratio is measured by dividing net revenue to total assets.
Oman Telecommunication
Particulars 2017 2016
RO'000 RO'000
Net revenue 273606 270033
Total assets 397819 398489
Asset turnover ratio [net revenue/total
assets] 0.69 0.68
Oredo Telecommunication
Particulars 2017 2016
QR'000 QR'000
Net revenue 327,35,032 325,03,259
Total assets 895,79,779 905,15,474
Asset turnover ratio [net
revenue/total assets] 0.37 0.36
⊘ This is a preview!⊘
Do you want full access?
Subscribe today to unlock all pages.
Trusted by 1+ million students worldwide
FINANCE 7
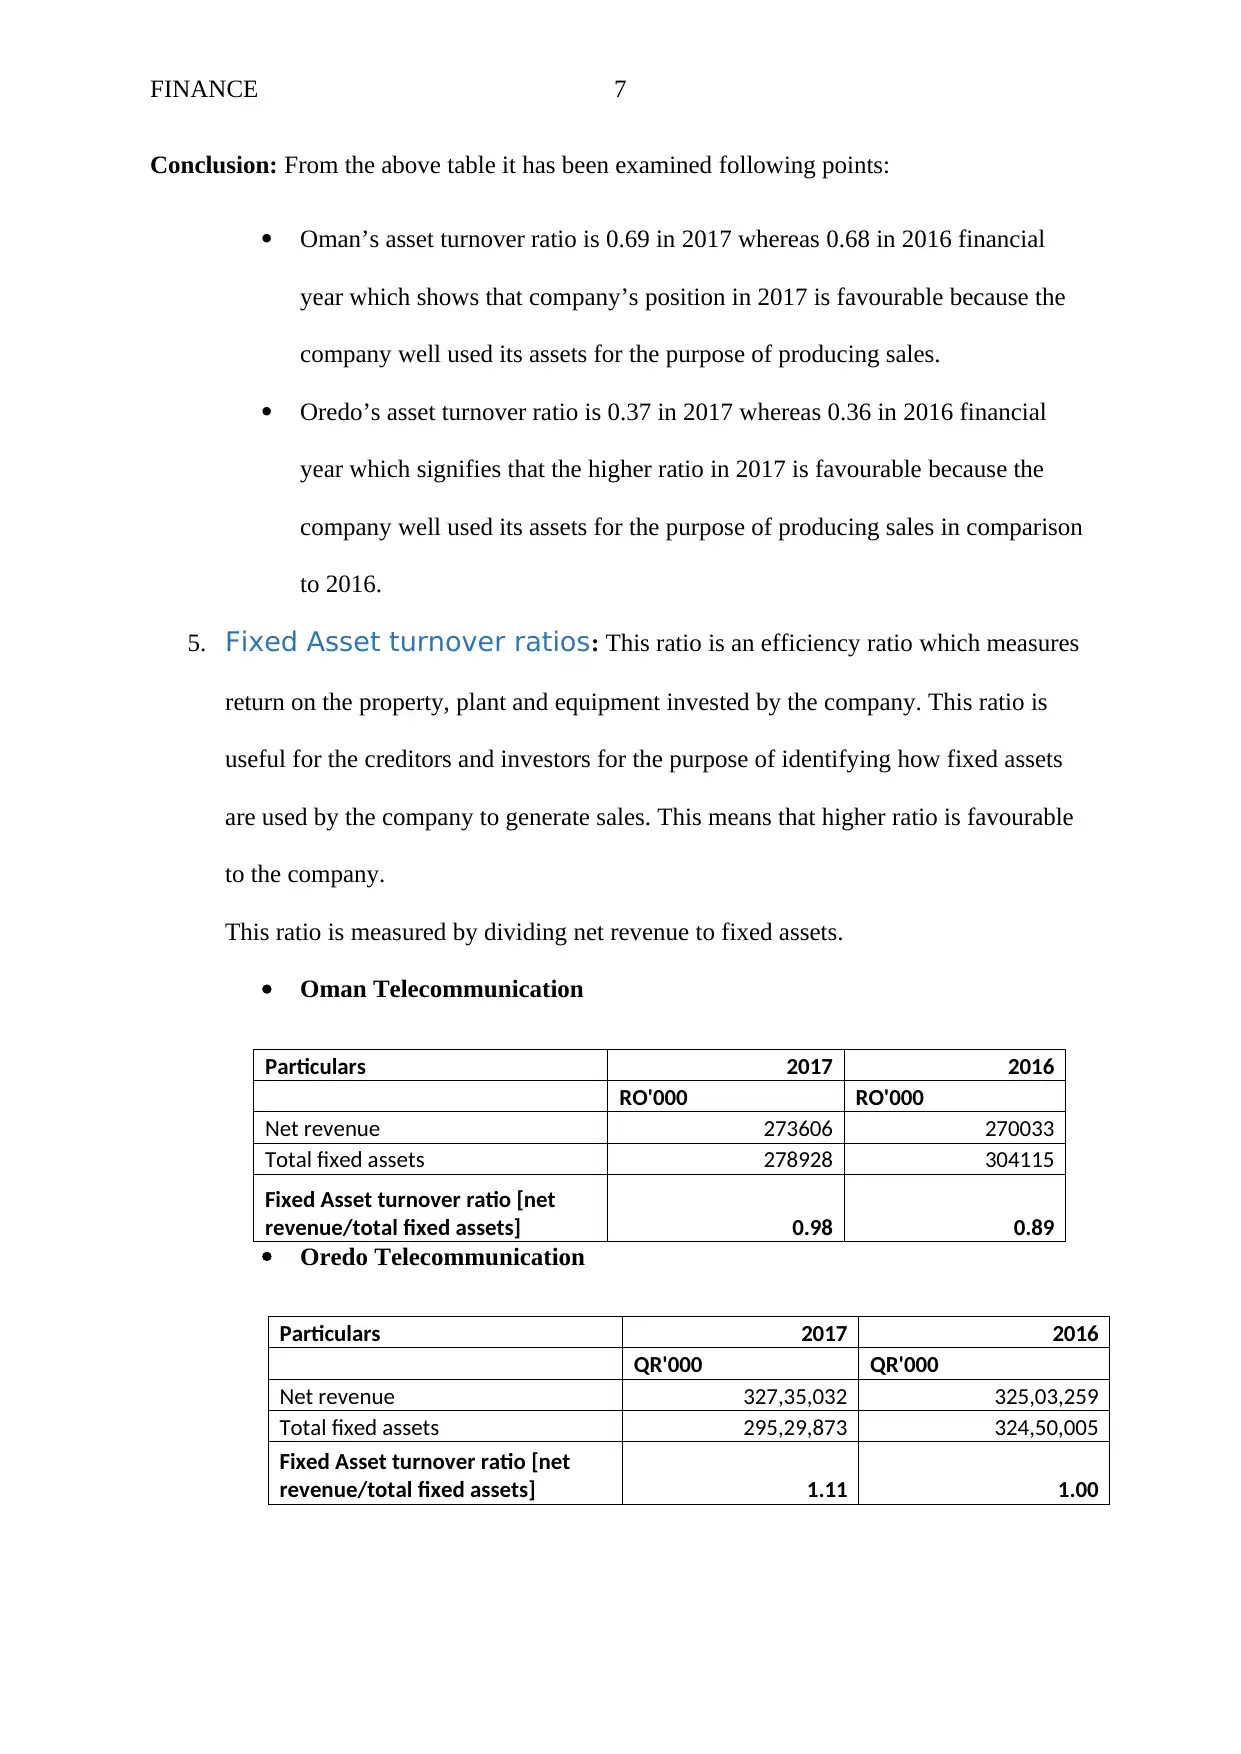
Conclusion: From the above table it has been examined following points:
Oman’s asset turnover ratio is 0.69 in 2017 whereas 0.68 in 2016 financial
year which shows that company’s position in 2017 is favourable because the
company well used its assets for the purpose of producing sales.
Oredo’s asset turnover ratio is 0.37 in 2017 whereas 0.36 in 2016 financial
year which signifies that the higher ratio in 2017 is favourable because the
company well used its assets for the purpose of producing sales in comparison
to 2016.
5. Fixed Asset turnover ratios: This ratio is an efficiency ratio which measures
return on the property, plant and equipment invested by the company. This ratio is
useful for the creditors and investors for the purpose of identifying how fixed assets
are used by the company to generate sales. This means that higher ratio is favourable
to the company.
This ratio is measured by dividing net revenue to fixed assets.
Oman Telecommunication
Particulars 2017 2016
RO'000 RO'000
Net revenue 273606 270033
Total fixed assets 278928 304115
Fixed Asset turnover ratio [net
revenue/total fixed assets] 0.98 0.89
Oredo Telecommunication
Particulars 2017 2016
QR'000 QR'000
Net revenue 327,35,032 325,03,259
Total fixed assets 295,29,873 324,50,005
Fixed Asset turnover ratio [net
revenue/total fixed assets] 1.11 1.00
Paraphrase This Document
Need a fresh take? Get an instant paraphrase of this document with our AI Paraphraser
FINANCE 8
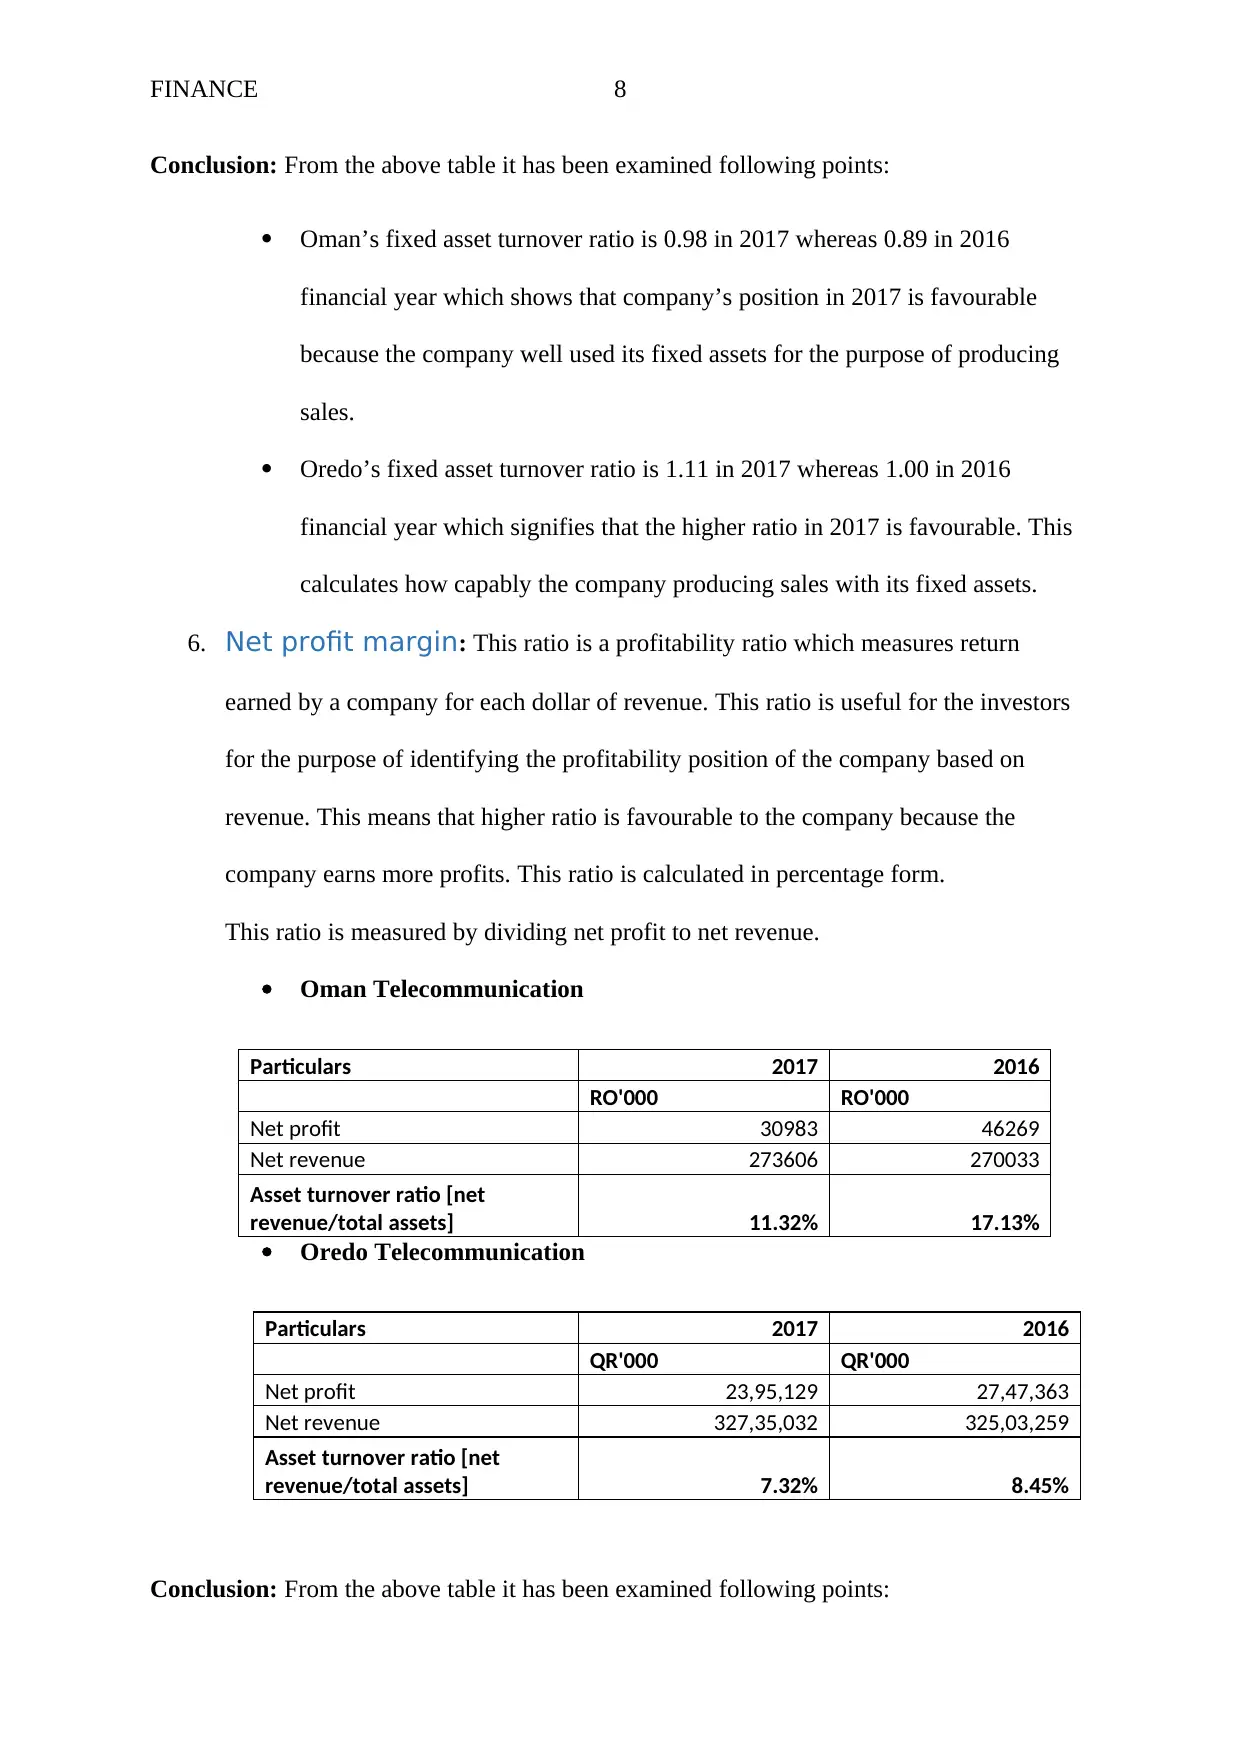
Conclusion: From the above table it has been examined following points:
Oman’s fixed asset turnover ratio is 0.98 in 2017 whereas 0.89 in 2016
financial year which shows that company’s position in 2017 is favourable
because the company well used its fixed assets for the purpose of producing
sales.
Oredo’s fixed asset turnover ratio is 1.11 in 2017 whereas 1.00 in 2016
financial year which signifies that the higher ratio in 2017 is favourable. This
calculates how capably the company producing sales with its fixed assets.
6. Net profit margin: This ratio is a profitability ratio which measures return
earned by a company for each dollar of revenue. This ratio is useful for the investors
for the purpose of identifying the profitability position of the company based on
revenue. This means that higher ratio is favourable to the company because the
company earns more profits. This ratio is calculated in percentage form.
This ratio is measured by dividing net profit to net revenue.
Oman Telecommunication
Particulars 2017 2016
RO'000 RO'000
Net profit 30983 46269
Net revenue 273606 270033
Asset turnover ratio [net
revenue/total assets] 11.32% 17.13%
Oredo Telecommunication
Particulars 2017 2016
QR'000 QR'000
Net profit 23,95,129 27,47,363
Net revenue 327,35,032 325,03,259
Asset turnover ratio [net
revenue/total assets] 7.32% 8.45%
Conclusion: From the above table it has been examined following points:
Conclusion: From the above table it has been examined following points:
Oman’s fixed asset turnover ratio is 0.98 in 2017 whereas 0.89 in 2016
financial year which shows that company’s position in 2017 is favourable
because the company well used its fixed assets for the purpose of producing
sales.
Oredo’s fixed asset turnover ratio is 1.11 in 2017 whereas 1.00 in 2016
financial year which signifies that the higher ratio in 2017 is favourable. This
calculates how capably the company producing sales with its fixed assets.
6. Net profit margin: This ratio is a profitability ratio which measures return
earned by a company for each dollar of revenue. This ratio is useful for the investors
for the purpose of identifying the profitability position of the company based on
revenue. This means that higher ratio is favourable to the company because the
company earns more profits. This ratio is calculated in percentage form.
This ratio is measured by dividing net profit to net revenue.
Oman Telecommunication
Particulars 2017 2016
RO'000 RO'000
Net profit 30983 46269
Net revenue 273606 270033
Asset turnover ratio [net
revenue/total assets] 11.32% 17.13%
Oredo Telecommunication
Particulars 2017 2016
QR'000 QR'000
Net profit 23,95,129 27,47,363
Net revenue 327,35,032 325,03,259
Asset turnover ratio [net
revenue/total assets] 7.32% 8.45%
Conclusion: From the above table it has been examined following points:
FINANCE 9
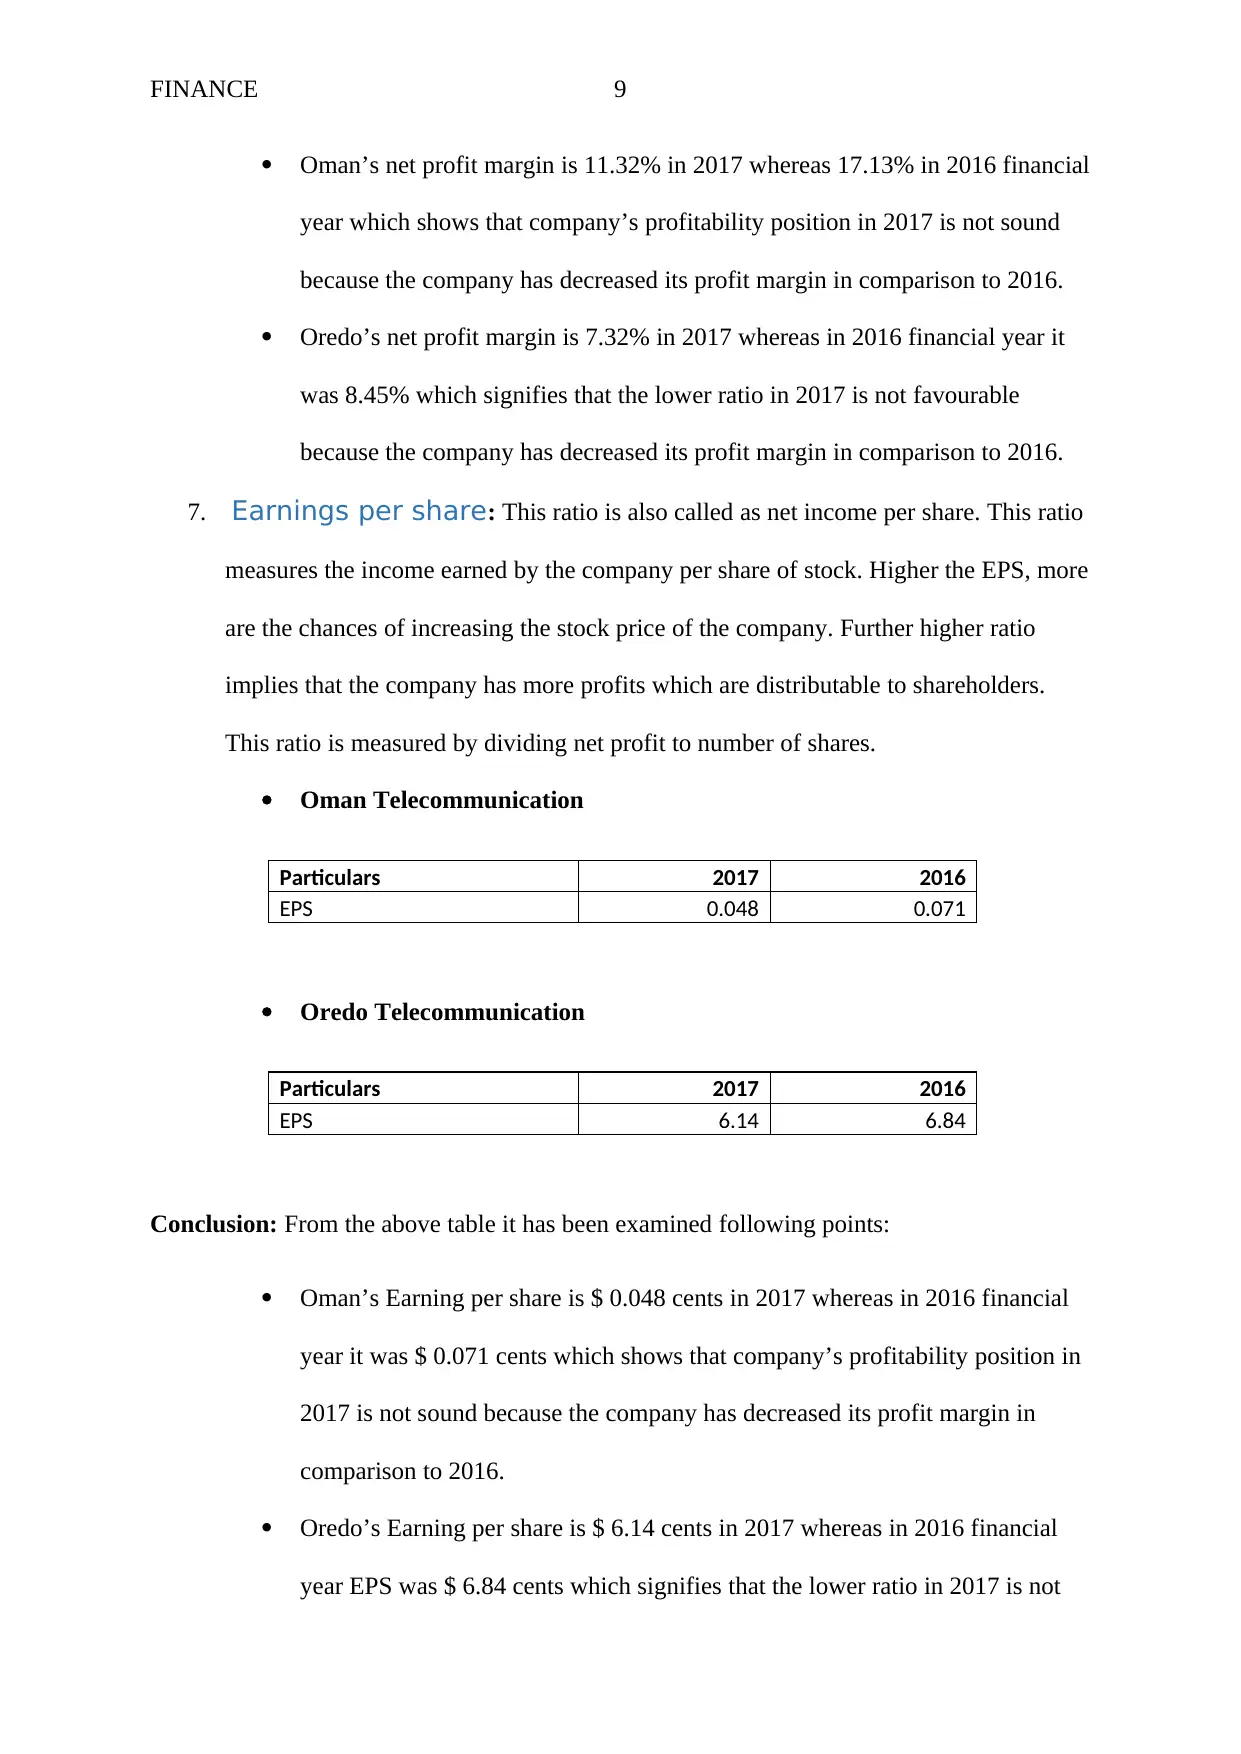
Oman’s net profit margin is 11.32% in 2017 whereas 17.13% in 2016 financial
year which shows that company’s profitability position in 2017 is not sound
because the company has decreased its profit margin in comparison to 2016.
Oredo’s net profit margin is 7.32% in 2017 whereas in 2016 financial year it
was 8.45% which signifies that the lower ratio in 2017 is not favourable
because the company has decreased its profit margin in comparison to 2016.
7. Earnings per share: This ratio is also called as net income per share. This ratio
measures the income earned by the company per share of stock. Higher the EPS, more
are the chances of increasing the stock price of the company. Further higher ratio
implies that the company has more profits which are distributable to shareholders.
This ratio is measured by dividing net profit to number of shares.
Oman Telecommunication
Particulars 2017 2016
EPS 0.048 0.071
Oredo Telecommunication
Particulars 2017 2016
EPS 6.14 6.84
Conclusion: From the above table it has been examined following points:
Oman’s Earning per share is $ 0.048 cents in 2017 whereas in 2016 financial
year it was $ 0.071 cents which shows that company’s profitability position in
2017 is not sound because the company has decreased its profit margin in
comparison to 2016.
Oredo’s Earning per share is $ 6.14 cents in 2017 whereas in 2016 financial
year EPS was $ 6.84 cents which signifies that the lower ratio in 2017 is not
⊘ This is a preview!⊘
Do you want full access?
Subscribe today to unlock all pages.
Trusted by 1+ million students worldwide
FINANCE 10
favourable because the company has decreased its profit margin in comparison
to 2016.
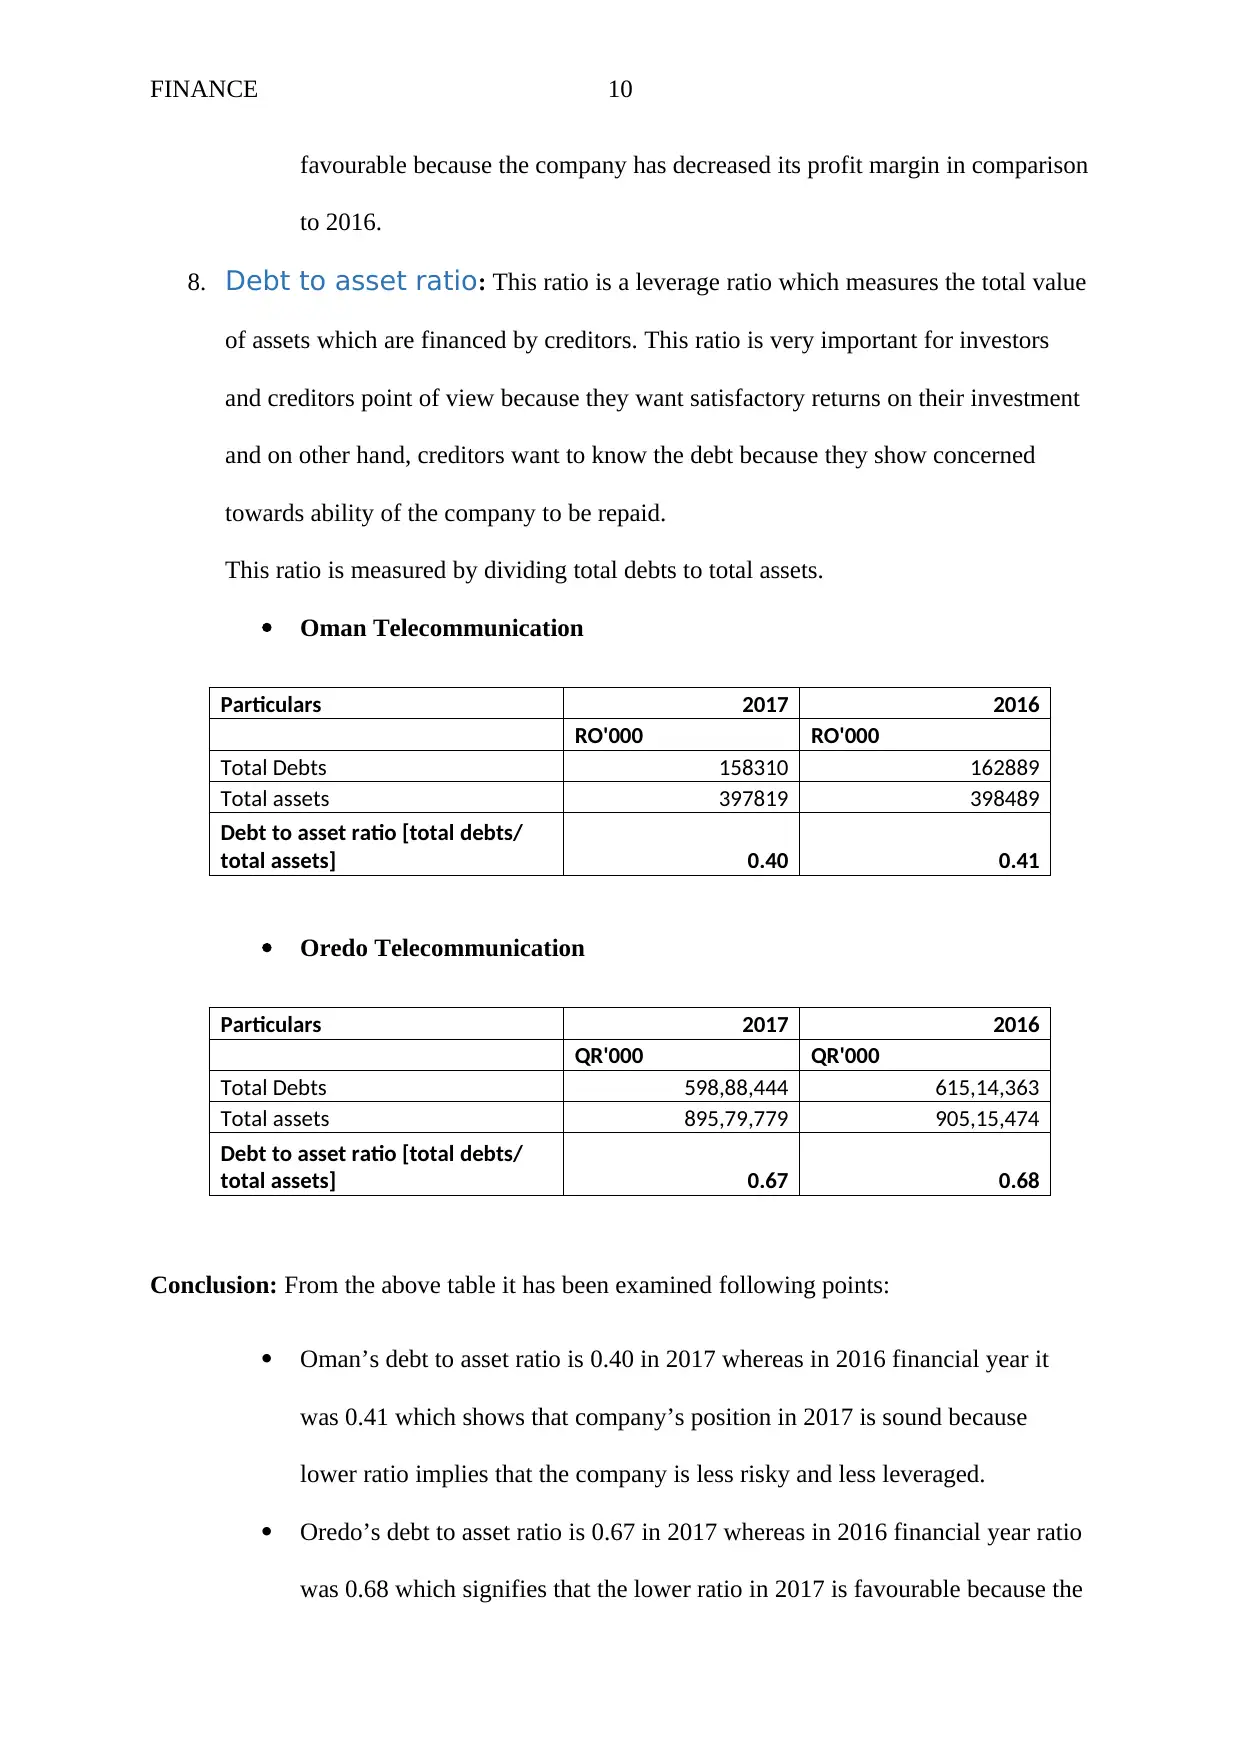
8. Debt to asset ratio: This ratio is a leverage ratio which measures the total value
of assets which are financed by creditors. This ratio is very important for investors
and creditors point of view because they want satisfactory returns on their investment
and on other hand, creditors want to know the debt because they show concerned
towards ability of the company to be repaid.
This ratio is measured by dividing total debts to total assets.
Oman Telecommunication
Particulars 2017 2016
RO'000 RO'000
Total Debts 158310 162889
Total assets 397819 398489
Debt to asset ratio [total debts/
total assets] 0.40 0.41
Oredo Telecommunication
Particulars 2017 2016
QR'000 QR'000
Total Debts 598,88,444 615,14,363
Total assets 895,79,779 905,15,474
Debt to asset ratio [total debts/
total assets] 0.67 0.68
Conclusion: From the above table it has been examined following points:
Oman’s debt to asset ratio is 0.40 in 2017 whereas in 2016 financial year it
was 0.41 which shows that company’s position in 2017 is sound because
lower ratio implies that the company is less risky and less leveraged.
Oredo’s debt to asset ratio is 0.67 in 2017 whereas in 2016 financial year ratio
was 0.68 which signifies that the lower ratio in 2017 is favourable because the
favourable because the company has decreased its profit margin in comparison
to 2016.
8. Debt to asset ratio: This ratio is a leverage ratio which measures the total value
of assets which are financed by creditors. This ratio is very important for investors
and creditors point of view because they want satisfactory returns on their investment
and on other hand, creditors want to know the debt because they show concerned
towards ability of the company to be repaid.
This ratio is measured by dividing total debts to total assets.
Oman Telecommunication
Particulars 2017 2016
RO'000 RO'000
Total Debts 158310 162889
Total assets 397819 398489
Debt to asset ratio [total debts/
total assets] 0.40 0.41
Oredo Telecommunication
Particulars 2017 2016
QR'000 QR'000
Total Debts 598,88,444 615,14,363
Total assets 895,79,779 905,15,474
Debt to asset ratio [total debts/
total assets] 0.67 0.68
Conclusion: From the above table it has been examined following points:
Oman’s debt to asset ratio is 0.40 in 2017 whereas in 2016 financial year it
was 0.41 which shows that company’s position in 2017 is sound because
lower ratio implies that the company is less risky and less leveraged.
Oredo’s debt to asset ratio is 0.67 in 2017 whereas in 2016 financial year ratio
was 0.68 which signifies that the lower ratio in 2017 is favourable because the
Paraphrase This Document
Need a fresh take? Get an instant paraphrase of this document with our AI Paraphraser
FINANCE 11
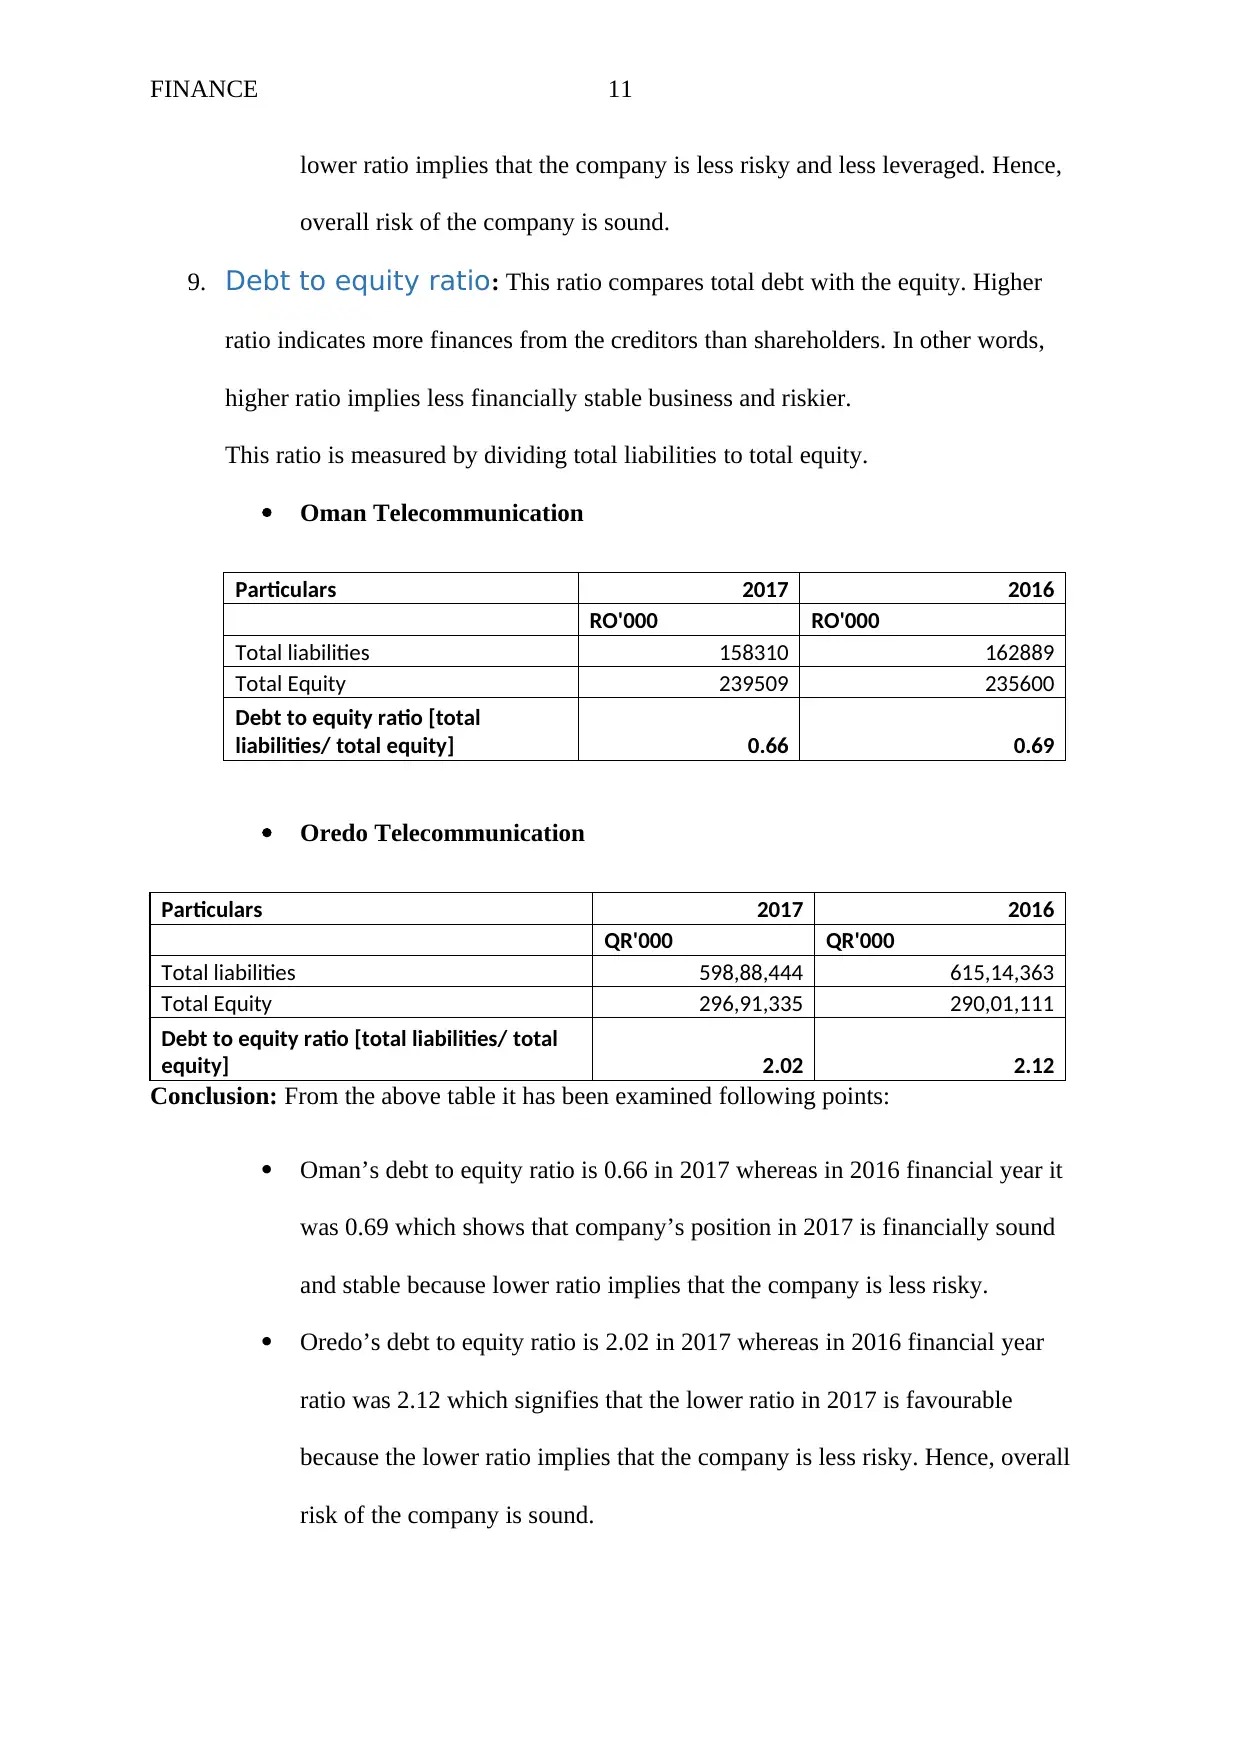
lower ratio implies that the company is less risky and less leveraged. Hence,
overall risk of the company is sound.
9. Debt to equity ratio: This ratio compares total debt with the equity. Higher
ratio indicates more finances from the creditors than shareholders. In other words,
higher ratio implies less financially stable business and riskier.
This ratio is measured by dividing total liabilities to total equity.
Oman Telecommunication
Particulars 2017 2016
RO'000 RO'000
Total liabilities 158310 162889
Total Equity 239509 235600
Debt to equity ratio [total
liabilities/ total equity] 0.66 0.69
Oredo Telecommunication
Particulars 2017 2016
QR'000 QR'000
Total liabilities 598,88,444 615,14,363
Total Equity 296,91,335 290,01,111
Debt to equity ratio [total liabilities/ total
equity] 2.02 2.12
Conclusion: From the above table it has been examined following points:
Oman’s debt to equity ratio is 0.66 in 2017 whereas in 2016 financial year it
was 0.69 which shows that company’s position in 2017 is financially sound
and stable because lower ratio implies that the company is less risky.
Oredo’s debt to equity ratio is 2.02 in 2017 whereas in 2016 financial year
ratio was 2.12 which signifies that the lower ratio in 2017 is favourable
because the lower ratio implies that the company is less risky. Hence, overall
risk of the company is sound.
FINANCE 12
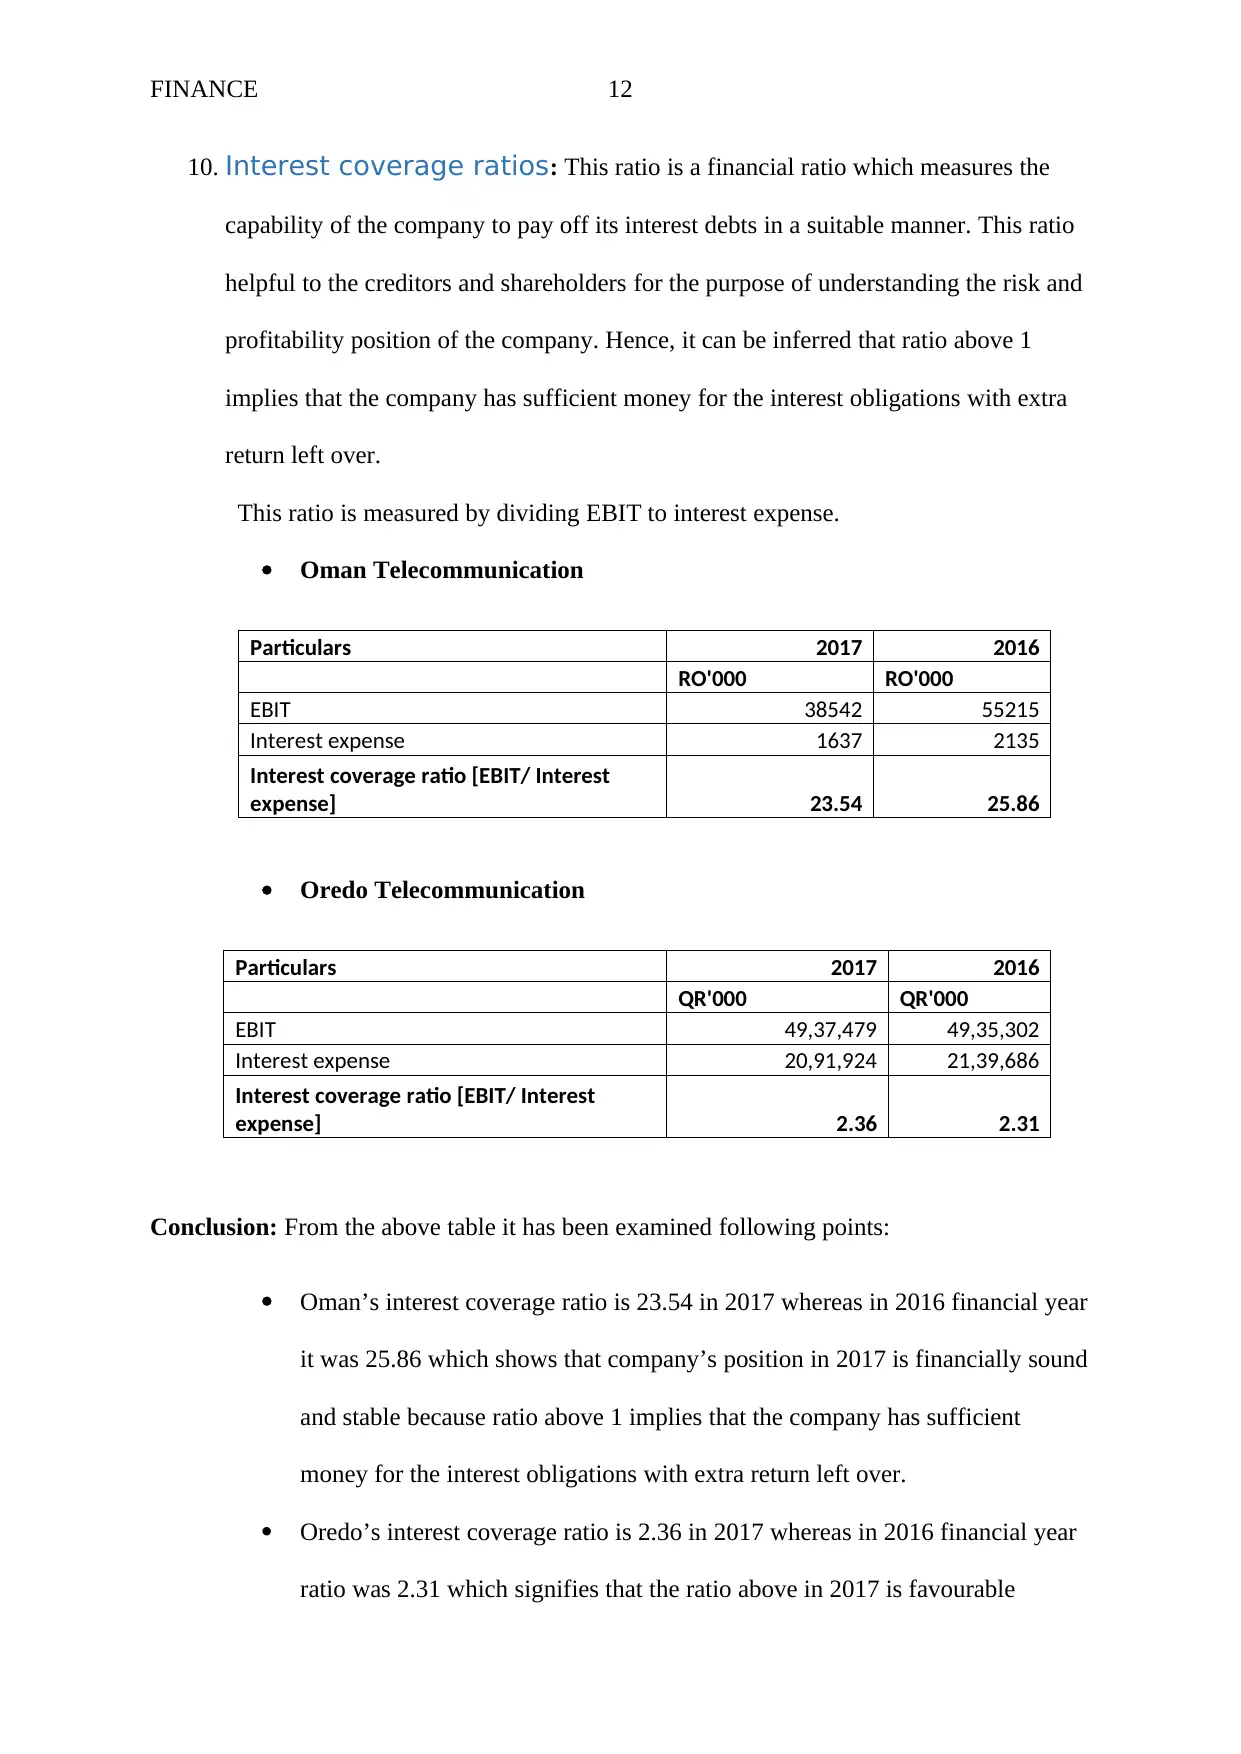
10. Interest coverage ratios: This ratio is a financial ratio which measures the
capability of the company to pay off its interest debts in a suitable manner. This ratio
helpful to the creditors and shareholders for the purpose of understanding the risk and
profitability position of the company. Hence, it can be inferred that ratio above 1
implies that the company has sufficient money for the interest obligations with extra
return left over.
This ratio is measured by dividing EBIT to interest expense.
Oman Telecommunication
Particulars 2017 2016
RO'000 RO'000
EBIT 38542 55215
Interest expense 1637 2135
Interest coverage ratio [EBIT/ Interest
expense] 23.54 25.86
Oredo Telecommunication
Particulars 2017 2016
QR'000 QR'000
EBIT 49,37,479 49,35,302
Interest expense 20,91,924 21,39,686
Interest coverage ratio [EBIT/ Interest
expense] 2.36 2.31
Conclusion: From the above table it has been examined following points:
Oman’s interest coverage ratio is 23.54 in 2017 whereas in 2016 financial year
it was 25.86 which shows that company’s position in 2017 is financially sound
and stable because ratio above 1 implies that the company has sufficient
money for the interest obligations with extra return left over.
Oredo’s interest coverage ratio is 2.36 in 2017 whereas in 2016 financial year
ratio was 2.31 which signifies that the ratio above in 2017 is favourable
⊘ This is a preview!⊘
Do you want full access?
Subscribe today to unlock all pages.
Trusted by 1+ million students worldwide
1 out of 16
Related Documents


Your All-in-One AI-Powered Toolkit for Academic Success.
+13062052269
info@desklib.com
Available 24*7 on WhatsApp / Email
![[object Object]](/_next/static/media/star-bottom.7253800d.svg)
Unlock your academic potential
Copyright © 2020–2026 A2Z Services. All Rights Reserved. Developed and managed by ZUCOL.