Financial Performance Analysis of Chef One (2017-2018): A Report

Verified

Added on  2022/11/26

|7
|1704
|150
Report
AI Summary
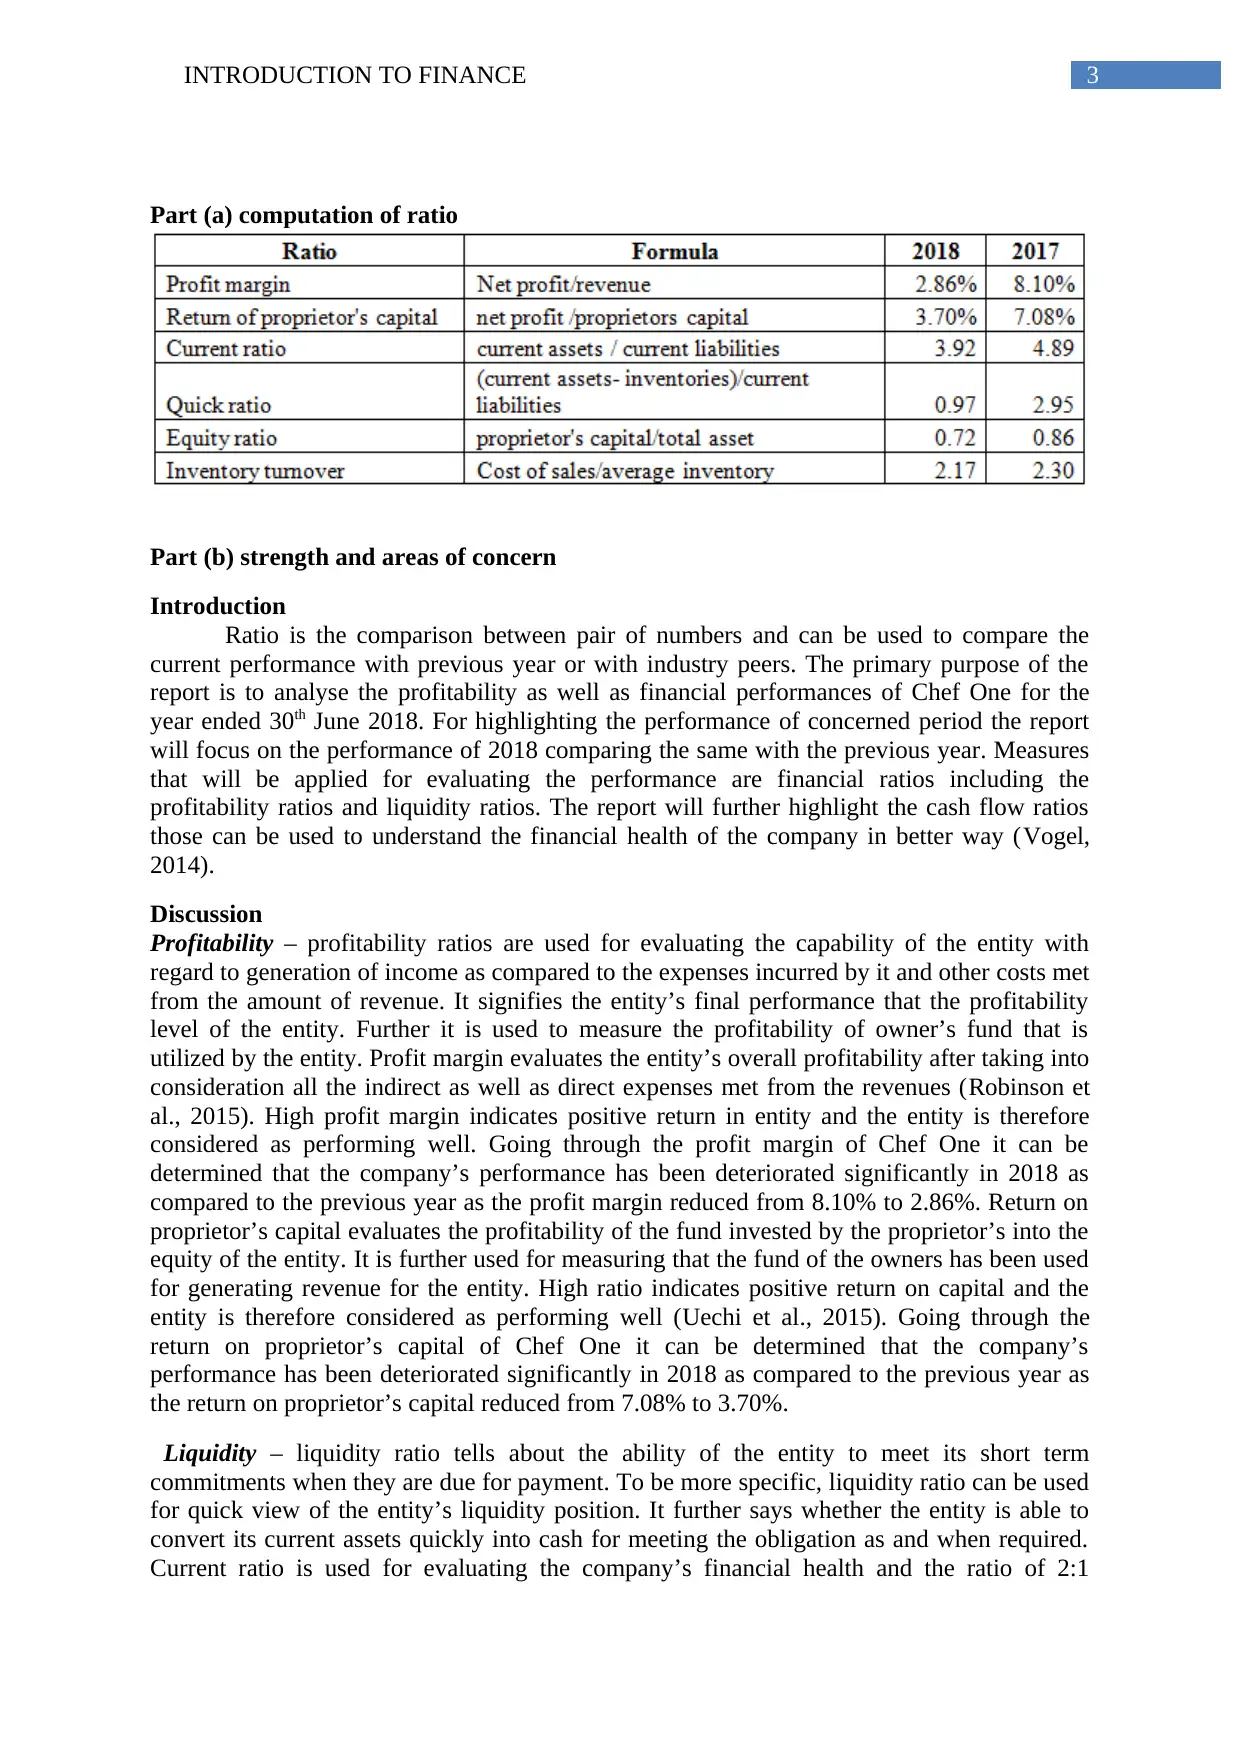
This report provides a comprehensive financial analysis of Chef One, examining its performance for the year ended June 30, 2018, compared to the previous year. The analysis utilizes various financial ratios, including profitability ratios (profit margin, return on proprietor’s capital), liquidity ratios (current ratio, quick ratio), and stability ratios (equity ratio, inventory turnover). The report identifies both strengths and weaknesses, highlighting a decline in profitability, liquidity, and stability in 2018, with areas of concern including increased costs, negative cash balance, and increased debt financing. The report concludes with recommendations for improvement, such as enhancing cash position and minimizing expenses. The report also discusses cash flow ratios that can be used to understand the financial health of the company. The analysis is based on the financial data provided in the assignment brief, and it aims to provide insights into the financial health and performance of Chef One.
Document Page
Running head: INTRODUCTION TO FINANCE
Introduction to finance
Name of the student
Name of the university
Student ID
Author note
tabler-icon-diamond-filled.svg

Paraphrase This Document

Need a fresh take? Get an instant paraphrase of this document with our AI Paraphraser
Document Page
1INTRODUCTION TO FINANCE
Executive summary
The report will focus on the financial performance of Chef One through various ratios like
profitability ratio, liquidity ratio and stability ratio. Based on the outcomes of the ratios the
report will highlight the area of strength as well as weaknesses for the entity. Further, the
report will highlight the cash flow ratios those can be used to understand the financial health
of the company in better way.
Document Page
2INTRODUCTION TO FINANCE
Table of Contents
Part (a) computation of ratio......................................................................................................3
Part (b) strength and areas of concern........................................................................................3
Introduction............................................................................................................................3
Discussion..............................................................................................................................3
Conclusion and recommendation...........................................................................................4
Part (c) cash flow ratio...............................................................................................................4
Reference....................................................................................................................................6
Document Page
3INTRODUCTION TO FINANCE
Part (a) computation of ratio
Part (b) strength and areas of concern
Introduction
Ratio is the comparison between pair of numbers and can be used to compare the
current performance with previous year or with industry peers. The primary purpose of the
report is to analyse the profitability as well as financial performances of Chef One for the
year ended 30th June 2018. For highlighting the performance of concerned period the report
will focus on the performance of 2018 comparing the same with the previous year. Measures
that will be applied for evaluating the performance are financial ratios including the
profitability ratios and liquidity ratios. The report will further highlight the cash flow ratios
those can be used to understand the financial health of the company in better way (Vogel,
2014).
Discussion
Profitability – profitability ratios are used for evaluating the capability of the entity with
regard to generation of income as compared to the expenses incurred by it and other costs met
from the amount of revenue. It signifies the entity’s final performance that the profitability
level of the entity. Further it is used to measure the profitability of owner’s fund that is
utilized by the entity. Profit margin evaluates the entity’s overall profitability after taking into
consideration all the indirect as well as direct expenses met from the revenues (Robinson et
al., 2015). High profit margin indicates positive return in entity and the entity is therefore
considered as performing well. Going through the profit margin of Chef One it can be
determined that the company’s performance has been deteriorated significantly in 2018 as
compared to the previous year as the profit margin reduced from 8.10% to 2.86%. Return on
proprietor’s capital evaluates the profitability of the fund invested by the proprietor’s into the
equity of the entity. It is further used for measuring that the fund of the owners has been used
for generating revenue for the entity. High ratio indicates positive return on capital and the
entity is therefore considered as performing well (Uechi et al., 2015). Going through the
return on proprietor’s capital of Chef One it can be determined that the company’s
performance has been deteriorated significantly in 2018 as compared to the previous year as
the return on proprietor’s capital reduced from 7.08% to 3.70%.
Liquidity – liquidity ratio tells about the ability of the entity to meet its short term
commitments when they are due for payment. To be more specific, liquidity ratio can be used
for quick view of the entity’s liquidity position. It further says whether the entity is able to
convert its current assets quickly into cash for meeting the obligation as and when required.
Current ratio is used for evaluating the company’s financial health and the ratio of 2:1
tabler-icon-diamond-filled.svg

Paraphrase This Document

Need a fresh take? Get an instant paraphrase of this document with our AI Paraphraser
Document Page
4INTRODUCTION TO FINANCE
signifies that the company has ideal current ratio (Ecer and Boyukaslan, 2014) Going through
the current ratio of the company it can be determined that the company’s liquidity position
has been deteriorated in 2018 as compared to the previous year as the current ratio dropped
from 4.89 to 3.92 times. However, for both the years the current ratio of the entity is adequate
to meet the short term obligation. On the other hand, quick ratio is considered as the best
measure for liquidity as it is more conservative as compared to the current ratio and does not
consider the assets those takes some time to convert into cash and the ratio of 1:1 signifies
that the company has ideal quick ratio (Mayes, 2014). Going through the quick ratio of the
company it can be determined that the company’s liquidity position has been significantly
deteriorated in 2018 as compared to the previous year as the quick ratio dropped from 2.95 to
0.97 times.
Financial stability – it expresses the relationship among the items included in financial
statements. Although the information provided in the financial reports is historical
information, they can still be used by the management for recognising the internal
weaknesses and strengths and projecting the future performances. These ratios are used by
the investors for company’s performance with its peers to take investment related decisions.
Equity ratio is the stability ratio that is used for evaluating the proportion of asses financed
through the equity investment of owners (Evans and Mathur, 2014). It has 2 components – 1st
component is used for showing how much of the assets are owned by the investors and 2nd
component is used for showing leverage position that is the proportion financed by debt.
Going through the equity ratio of the company it can be determined that the company’s
stability position has been deteriorated in 2018 as compared to the previous year as the equity
ratio dropped to 0.72 from 0.86 times. Hence, the leverage position as well as the stability has
been deteriorated as the entity became dependent on debt (Dokas, Giokas and Tsamis, 2014).
Looking into the inventory turnover ratio it can be observed that the times reduced from 2.30
times to 2.17 times. It signifies the time taken by the entity for replacing or selling the
inventories has been increased and hence the efficiency is reduced.
Conclusion and recommendation
From the above it can be concluded that in most of the areas the performance of the
company has been deteriorated in 2018 as compared to the previous year that is 2017. Major
areas of concern for the entity are – (i) cost of sales and other expenses has been increased
more as compared to increase in sales that led to reduction in profit (ii) cash balance of the
company has reached to negative that has major impact on liquidity position (iii) large
amount of current assets are blocked in inventories that led to drop in current ratio (iv)
purchase of new asset has been financed though debt the led to deterioration of stability
position of the entity. However, areas of strength were not found for the entity for the year
ended 2018 as in all aspects the performances have been deteriorated. Hence, it is
recommended that the entity shall improve its cash position though selling some portion f
sales in cash and reducing the credit period. it will improve the cash as well as liquidity
position. Further, cost of sales and other expenses shall be minimised, wherever possible to
improve the profitability position.
Part (c) cash flow ratio
Cash flow ratios that can be used to understand the financial health in better way are –
Operating cash flows ratio that is computed through dividing the cash flow from
operation by the current liabilities. It evaluates how liquid is the entity in short run as
Document Page
5INTRODUCTION TO FINANCE
it reveals whether the cash flow from operation is adequate to cover the liabilities or
not
Price to cash flow ratio that is computed through dividing the share price by the
operating cash flow per share. It is useful as it compares the share price of the entity
with the entity’s cash flow generated on basis of per share (Brigham et al., 2016).
Document Page
6INTRODUCTION TO FINANCE
Reference
Brigham, E.F., Ehrhardt, M.C., Nason, R.R. and Gessaroli, J., 2016. Financial Managment:
Theory And Practice, Canadian Edition. Nelson Education.
Dokas, I., Giokas, D. and Tsamis, A., 2014. Liquidity efficiency in the Greek listed firms: a
financial ratio based on data envelopment analysis. International Journal of Corporate
Finance and Accounting (IJCFA), 1(1), pp.40-59.
Ecer, F. and Boyukaslan, A., 2014. Measuring performances of football clubs using financial
ratios: the gray relational analysis approach. American Journal of Economics, 4(1), pp.62-71.
Evans, J.R. and Mathur, A., 2014. Retailing and the period leading up to the Great Recession:
a model and a 25-year financial ratio analysis of US retailing. The International Review of
Retail, Distribution and Consumer Research, 24(1), pp.30-58.
Mayes, T.R., 2014. Financial Analysis with Microsoft Excel. Nelson Education.
Robinson, T.R., Henry, E., Pirie, W.L. and Broihahn, M.A., 2015. International financial
statement analysis. John Wiley & Sons.
Uechi, L., Akutsu, T., Stanley, H.E., Marcus, A.J. and Kenett, D.Y., 2015. Sector dominance
ratio analysis of financial markets. Physica A: Statistical Mechanics and its
Applications, 421, pp.488-509.
Vogel, H.L., 2014. Entertainment industry economics: A guide for financial analysis.
Cambridge University Press.
chevron_up_icon
1 out of 7
circle_padding
hide_on_mobile
zoom_out_icon
[object Object]