Managerial Finance: Comparative Financial Ratio Analysis Report
VerifiedAdded on 2023/01/16
|20
|3987
|64
Report
AI Summary
This report provides a comprehensive analysis of managerial finance, focusing on the comparative financial performance of GlaxoSmithKline plc and Reckitt Benckiser Group plc. The analysis involves calculating and evaluating ten key financial ratios for the years 2017 and 2018, including current ratio, quick ratio, net profit margin, gross profit margin, gearing ratio, price-earning ratio, earnings per share, return on capital employed, average inventory turnover period, and dividend payout ratio. The report assesses the financial position, performance, and investment potential of both companies based on these ratios. Additionally, it discusses the limitations of financial ratios and investment appraisal techniques, and offers recommendations to improve the financial performance of the comparatively weaker company. The report concludes with an overview of the findings and includes a list of references.

Managerial Finance
Paraphrase This Document
Need a fresh take? Get an instant paraphrase of this document with our AI Paraphraser
Table of Contents
INTRODUCTION...........................................................................................................................1
TASK ..............................................................................................................................................1
PORTFOLIO 1.................................................................................................................................1
(a) Calculation of different financial ratios for two years (2017 – 2018):..................................1
c. Recommendation in order to improve the poorly performing business..................................4
d. Limitation of financial ratios...................................................................................................5
PORTFOLIO 2.................................................................................................................................6
(a). Calculation of financial ratios for two years (2017 – 2018):................................................6
Payback Period:...........................................................................................................................6
b. Limitation of using investment appraisal technique.............................................................10
CONCLUSION..............................................................................................................................11
REFERENCES .............................................................................................................................12

⊘ This is a preview!⊘
Do you want full access?
Subscribe today to unlock all pages.
Trusted by 1+ million students worldwide
INTRODUCTION
Managerial finance related to finance division that is dealing with fiscal tactics '
managerial importance. Instead of methodology, it depends on interpretation (Carbo‐Valverde,
Rodriguez‐Fernandez and Udell, 2016). Management finance deals with the responsibilities of
the fiscal manager who functions in a company. This study involves comparative analysis of
corporations named Glaxo Smith Kline plc and Reckitt Benckiser Group plc by computation
and critical evaluation of 10 significant financial ratios. It further discuss about several major
investment appraisal methods which assist managers and investors in taking financial and
investment decisions.
TASK
PORTFOLIO 1
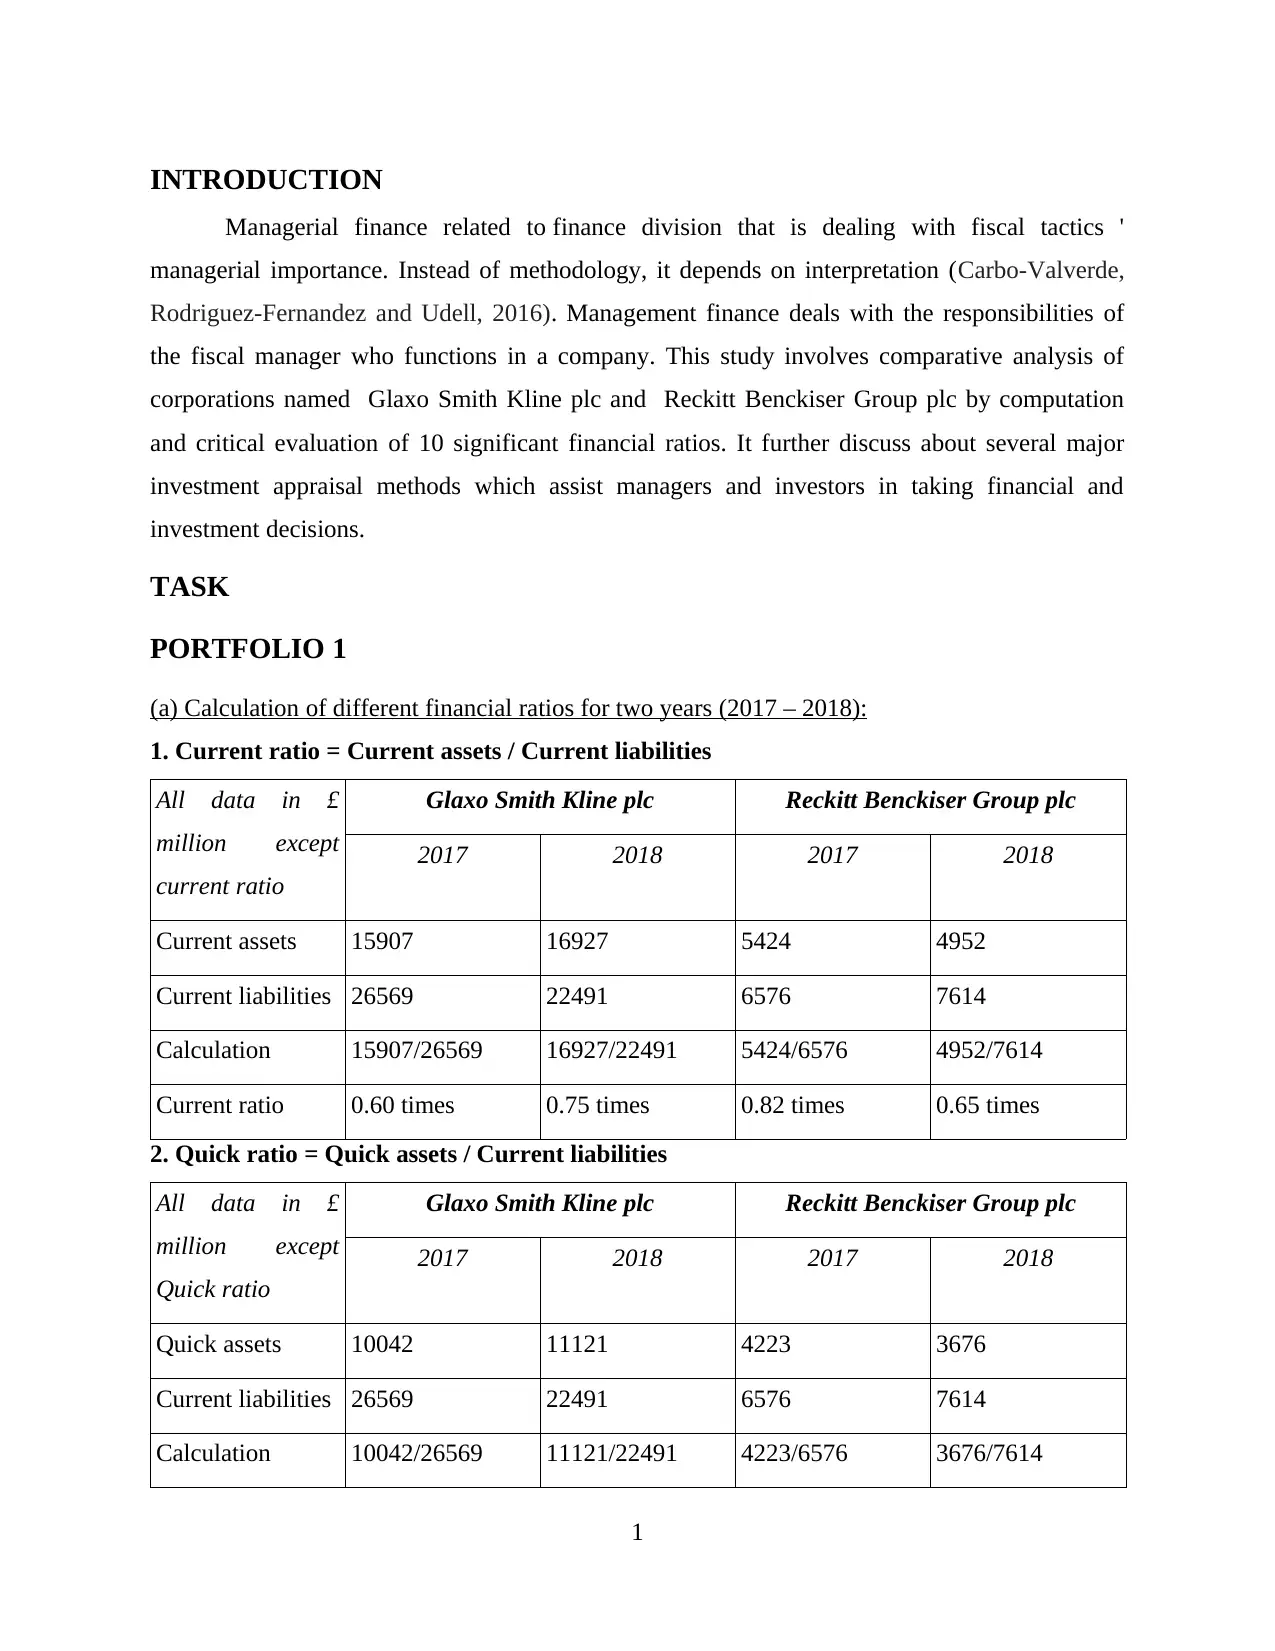
(a) Calculation of different financial ratios for two years (2017 – 2018):
1. Current ratio = Current assets / Current liabilities
All data in £
million except
current ratio
Glaxo Smith Kline plc Reckitt Benckiser Group plc
2017 2018 2017 2018
Current assets 15907 16927 5424 4952
Current liabilities 26569 22491 6576 7614
Calculation 15907/26569 16927/22491 5424/6576 4952/7614
Current ratio 0.60 times 0.75 times 0.82 times 0.65 times
2. Quick ratio = Quick assets / Current liabilities
All data in £
million except
Quick ratio
Glaxo Smith Kline plc Reckitt Benckiser Group plc
2017 2018 2017 2018
Quick assets 10042 11121 4223 3676
Current liabilities 26569 22491 6576 7614
Calculation 10042/26569 11121/22491 4223/6576 3676/7614
1
Managerial finance related to finance division that is dealing with fiscal tactics '
managerial importance. Instead of methodology, it depends on interpretation (Carbo‐Valverde,
Rodriguez‐Fernandez and Udell, 2016). Management finance deals with the responsibilities of
the fiscal manager who functions in a company. This study involves comparative analysis of
corporations named Glaxo Smith Kline plc and Reckitt Benckiser Group plc by computation
and critical evaluation of 10 significant financial ratios. It further discuss about several major
investment appraisal methods which assist managers and investors in taking financial and
investment decisions.
TASK
PORTFOLIO 1
(a) Calculation of different financial ratios for two years (2017 – 2018):
1. Current ratio = Current assets / Current liabilities
All data in £
million except
current ratio
Glaxo Smith Kline plc Reckitt Benckiser Group plc
2017 2018 2017 2018
Current assets 15907 16927 5424 4952
Current liabilities 26569 22491 6576 7614
Calculation 15907/26569 16927/22491 5424/6576 4952/7614
Current ratio 0.60 times 0.75 times 0.82 times 0.65 times
2. Quick ratio = Quick assets / Current liabilities
All data in £
million except
Quick ratio
Glaxo Smith Kline plc Reckitt Benckiser Group plc
2017 2018 2017 2018
Quick assets 10042 11121 4223 3676
Current liabilities 26569 22491 6576 7614
Calculation 10042/26569 11121/22491 4223/6576 3676/7614
1
Paraphrase This Document
Need a fresh take? Get an instant paraphrase of this document with our AI Paraphraser
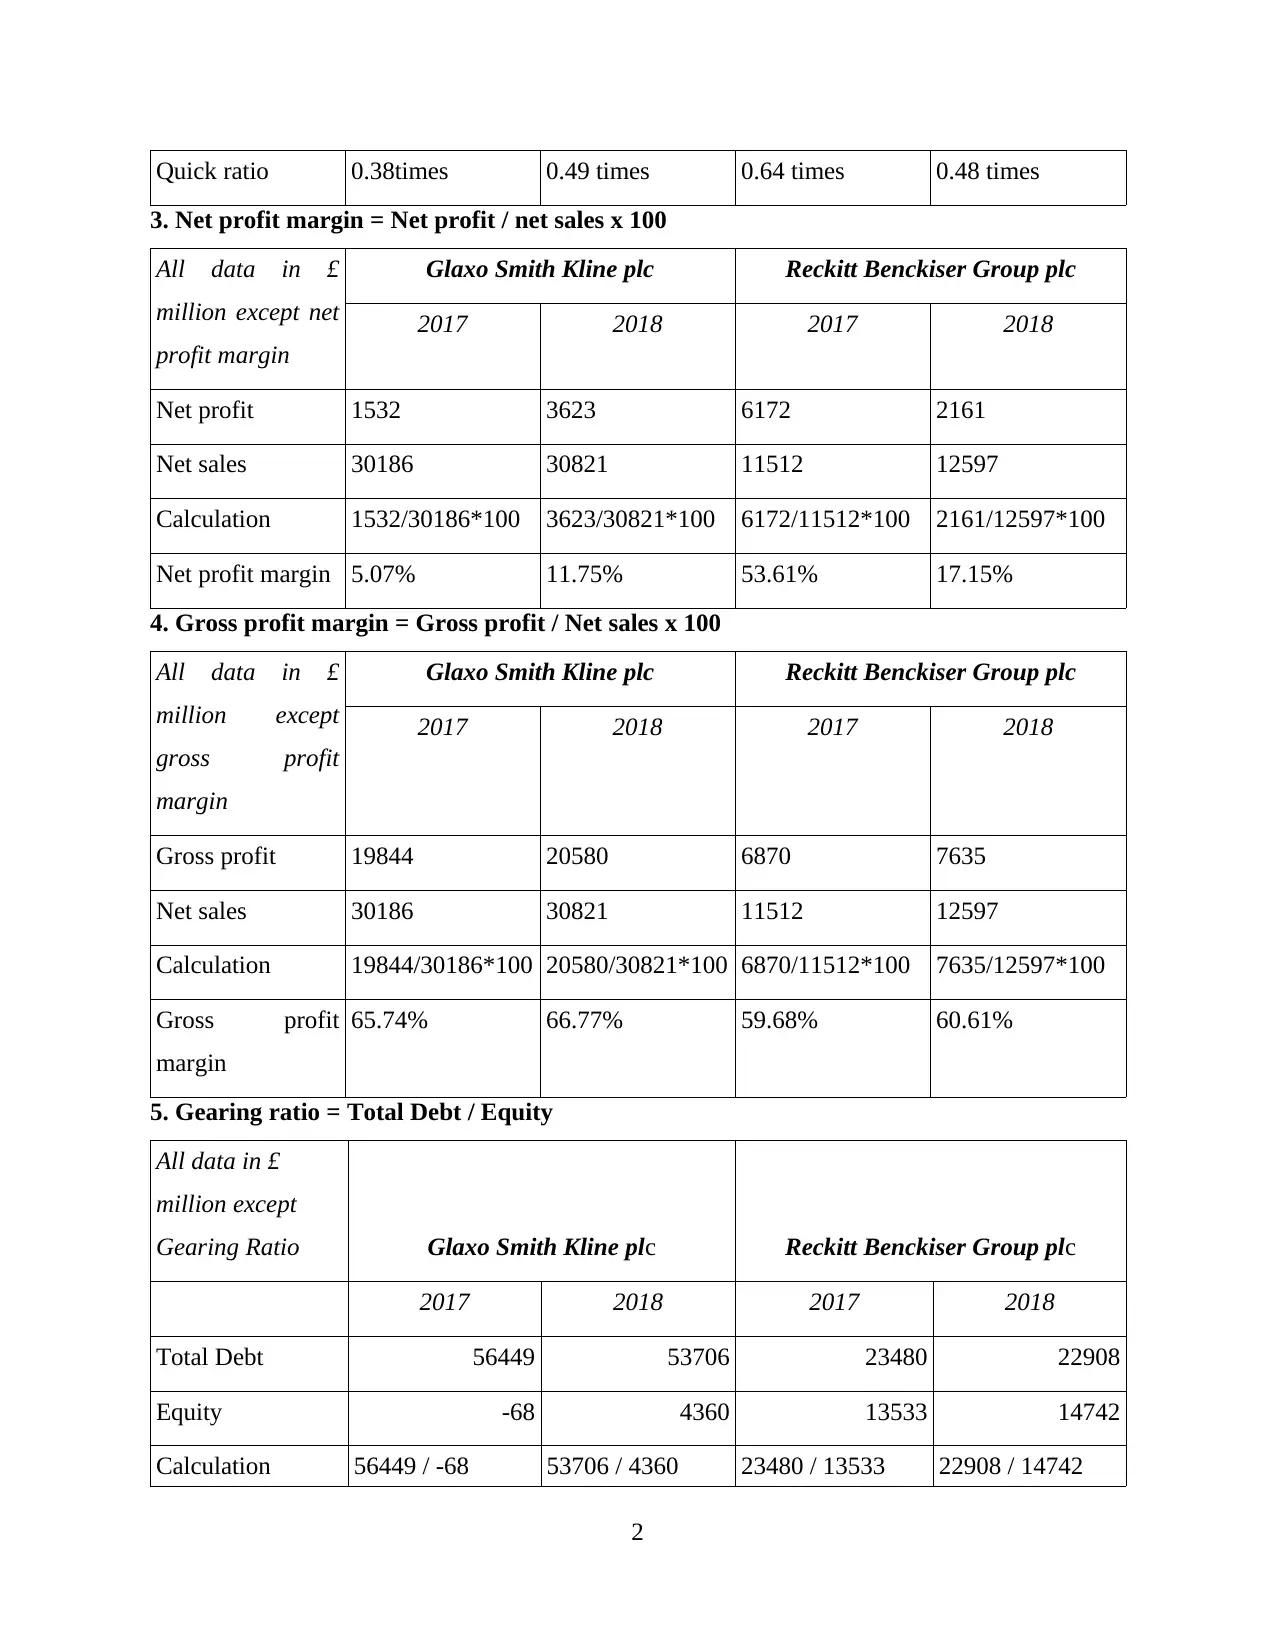
Quick ratio 0.38times 0.49 times 0.64 times 0.48 times
3. Net profit margin = Net profit / net sales x 100
All data in £
million except net
profit margin
Glaxo Smith Kline plc Reckitt Benckiser Group plc
2017 2018 2017 2018
Net profit 1532 3623 6172 2161
Net sales 30186 30821 11512 12597
Calculation 1532/30186*100 3623/30821*100 6172/11512*100 2161/12597*100
Net profit margin 5.07% 11.75% 53.61% 17.15%
4. Gross profit margin = Gross profit / Net sales x 100
All data in £
million except
gross profit
margin
Glaxo Smith Kline plc Reckitt Benckiser Group plc
2017 2018 2017 2018
Gross profit 19844 20580 6870 7635
Net sales 30186 30821 11512 12597
Calculation 19844/30186*100 20580/30821*100 6870/11512*100 7635/12597*100
Gross profit
margin
65.74% 66.77% 59.68% 60.61%
5. Gearing ratio = Total Debt / Equity
All data in £
million except
Gearing Ratio Glaxo Smith Kline plc Reckitt Benckiser Group plc
2017 2018 2017 2018
Total Debt 56449 53706 23480 22908
Equity -68 4360 13533 14742
Calculation 56449 / -68 53706 / 4360 23480 / 13533 22908 / 14742
2
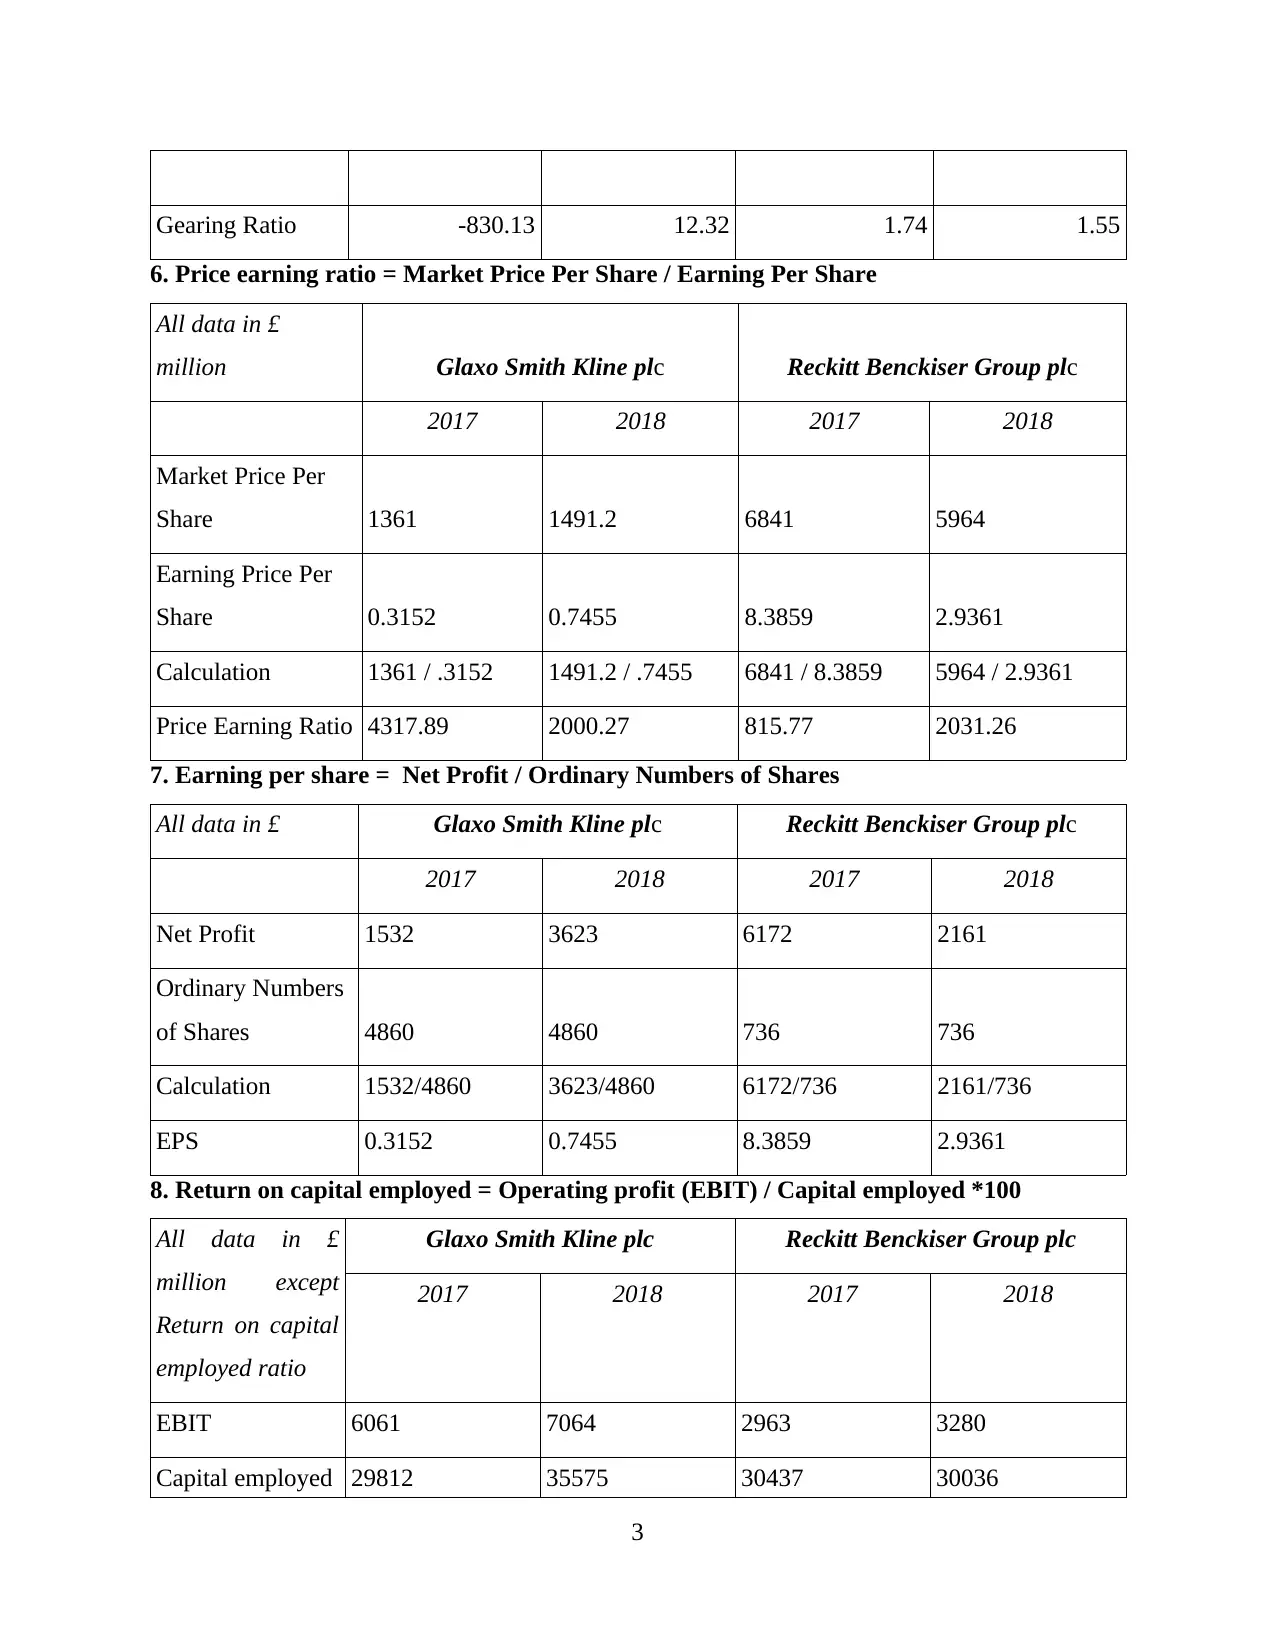
Gearing Ratio -830.13 12.32 1.74 1.55
6. Price earning ratio = Market Price Per Share / Earning Per Share
All data in £
million Glaxo Smith Kline plc Reckitt Benckiser Group plc
2017 2018 2017 2018
Market Price Per
Share 1361 1491.2 6841 5964
Earning Price Per
Share 0.3152 0.7455 8.3859 2.9361
Calculation 1361 / .3152 1491.2 / .7455 6841 / 8.3859 5964 / 2.9361
Price Earning Ratio 4317.89 2000.27 815.77 2031.26
7. Earning per share = Net Profit / Ordinary Numbers of Shares
All data in £ Glaxo Smith Kline plc Reckitt Benckiser Group plc
2017 2018 2017 2018
Net Profit 1532 3623 6172 2161
Ordinary Numbers
of Shares 4860 4860 736 736
Calculation 1532/4860 3623/4860 6172/736 2161/736
EPS 0.3152 0.7455 8.3859 2.9361
8. Return on capital employed = Operating profit (EBIT) / Capital employed *100
All data in £
million except
Return on capital
employed ratio
Glaxo Smith Kline plc Reckitt Benckiser Group plc
2017 2018 2017 2018
EBIT 6061 7064 2963 3280
Capital employed 29812 35575 30437 30036
3
⊘ This is a preview!⊘
Do you want full access?
Subscribe today to unlock all pages.
Trusted by 1+ million students worldwide
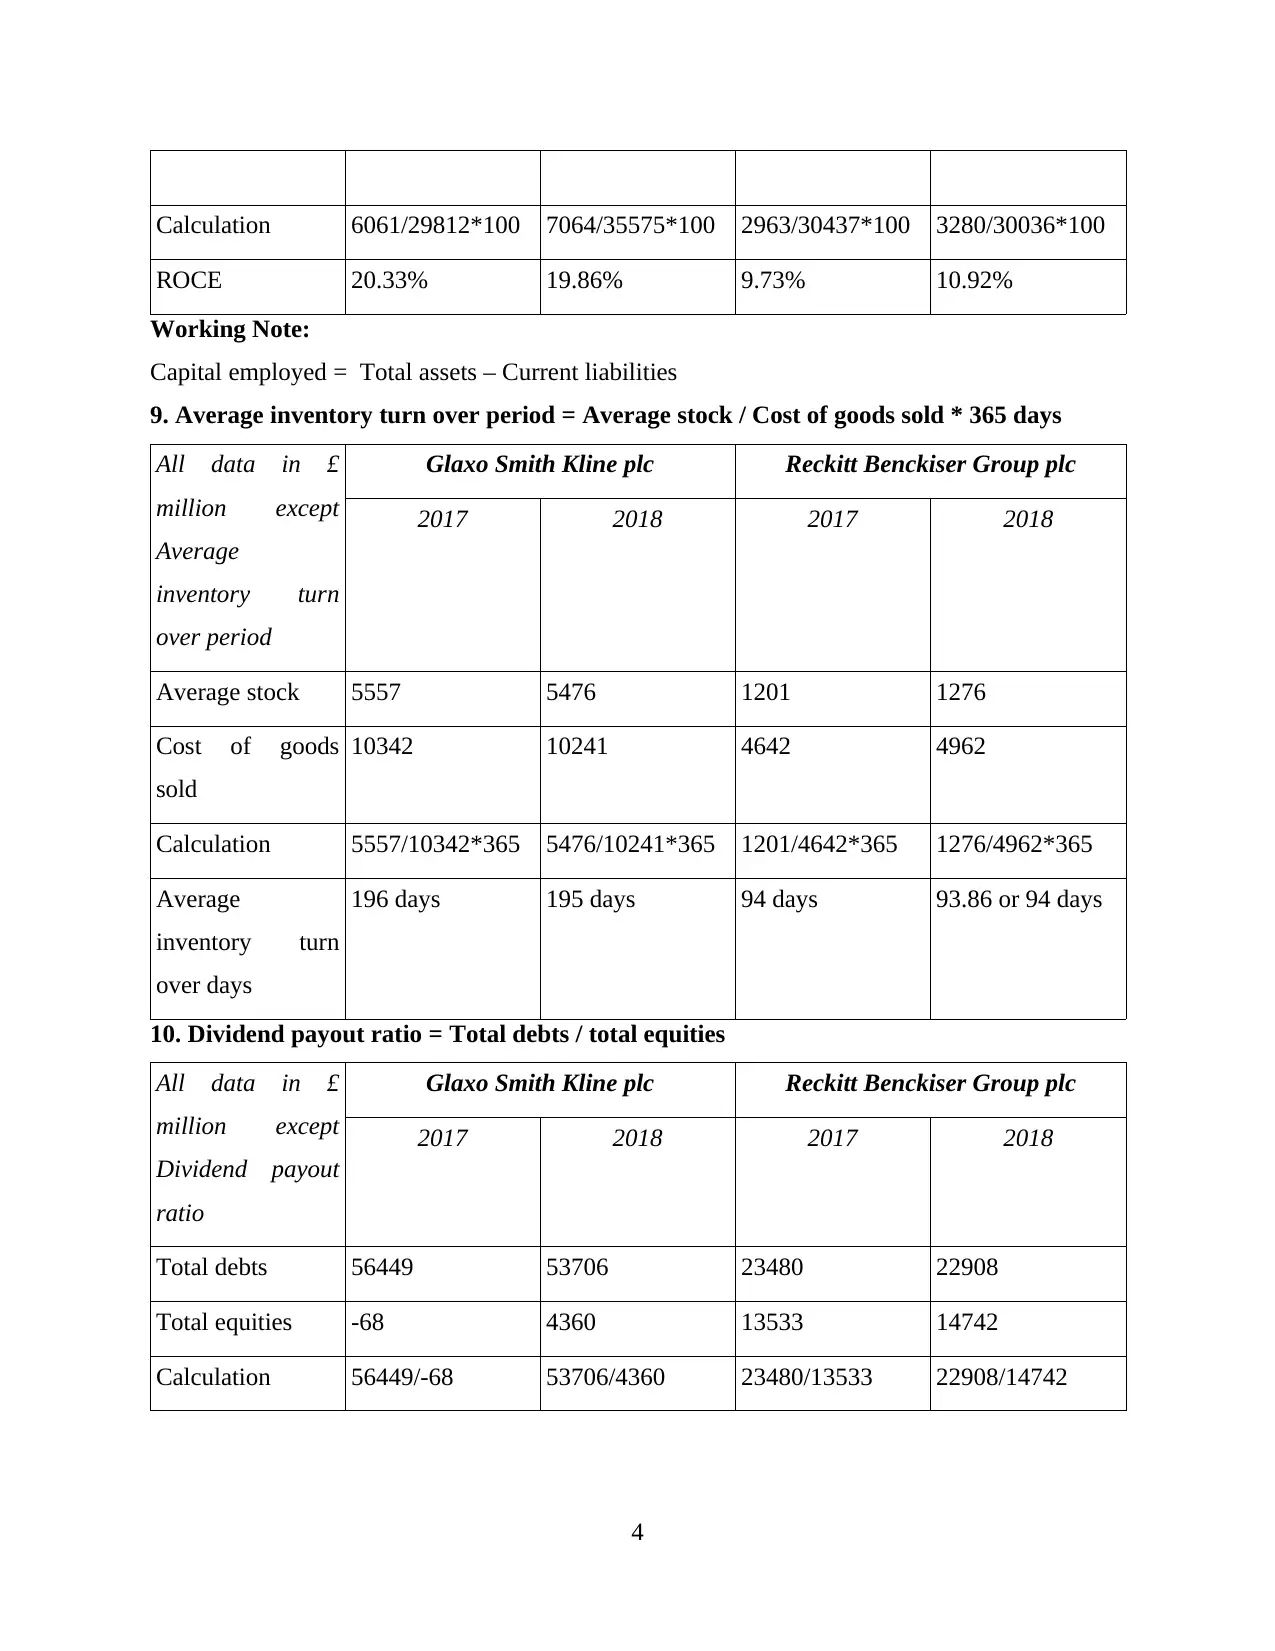
Calculation 6061/29812*100 7064/35575*100 2963/30437*100 3280/30036*100
ROCE 20.33% 19.86% 9.73% 10.92%
Working Note:
Capital employed = Total assets – Current liabilities
9. Average inventory turn over period = Average stock / Cost of goods sold * 365 days
All data in £
million except
Average
inventory turn
over period
Glaxo Smith Kline plc Reckitt Benckiser Group plc
2017 2018 2017 2018
Average stock 5557 5476 1201 1276
Cost of goods
sold
10342 10241 4642 4962
Calculation 5557/10342*365 5476/10241*365 1201/4642*365 1276/4962*365
Average
inventory turn
over days
196 days 195 days 94 days 93.86 or 94 days
10. Dividend payout ratio = Total debts / total equities
All data in £
million except
Dividend payout
ratio
Glaxo Smith Kline plc Reckitt Benckiser Group plc
2017 2018 2017 2018
Total debts 56449 53706 23480 22908
Total equities -68 4360 13533 14742
Calculation 56449/-68 53706/4360 23480/13533 22908/14742
4
Paraphrase This Document
Need a fresh take? Get an instant paraphrase of this document with our AI Paraphraser
Dividend payout
ratio
-830.13 12.31 1.73 1.55
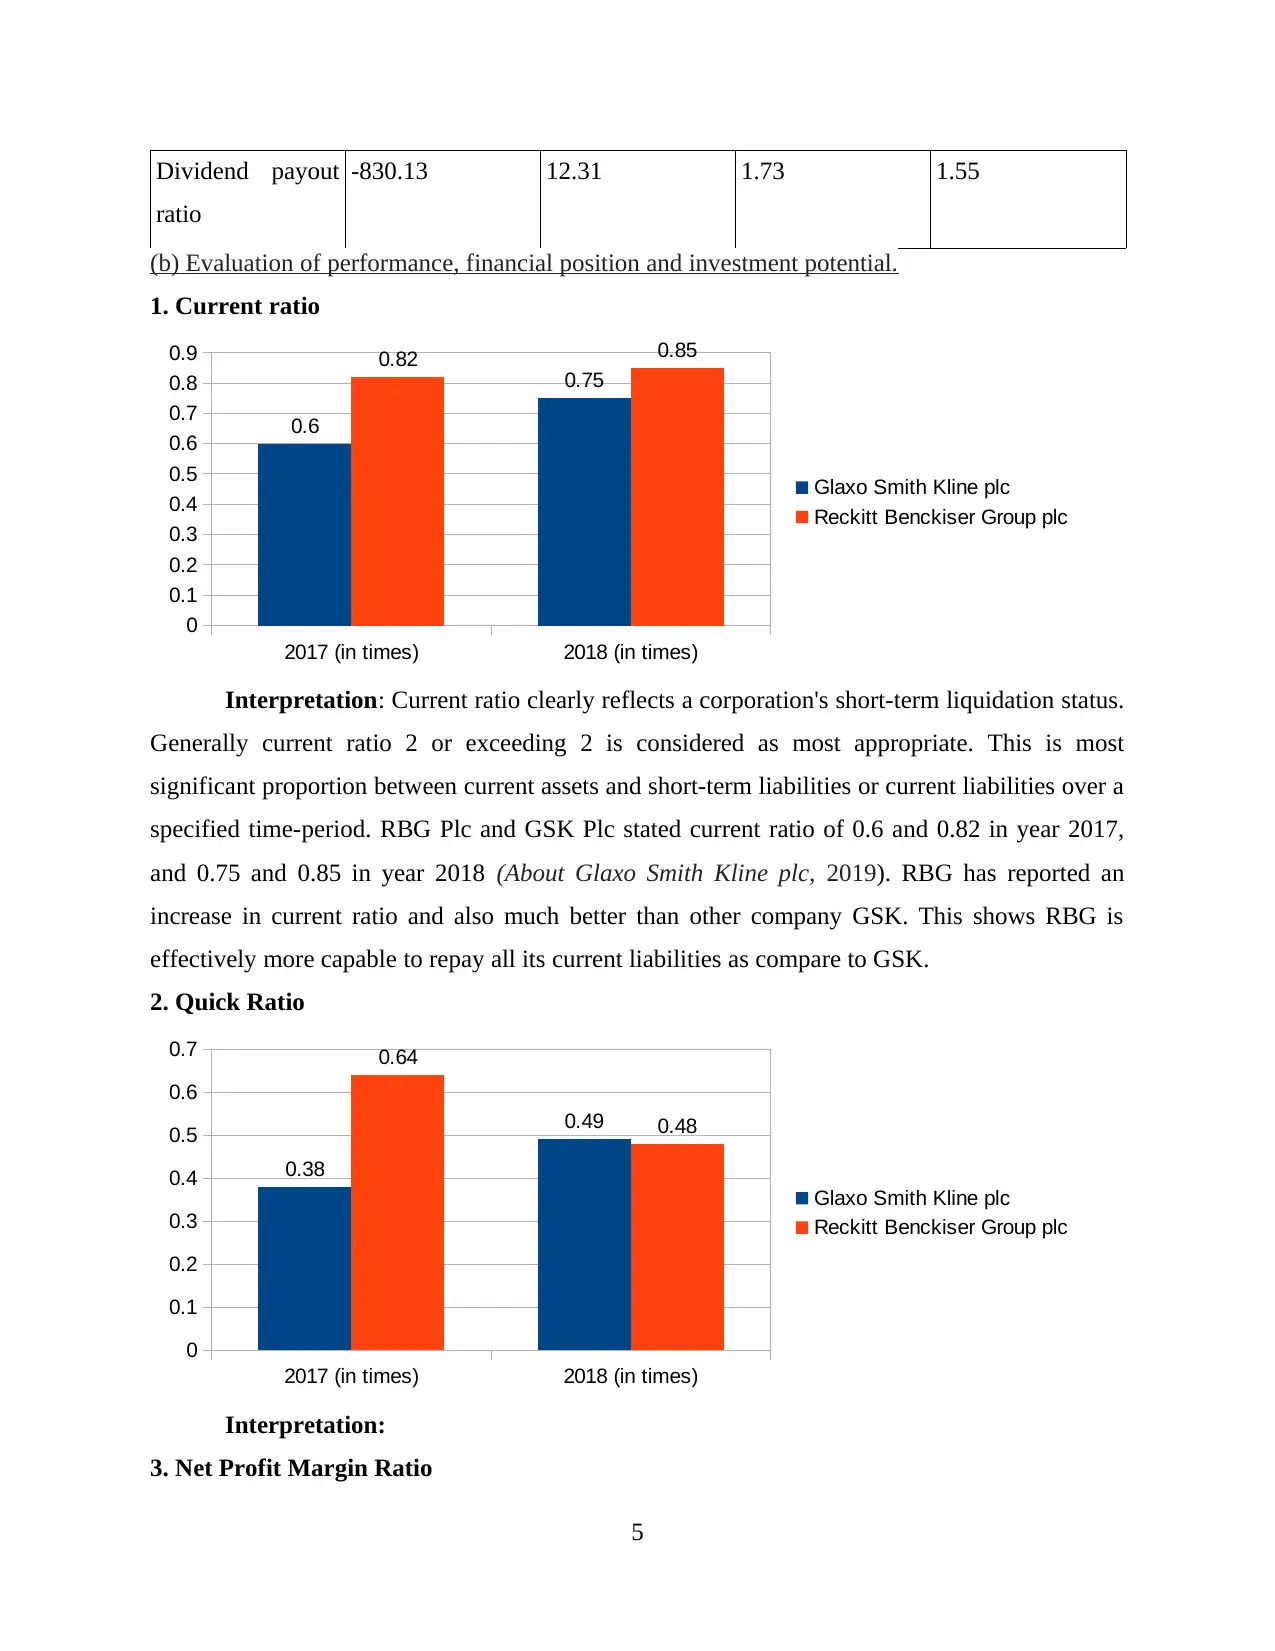
(b) Evaluation of performance, financial position and investment potential.
1. Current ratio
2017 (in times) 2018 (in times)
0
0.1
0.2
0.3
0.4
0.5
0.6
0.7
0.8
0.9
0.6
0.75
0.82 0.85
Glaxo Smith Kline plc
Reckitt Benckiser Group plc
Interpretation: Current ratio clearly reflects a corporation's short-term liquidation status.
Generally current ratio 2 or exceeding 2 is considered as most appropriate. This is most
significant proportion between current assets and short-term liabilities or current liabilities over a
specified time-period. RBG Plc and GSK Plc stated current ratio of 0.6 and 0.82 in year 2017,
and 0.75 and 0.85 in year 2018 (About Glaxo Smith Kline plc, 2019). RBG has reported an
increase in current ratio and also much better than other company GSK. This shows RBG is
effectively more capable to repay all its current liabilities as compare to GSK.
2. Quick Ratio
2017 (in times) 2018 (in times)
0
0.1
0.2
0.3
0.4
0.5
0.6
0.7
0.38
0.49
0.64
0.48
Glaxo Smith Kline plc
Reckitt Benckiser Group plc
Interpretation:
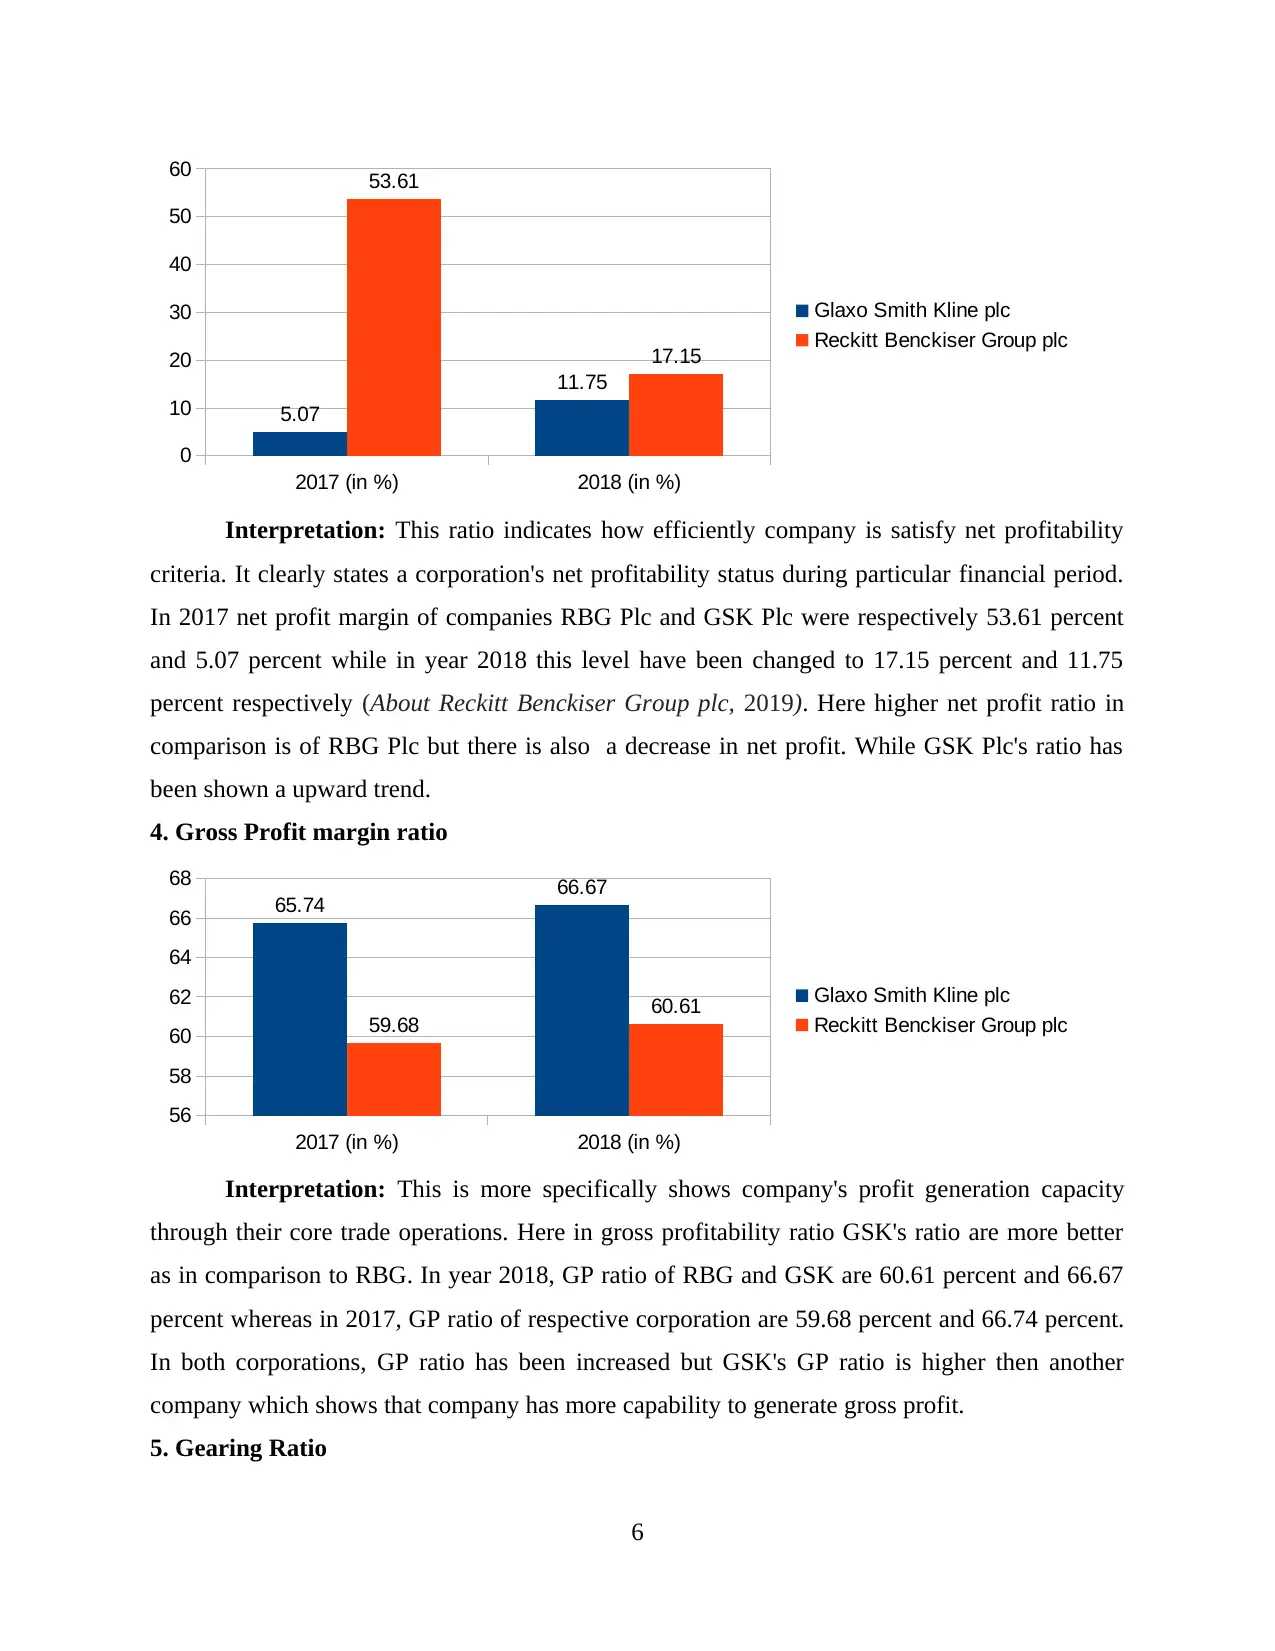
3. Net Profit Margin Ratio
5
ratio
-830.13 12.31 1.73 1.55
(b) Evaluation of performance, financial position and investment potential.
1. Current ratio
2017 (in times) 2018 (in times)
0
0.1
0.2
0.3
0.4
0.5
0.6
0.7
0.8
0.9
0.6
0.75
0.82 0.85
Glaxo Smith Kline plc
Reckitt Benckiser Group plc
Interpretation: Current ratio clearly reflects a corporation's short-term liquidation status.
Generally current ratio 2 or exceeding 2 is considered as most appropriate. This is most
significant proportion between current assets and short-term liabilities or current liabilities over a
specified time-period. RBG Plc and GSK Plc stated current ratio of 0.6 and 0.82 in year 2017,
and 0.75 and 0.85 in year 2018 (About Glaxo Smith Kline plc, 2019). RBG has reported an
increase in current ratio and also much better than other company GSK. This shows RBG is
effectively more capable to repay all its current liabilities as compare to GSK.
2. Quick Ratio
2017 (in times) 2018 (in times)
0
0.1
0.2
0.3
0.4
0.5
0.6
0.7
0.38
0.49
0.64
0.48
Glaxo Smith Kline plc
Reckitt Benckiser Group plc
Interpretation:
3. Net Profit Margin Ratio
5
2017 (in %) 2018 (in %)
0
10
20
30
40
50
60
5.07
11.75
53.61
17.15
Glaxo Smith Kline plc
Reckitt Benckiser Group plc
Interpretation: This ratio indicates how efficiently company is satisfy net profitability
criteria. It clearly states a corporation's net profitability status during particular financial period.
In 2017 net profit margin of companies RBG Plc and GSK Plc were respectively 53.61 percent
and 5.07 percent while in year 2018 this level have been changed to 17.15 percent and 11.75
percent respectively (About Reckitt Benckiser Group plc, 2019). Here higher net profit ratio in
comparison is of RBG Plc but there is also a decrease in net profit. While GSK Plc's ratio has
been shown a upward trend.
4. Gross Profit margin ratio
2017 (in %) 2018 (in %)
56
58
60
62
64
66
68
65.74 66.67
59.68 60.61 Glaxo Smith Kline plc
Reckitt Benckiser Group plc
Interpretation: This is more specifically shows company's profit generation capacity
through their core trade operations. Here in gross profitability ratio GSK's ratio are more better
as in comparison to RBG. In year 2018, GP ratio of RBG and GSK are 60.61 percent and 66.67
percent whereas in 2017, GP ratio of respective corporation are 59.68 percent and 66.74 percent.
In both corporations, GP ratio has been increased but GSK's GP ratio is higher then another
company which shows that company has more capability to generate gross profit.
5. Gearing Ratio
6
⊘ This is a preview!⊘
Do you want full access?
Subscribe today to unlock all pages.
Trusted by 1+ million students worldwide
2017 2018
0
2
4
6
8
10
12
14
0
12.32
1.74 1.55
Glaxo Smith Kline plc
Reckitt Benckiser Group plc
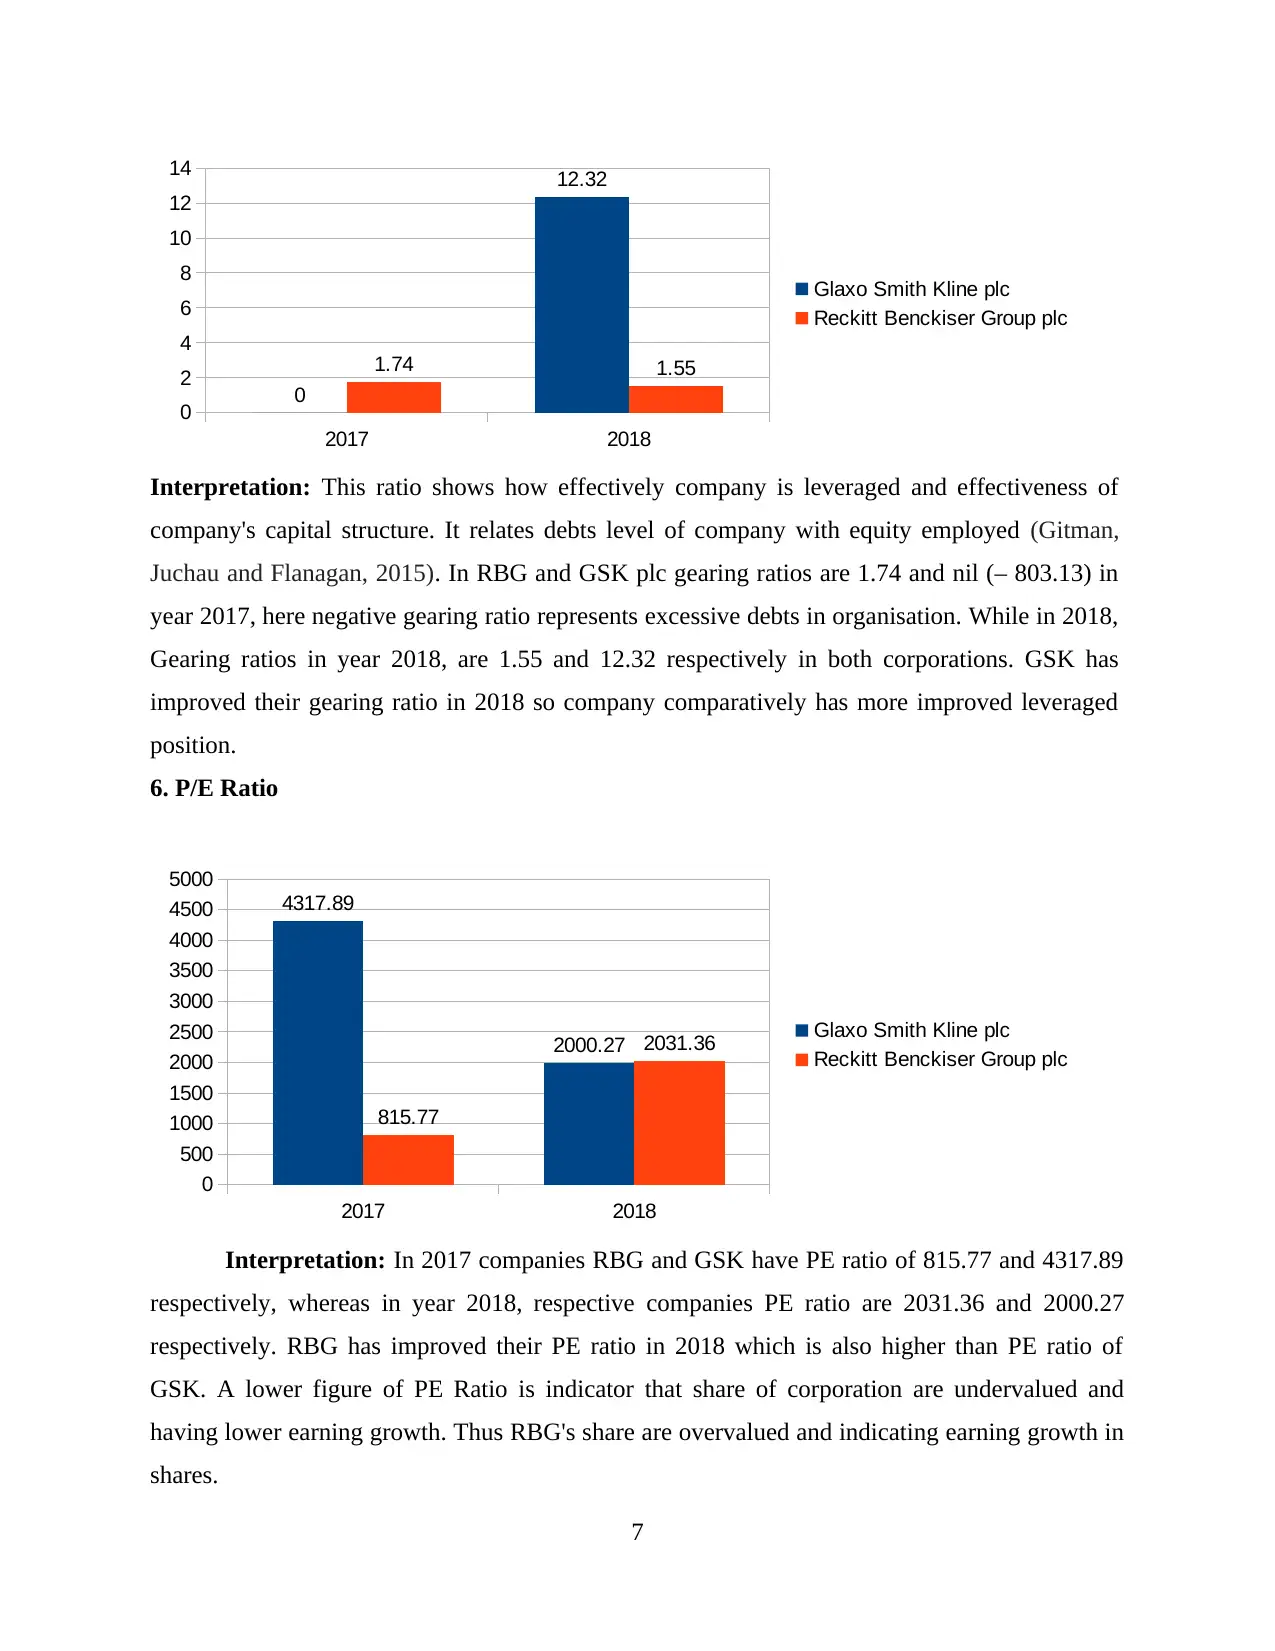
Interpretation: This ratio shows how effectively company is leveraged and effectiveness of
company's capital structure. It relates debts level of company with equity employed (Gitman,
Juchau and Flanagan, 2015). In RBG and GSK plc gearing ratios are 1.74 and nil (– 803.13) in
year 2017, here negative gearing ratio represents excessive debts in organisation. While in 2018,
Gearing ratios in year 2018, are 1.55 and 12.32 respectively in both corporations. GSK has
improved their gearing ratio in 2018 so company comparatively has more improved leveraged
position.
6. P/E Ratio
2017 2018
0
500
1000
1500
2000
2500
3000
3500
4000
4500
5000
4317.89
2000.27
815.77
2031.36 Glaxo Smith Kline plc
Reckitt Benckiser Group plc
Interpretation: In 2017 companies RBG and GSK have PE ratio of 815.77 and 4317.89
respectively, whereas in year 2018, respective companies PE ratio are 2031.36 and 2000.27
respectively. RBG has improved their PE ratio in 2018 which is also higher than PE ratio of
GSK. A lower figure of PE Ratio is indicator that share of corporation are undervalued and
having lower earning growth. Thus RBG's share are overvalued and indicating earning growth in
shares.
7
0
2
4
6
8
10
12
14
0
12.32
1.74 1.55
Glaxo Smith Kline plc
Reckitt Benckiser Group plc
Interpretation: This ratio shows how effectively company is leveraged and effectiveness of
company's capital structure. It relates debts level of company with equity employed (Gitman,
Juchau and Flanagan, 2015). In RBG and GSK plc gearing ratios are 1.74 and nil (– 803.13) in
year 2017, here negative gearing ratio represents excessive debts in organisation. While in 2018,
Gearing ratios in year 2018, are 1.55 and 12.32 respectively in both corporations. GSK has
improved their gearing ratio in 2018 so company comparatively has more improved leveraged
position.
6. P/E Ratio
2017 2018
0
500
1000
1500
2000
2500
3000
3500
4000
4500
5000
4317.89
2000.27
815.77
2031.36 Glaxo Smith Kline plc
Reckitt Benckiser Group plc
Interpretation: In 2017 companies RBG and GSK have PE ratio of 815.77 and 4317.89
respectively, whereas in year 2018, respective companies PE ratio are 2031.36 and 2000.27
respectively. RBG has improved their PE ratio in 2018 which is also higher than PE ratio of
GSK. A lower figure of PE Ratio is indicator that share of corporation are undervalued and
having lower earning growth. Thus RBG's share are overvalued and indicating earning growth in
shares.
7
Paraphrase This Document
Need a fresh take? Get an instant paraphrase of this document with our AI Paraphraser
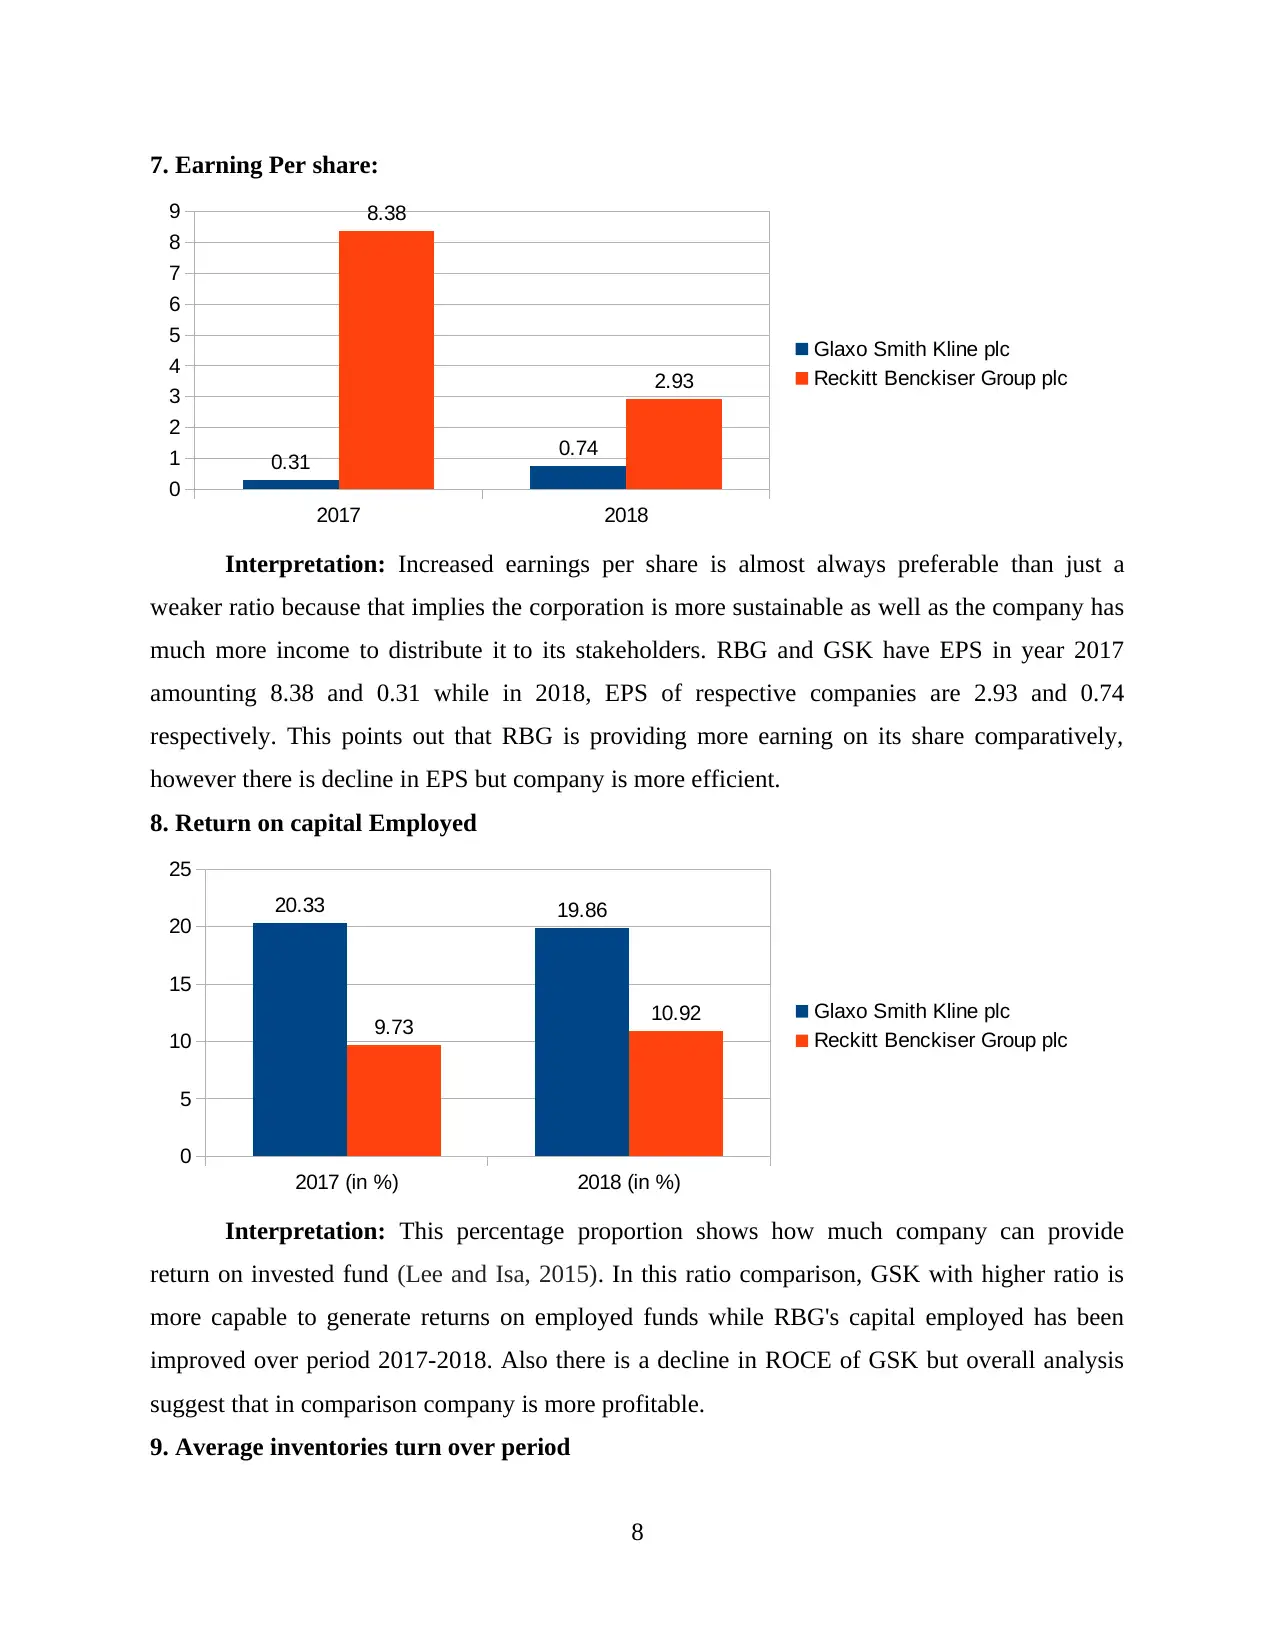
7. Earning Per share:
2017 2018
0
1
2
3
4
5
6
7
8
9
0.31 0.74
8.38
2.93
Glaxo Smith Kline plc
Reckitt Benckiser Group plc
Interpretation: Increased earnings per share is almost always preferable than just a
weaker ratio because that implies the corporation is more sustainable as well as the company has
much more income to distribute it to its stakeholders. RBG and GSK have EPS in year 2017
amounting 8.38 and 0.31 while in 2018, EPS of respective companies are 2.93 and 0.74
respectively. This points out that RBG is providing more earning on its share comparatively,
however there is decline in EPS but company is more efficient.
8. Return on capital Employed
2017 (in %) 2018 (in %)
0
5
10
15
20
25
20.33 19.86
9.73 10.92 Glaxo Smith Kline plc
Reckitt Benckiser Group plc
Interpretation: This percentage proportion shows how much company can provide
return on invested fund (Lee and Isa, 2015). In this ratio comparison, GSK with higher ratio is
more capable to generate returns on employed funds while RBG's capital employed has been
improved over period 2017-2018. Also there is a decline in ROCE of GSK but overall analysis
suggest that in comparison company is more profitable.
9. Average inventories turn over period
8
2017 (in days) 2018 (in days)
0
50
100
150
200
250
196 195
94 93.86 Glaxo Smith Kline plc
Reckitt Benckiser Group plc
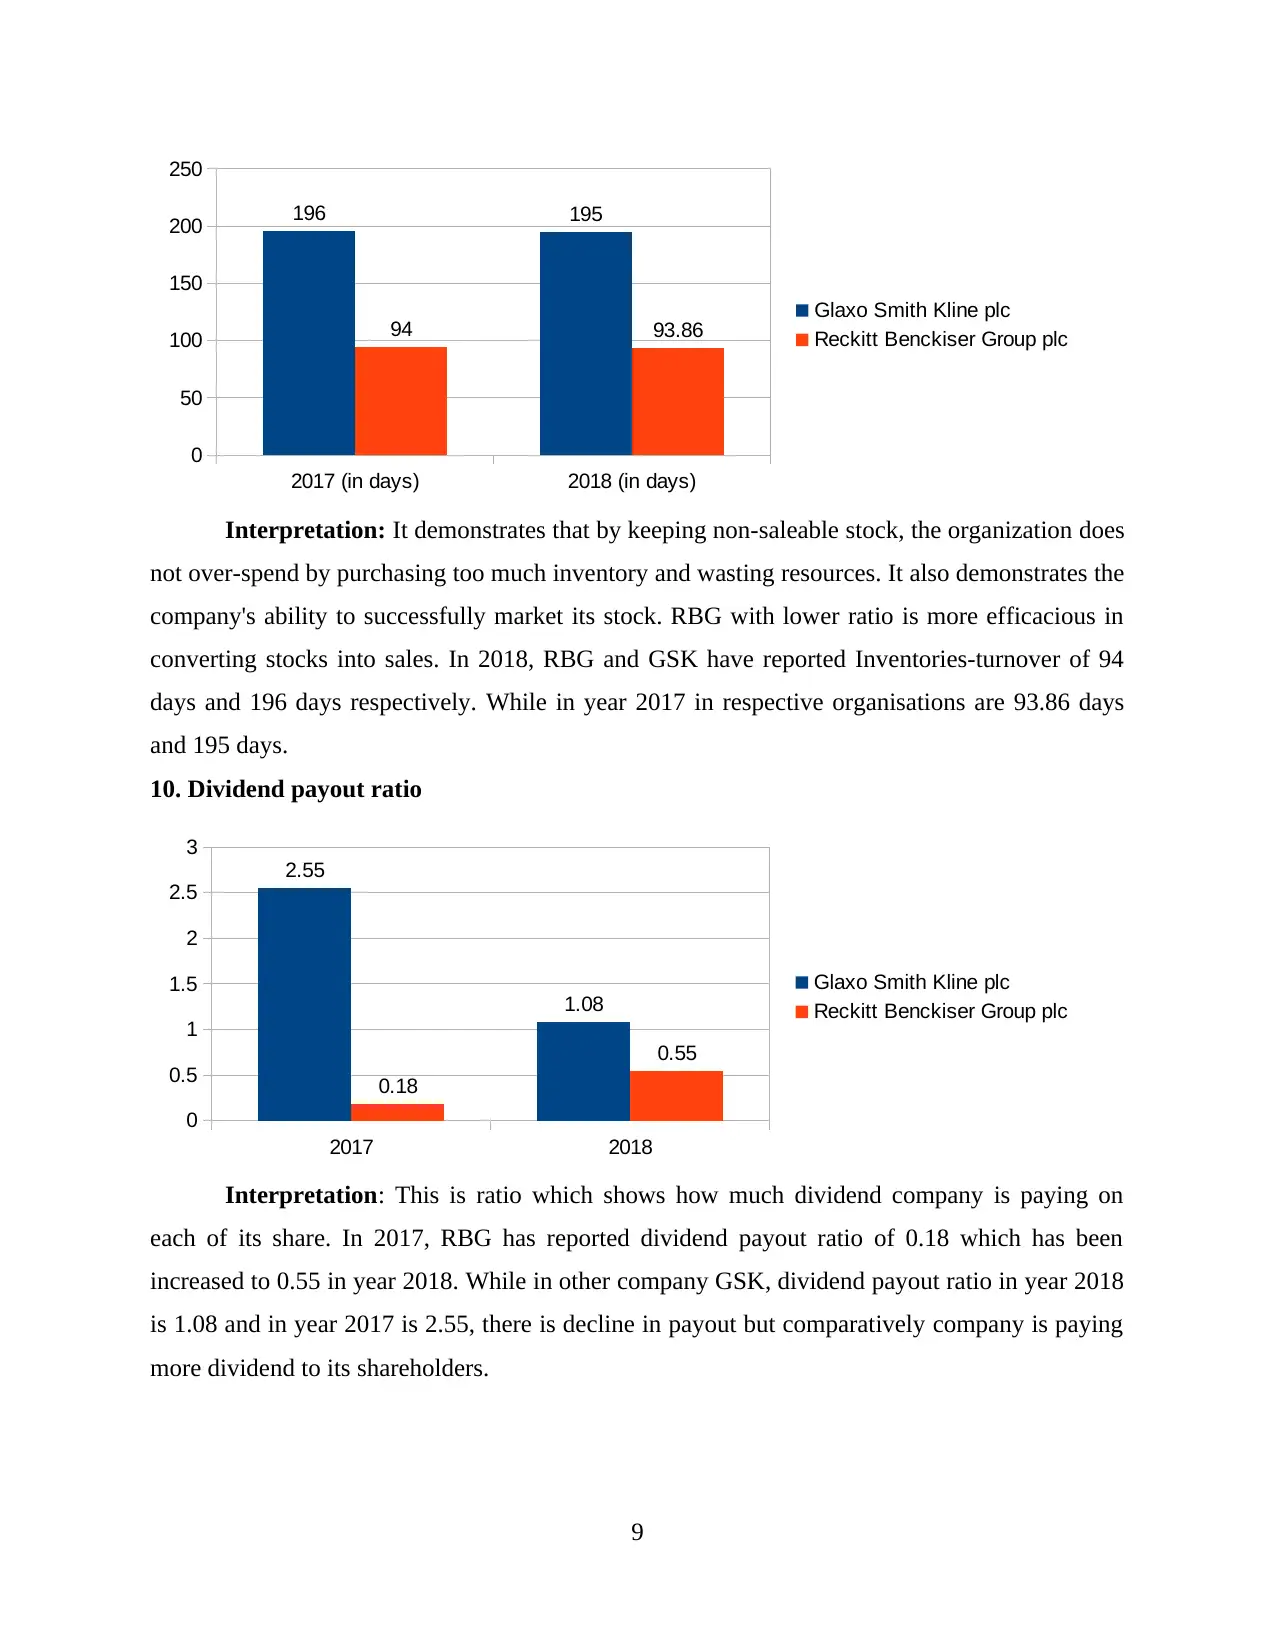
Interpretation: It demonstrates that by keeping non-saleable stock, the organization does
not over-spend by purchasing too much inventory and wasting resources. It also demonstrates the
company's ability to successfully market its stock. RBG with lower ratio is more efficacious in
converting stocks into sales. In 2018, RBG and GSK have reported Inventories-turnover of 94
days and 196 days respectively. While in year 2017 in respective organisations are 93.86 days
and 195 days.
10. Dividend payout ratio
2017 2018
0
0.5
1
1.5
2
2.5
3
2.55
1.08
0.18
0.55
Glaxo Smith Kline plc
Reckitt Benckiser Group plc
Interpretation: This is ratio which shows how much dividend company is paying on
each of its share. In 2017, RBG has reported dividend payout ratio of 0.18 which has been
increased to 0.55 in year 2018. While in other company GSK, dividend payout ratio in year 2018
is 1.08 and in year 2017 is 2.55, there is decline in payout but comparatively company is paying
more dividend to its shareholders.
9
0
50
100
150
200
250
196 195
94 93.86 Glaxo Smith Kline plc
Reckitt Benckiser Group plc
Interpretation: It demonstrates that by keeping non-saleable stock, the organization does
not over-spend by purchasing too much inventory and wasting resources. It also demonstrates the
company's ability to successfully market its stock. RBG with lower ratio is more efficacious in
converting stocks into sales. In 2018, RBG and GSK have reported Inventories-turnover of 94
days and 196 days respectively. While in year 2017 in respective organisations are 93.86 days
and 195 days.
10. Dividend payout ratio
2017 2018
0
0.5
1
1.5
2
2.5
3
2.55
1.08
0.18
0.55
Glaxo Smith Kline plc
Reckitt Benckiser Group plc
Interpretation: This is ratio which shows how much dividend company is paying on
each of its share. In 2017, RBG has reported dividend payout ratio of 0.18 which has been
increased to 0.55 in year 2018. While in other company GSK, dividend payout ratio in year 2018
is 1.08 and in year 2017 is 2.55, there is decline in payout but comparatively company is paying
more dividend to its shareholders.
9
⊘ This is a preview!⊘
Do you want full access?
Subscribe today to unlock all pages.
Trusted by 1+ million students worldwide
1 out of 20
Related Documents


Your All-in-One AI-Powered Toolkit for Academic Success.
+13062052269
info@desklib.com
Available 24*7 on WhatsApp / Email
![[object Object]](/_next/static/media/star-bottom.7253800d.svg)
Unlock your academic potential
Copyright © 2020–2026 A2Z Services. All Rights Reserved. Developed and managed by ZUCOL.